Races in Pittsburg, Kansas (KS) Detailed Stats
Data:
Races - White alone (%)
Races - White alone (% change since 2000)
Races - Black alone (%)
Races - Black alone (% change since 2000)
Races - American Indian alone (%)
Races - American Indian alone (% change since 2000)
Races - Asian alone (%)
Races - Asian alone (% change since 2000)
Races - Hispanic (%)
Races - Hispanic (% change since 2000)
Races - Native Hawaiian and Other Pacific Islander alone (%)
Races - Native Hawaiian and Other Pacific Islander alone (% change since 2000)
Races - Two or more races(%)
Races - Two or more races(% change since 2000)
Races - Other race alone (%)
Races - Other race alone (% change since 2000)
Racial diversity
Place of birth - Born in state of residence (%)
Place of birth - Born in state of residence (%) - White
Place of birth - Born in state of residence (%) - Black or African American
Place of birth - Born in state of residence (%) - Asian
Place of birth - Born in state of residence (%) - Hispanic or Latino
Place of birth - Born in state of residence (%) - American Indian and Alaska Native
Place of birth - Born in state of residence (%) - Multirace
Place of birth - Born in state of residence (%) - Other Race
Place of birth - Born in other state (%)
Place of birth - Born in other state (%) - White
Place of birth - Born in other state (%) - Black or African American
Place of birth - Born in other state (%) - Asian
Place of birth - Born in other state (%) - Hispanic or Latino
Place of birth - Born in other state (%) - American Indian and Alaska Native
Place of birth - Born in other state (%) - Multirace
Place of birth - Born in other state (%) - Other Race
Place of birth - Native, outside of US (%)
Place of birth - Native, outside of US (%) - White
Place of birth - Native, outside of US (%) - Black or African American
Place of birth - Native, outside of US (%) - Asian
Place of birth - Native, outside of US (%) - Hispanic or Latino
Place of birth - Native, outside of US (%) - American Indian and Alaska Native
Place of birth - Native, outside of US (%) - Multirace
Place of birth - Native, outside of US (%) - Other Race
Place of birth - Foreign born (%)
Place of birth - Foreign born (%) - White
Place of birth - Foreign born (%) - Black or African American
Place of birth - Foreign born (%) - Asian
Place of birth - Foreign born (%) - Hispanic or Latino
Place of birth - Foreign born (%) - American Indian and Alaska Native
Place of birth - Foreign born (%) - Multirace
Place of birth - Foreign born (%) - Other Race
Residents speaking English at home (%)
Residents speaking English at home - Born in the United States (%)
Residents speaking English at home - Native, born elsewhere (%)
Residents speaking English at home - Foreign born (%)
Residents speaking Spanish at home (%)
Residents speaking Spanish at home - Born in the United States (%)
Residents speaking Spanish at home - Native, born elsewhere (%)
Residents speaking Spanish at home - Foreign born (%)
Residents speaking other language at home (%)
Residents speaking other language at home - Born in the United States (%)
Residents speaking other language at home - Native, born elsewhere (%)
Residents speaking other language at home - Foreign born (%)
Marital status - Never married (%)
Marital status - Now married (%)
Marital status - Separated (%)
Marital status - Widowed (%)
Marital status - Divorced (%)
Ancestries Reported - Arab (%)
Ancestries Reported - Czech (%)
Ancestries Reported - Danish (%)
Ancestries Reported - Dutch (%)
Ancestries Reported - English (%)
Ancestries Reported - French (%)
Ancestries Reported - French Canadian (%)
Ancestries Reported - German (%)
Ancestries Reported - Greek (%)
Ancestries Reported - Hungarian (%)
Ancestries Reported - Irish (%)
Ancestries Reported - Italian (%)
Ancestries Reported - Lithuanian (%)
Ancestries Reported - Norwegian (%)
Ancestries Reported - Polish (%)
Ancestries Reported - Portuguese (%)
Ancestries Reported - Russian (%)
Ancestries Reported - Scotch-Irish (%)
Ancestries Reported - Scottish (%)
Ancestries Reported - Slovak (%)
Ancestries Reported - Subsaharan African (%)
Ancestries Reported - Swedish (%)
Ancestries Reported - Swiss (%)
Ancestries Reported - Ukrainian (%)
Ancestries Reported - United States (%)
Ancestries Reported - Welsh (%)
Ancestries Reported - West Indian (%)
Ancestries Reported - Other (%)
Geographical mobility - Same house 1 year ago (%)
Geographical mobility - Same house 1 year ago (%) - White
Geographical mobility - Same house 1 year ago (%) - Black or African American
Geographical mobility - Same house 1 year ago (%) - Asian
Geographical mobility - Same house 1 year ago (%) - Hispanic or Latino
Geographical mobility - Same house 1 year ago (%) - American Indian and Alaska Native
Geographical mobility - Same house 1 year ago (%) - Multirace
Geographical mobility - Same house 1 year ago (%) - Other Race
Geographical mobility - Moved within same county (%)
Geographical mobility - Moved within same county (%) - White
Geographical mobility - Moved within same county (%) - Black or African American
Geographical mobility - Moved within same county (%) - Asian
Geographical mobility - Moved within same county (%) - Hispanic or Latino
Geographical mobility - Moved within same county (%) - American Indian and Alaska Native
Geographical mobility - Moved within same county (%) - Multirace
Geographical mobility - Moved within same county (%) - Other Race
Geographical mobility - Moved from different county within same state (%)
Geographical mobility - Moved from different county within same state (%) - White
Geographical mobility - Moved from different county within same state (%) - Black or African American
Geographical mobility - Moved from different county within same state (%) - Asian
Geographical mobility - Moved from different county within same state (%) - Hispanic or Latino
Geographical mobility - Moved from different county within same state (%) - American Indian and Alaska Native
Geographical mobility - Moved from different county within same state (%) - Multirace
Geographical mobility - Moved from different county within same state (%) - Other Race
Geographical mobility - Moved from different state (%)
Geographical mobility - Moved from different state (%) - White
Geographical mobility - Moved from different state (%) - Black or African American
Geographical mobility - Moved from different state (%) - Asian
Geographical mobility - Moved from different state (%) - Hispanic or Latino
Geographical mobility - Moved from different state (%) - American Indian and Alaska Native
Geographical mobility - Moved from different state (%) - Multirace
Geographical mobility - Moved from different state (%) - Other Race
Geographical mobility - Moved from abroad (%)
Geographical mobility - Moved from abroad (%) - White
Geographical mobility - Moved from abroad (%) - Black or African American
Geographical mobility - Moved from abroad (%) - Asian
Geographical mobility - Moved from abroad (%) - Hispanic or Latino
Geographical mobility - Moved from abroad (%) - American Indian and Alaska Native
Geographical mobility - Moved from abroad (%) - Multirace
Geographical mobility - Moved from abroad (%) - Other Race
Place of birth for the foreign-born population - Ireland (%)
Place of birth for the foreign-born population - Denmark (%)
Place of birth for the foreign-born population - Norway (%)
Place of birth for the foreign-born population - Sweden (%)
Place of birth for the foreign-born population - United Kingdom (%)
Place of birth for the foreign-born population - England (%)
Place of birth for the foreign-born population - Scotland (%)
Place of birth for the foreign-born population - Other Northern Europe (%)
Place of birth for the foreign-born population - Austria (%)
Place of birth for the foreign-born population - Belgium (%)
Place of birth for the foreign-born population - France (%)
Place of birth for the foreign-born population - Germany (%)
Place of birth for the foreign-born population - Netherlands (%)
Place of birth for the foreign-born population - Switzerland (%)
Place of birth for the foreign-born population - Other Western Europe (%)
Place of birth for the foreign-born population - Greece (%)
Place of birth for the foreign-born population - Italy (%)
Place of birth for the foreign-born population - Portugal (%)
Place of birth for the foreign-born population - Spain (%)
Place of birth for the foreign-born population - Other Southern Europe (%)
Place of birth for the foreign-born population - Albania (%)
Place of birth for the foreign-born population - Belarus (%)
Place of birth for the foreign-born population - Bosnia and Herzegovina (%)
Place of birth for the foreign-born population - Bulgaria (%)
Place of birth for the foreign-born population - Croatia (%)
Place of birth for the foreign-born population - Czechoslovakia (%)
Place of birth for the foreign-born population - Hungary (%)
Place of birth for the foreign-born population - Latvia (%)
Place of birth for the foreign-born population - Lithuania (%)
Place of birth for the foreign-born population - North Macedonia (Macedonia) (%)
Place of birth for the foreign-born population - Moldova (%)
Place of birth for the foreign-born population - Poland (%)
Place of birth for the foreign-born population - Romania (%)
Place of birth for the foreign-born population - Russia (%)
Place of birth for the foreign-born population - Serbia (%)
Place of birth for the foreign-born population - Ukraine (%)
Place of birth for the foreign-born population - Other Eastern Europe (%)
Place of birth for the foreign-born population - China (%)
Place of birth for the foreign-born population - Hong Kong (%)
Place of birth for the foreign-born population - Taiwan (%)
Place of birth for the foreign-born population - Japan (%)
Place of birth for the foreign-born population - Korea (%)
Place of birth for the foreign-born population - Other Eastern Asia (%)
Place of birth for the foreign-born population - Afghanistan (%)
Place of birth for the foreign-born population - Bangladesh (%)
Place of birth for the foreign-born population - India (%)
Place of birth for the foreign-born population - Iran (%)
Place of birth for the foreign-born population - Kazakhstan (%)
Place of birth for the foreign-born population - Nepal (%)
Place of birth for the foreign-born population - Pakistan (%)
Place of birth for the foreign-born population - Sri Lanka (%)
Place of birth for the foreign-born population - Uzbekistan (%)
Place of birth for the foreign-born population - Other South Central Asia (%)
Place of birth for the foreign-born population - Burma (%)
Place of birth for the foreign-born population - Cambodia (%)
Place of birth for the foreign-born population - Indonesia (%)
Place of birth for the foreign-born population - Laos (%)
Place of birth for the foreign-born population - Malaysia (%)
Place of birth for the foreign-born population - Philippines (%)
Place of birth for the foreign-born population - Singapore (%)
Place of birth for the foreign-born population - Thailand (%)
Place of birth for the foreign-born population - Vietnam (%)
Place of birth for the foreign-born population - Other South Eastern Asia (%)
Place of birth for the foreign-born population - Armenia (%)
Place of birth for the foreign-born population - Iraq (%)
Place of birth for the foreign-born population - Israel (%)
Place of birth for the foreign-born population - Jordan (%)
Place of birth for the foreign-born population - Kuwait (%)
Place of birth for the foreign-born population - Lebanon (%)
Place of birth for the foreign-born population - Saudi Arabia (%)
Place of birth for the foreign-born population - Syria (%)
Place of birth for the foreign-born population - Turkey (%)
Place of birth for the foreign-born population - Yemen (%)
Place of birth for the foreign-born population - Other Western Asia (%)
Place of birth for the foreign-born population - Eritrea (%)
Place of birth for the foreign-born population - Ethiopia (%)
Place of birth for the foreign-born population - Kenya (%)
Place of birth for the foreign-born population - Somalia (%)
Place of birth for the foreign-born population - Uganda (%)
Place of birth for the foreign-born population - Zimbabwe (%)
Place of birth for the foreign-born population - Other Eastern Africa (%)
Place of birth for the foreign-born population - Cameroon (%)
Place of birth for the foreign-born population - Congo (%)
Place of birth for the foreign-born population - Democratic Republic of Congo (Zaire) (%)
Place of birth for the foreign-born population - Other Middle Africa (%)
Place of birth for the foreign-born population - Egypt (%)
Place of birth for the foreign-born population - Morocco (%)
Place of birth for the foreign-born population - Sudan (%)
Place of birth for the foreign-born population - Other Northern Africa (%)
Place of birth for the foreign-born population - South Africa (%)
Place of birth for the foreign-born population - Other Southern Africa (%)
Place of birth for the foreign-born population - Cabo Verde (%)
Place of birth for the foreign-born population - Ghana (%)
Place of birth for the foreign-born population - Liberia (%)
Place of birth for the foreign-born population - Nigeria (%)
Place of birth for the foreign-born population - Senegal (%)
Place of birth for the foreign-born population - Sierra Leone (%)
Place of birth for the foreign-born population - Other Western Africa (%)
Place of birth for the foreign-born population - Australia (%)
Place of birth for the foreign-born population - New Zealand (%)
Place of birth for the foreign-born population - Fiji (%)
Place of birth for the foreign-born population - Micronesia (%)
Place of birth for the foreign-born population - Bahamas (%)
Place of birth for the foreign-born population - Barbados (%)
Place of birth for the foreign-born population - Cuba (%)
Place of birth for the foreign-born population - Dominica (%)
Place of birth for the foreign-born population - Dominican Republic (%)
Place of birth for the foreign-born population - Grenada (%)
Place of birth for the foreign-born population - Haiti (%)
Place of birth for the foreign-born population - Jamaica (%)
Place of birth for the foreign-born population - St. Vincent and the Grenadines (%)
Place of birth for the foreign-born population - Trinidad and Tobago (%)
Place of birth for the foreign-born population - West Indies (%)
Place of birth for the foreign-born population - Other Caribbean (%)
Place of birth for the foreign-born population - Belize (%)
Place of birth for the foreign-born population - Costa Rica (%)
Place of birth for the foreign-born population - El Salvador (%)
Place of birth for the foreign-born population - Guatemala (%)
Place of birth for the foreign-born population - Honduras (%)
Place of birth for the foreign-born population - Mexico (%)
Place of birth for the foreign-born population - Nicaragua (%)
Place of birth for the foreign-born population - Panama (%)
Place of birth for the foreign-born population - Other Central America (%)
Place of birth for the foreign-born population - Argentina (%)
Place of birth for the foreign-born population - Bolivia (%)
Place of birth for the foreign-born population - Brazil (%)
Place of birth for the foreign-born population - Chile (%)
Place of birth for the foreign-born population - Colombia (%)
Place of birth for the foreign-born population - Ecuador (%)
Place of birth for the foreign-born population - Guyana (%)
Place of birth for the foreign-born population - Peru (%)
Place of birth for the foreign-born population - Uruguay (%)
Place of birth for the foreign-born population - Venezuela (%)
Place of birth for the foreign-born population - Other South America (%)
Place of birth for the foreign-born population - Canada (%)
Place of birth for the foreign-born population - Other Northern America (%)
Place of birth for the foreign-born population - Other (%)
Latest news about races in Pittsburg, KS collected exclusively by city-data.com from local newspapers, TV, and radio stations
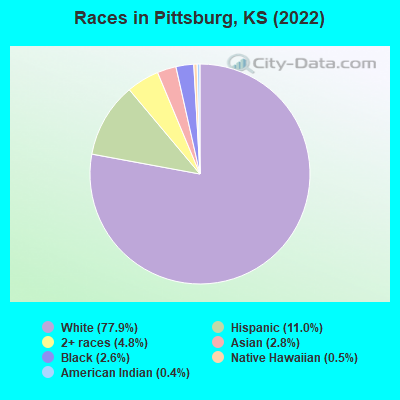
According to 2022 data, the most numerous races in Pittsburg, KS are White alone (16,055 residents), Hispanic (2,272 residents), and Black alone (541 residents). 92.6% of Pittsburg residents speak English at home. 4.9% of Pittsburg, KS residents are foreign-born (2.9% born in Latin America, 1.6% born in Asia), which is 41.9% less than the foreign-born rate of 7.0% across the entire state of Kansas.
Race distribution in Pittsburg
2000 2022
2,233,997 83.1% White alone 188,252 7.0% Hispanic 151,407 5.6% Black alone 46,301 1.7% Asian alone 42,508 1.6% Two or more races 22,322 0.8% American Indian alone 2,477 0.09% Other race alone 1,154 0.04% Native Hawaiian and Other
2,147,943 73.1% White alone 381,746 13.0% Hispanic 147,666 5.0% Black alone 145,362 4.9% Two or more races 85,085 2.9% Asian alone 13,263 0.5% Other race alone 12,065 0.4% American Indian alone 4,020 0.1% Native Hawaiian and Other
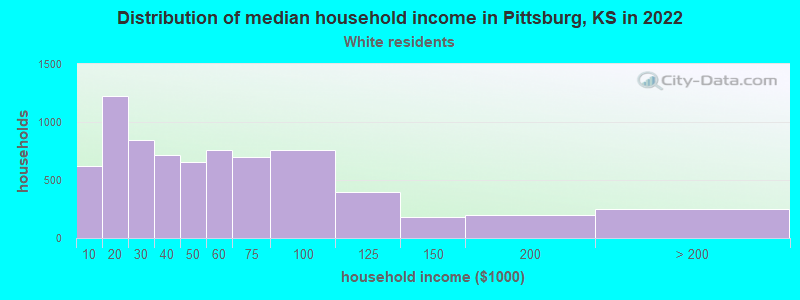
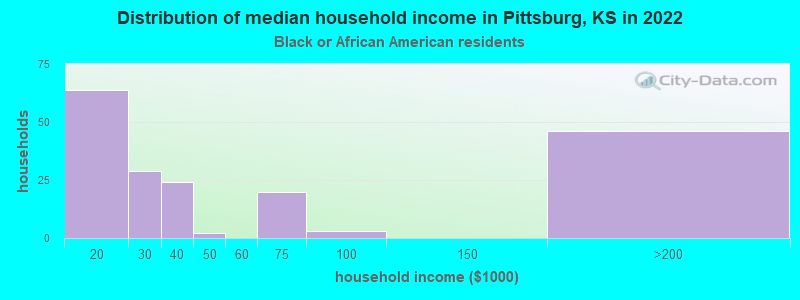
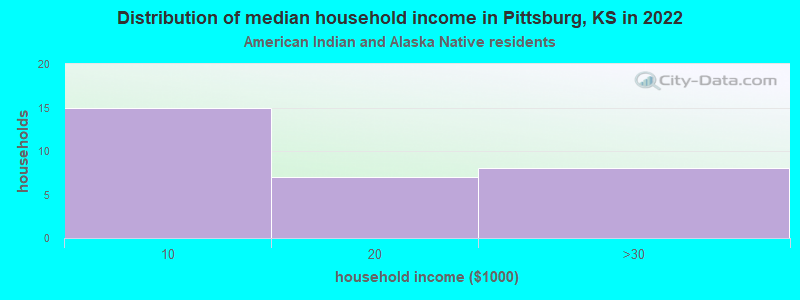
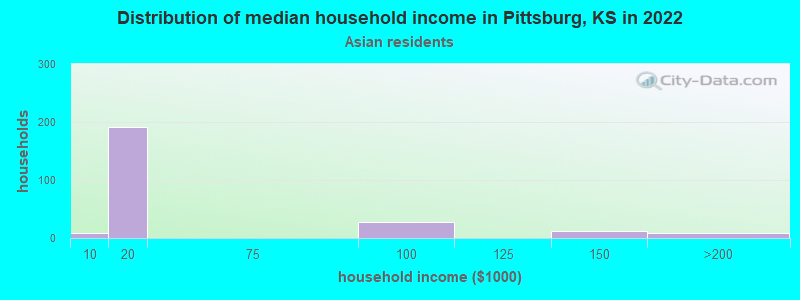
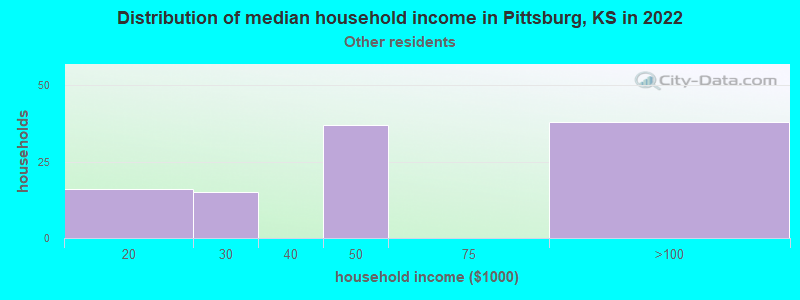
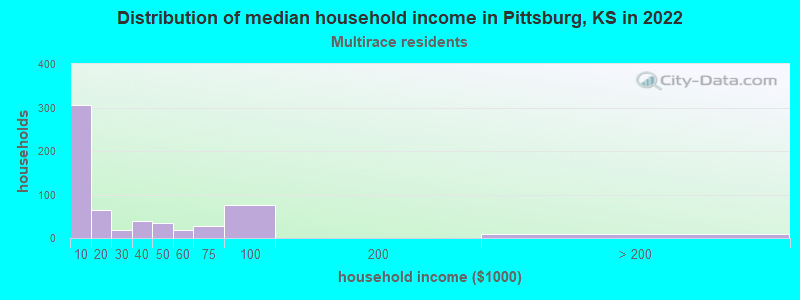
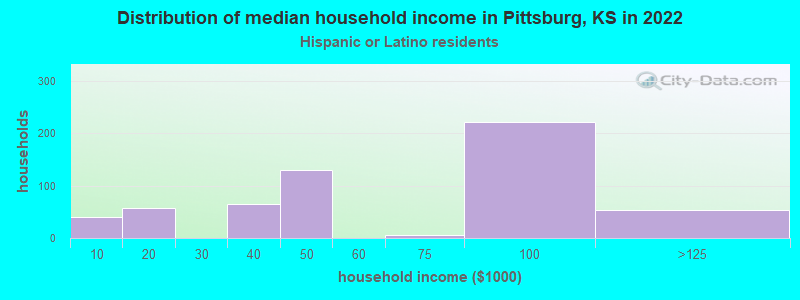
Income and house value in Pittsburg Median household income in 2022 $43,573 White non-Hispanic householders$3,029 American Indian and Alaska Native householders$19,876 Asian householders$49,090 Some other race householders$12,102 Two or more races householdersMedian 2022 house value $107,865 White Non-Hispanic householders$124,075 Black or African American householders$58,235 American Indian or Alaska Native householders $170,104 Asian householders$77,847 Some other race householders$82,650 Two or more races householders$75,646 Hispanic or Latino householders
Median age by race in Pittsburg
27.6 Median age for White residents26.0 29.5 21.7 Median age for Black or African American residents21.9 19.6 29.6 Median age for American Indian / Alaska Native residents24.3 37.1 24.6 Median age for Asian residents25.3 68.2 25.1 Median age for Native Hawaiian / Pacific Islander residents26.7 -641,269,840.6 24.2 Median age for Other race residents22.8 28.7 25.7 Median age for Two or more races residents25.6 25.7 27.9 Median age for White alone residents26.1 30.2 24.8 Median age for Hispanic or Latino residents24.9 24.7
Owner/renter occupied households by race in Pittsburg
House owners and renters - White residents 3,263 45.9% Owner occupied3,851 54.1% Renter occupiedHouse owners and renters - Black or African American residents 3 1.5% Owner occupied197 98.5% Renter occupiedHouse owners and renters - American Indian / Alaska Native residents 12 35.6% Owner occupied21 64.4% Renter occupiedHouse owners and renters - Asian residents 308 89.6% Owner occupied36 10.4% Renter occupiedHouse owners and renters - Native Hawaiian / Pacific Islander residents 17 100.0% Renter occupiedHouse owners and renters - Other race residents 91 87.2% Owner occupied13 12.8% Renter occupiedHouse owners and renters - Two or more races residents 120 21.6% Owner occupied436 78.4% Renter occupiedHouse owners and renters - White alone residents 3,165 46.3% Owner occupied3,674 53.7% Renter occupiedHouse owners and renters - Hispanic or Latino residents 242 42.1% Owner occupied333 57.9% Renter occupied
Language usage in Pittsburg
English speakers - Total 92.6% of residents of Pittsburg speak English at home.
5.5% of residents speak Spanish at home 838 78.2% Speak English very well233 21.8% Speak English less than very well2.0% of residents speak other language at home 351 90.7% Speak English very well36 9.3% Speak English less than very well
English speakers - Born in the United States 94.9% of residents of Pittsburg speak English at home.
4.1% of residents speak Spanish at home 294 99.3% Speak English very well2 0.7% Speak English less than very well0.9% of residents speak other language at home 69 100.0% Speak English very well
English speakers - Native, born elsewhere 92.0% of residents of Pittsburg speak English at home.
6.5% of residents speak Spanish at home 7 26.9% Speak English very well19 73.1% Speak English less than very well4.0% of residents speak other language at home 16 100.0% Speak English very well
English speakers - Foreign-born 29.8% of residents of Pittsburg speak English at home.
43.8% of residents speak Spanish at home 216 50.9% Speak English very well208 49.1% Speak English less than very well28.0% of residents speak other language at home 233 86.0% Speak English very well38 14.0% Speak English less than very well
White (Caucasian) - Speak only English Native:
98.3% (15,560)Foreign-born:
57.5% (145)
White (Caucasian) - Speak another language Native:
1.9% (297)Foreign-born:
53.0% (134)
Black or African American - Speak only English Native:
93.2% (530)Foreign-born:
5.1% (1)
Black or African American - Speak another language Native:
7.2% (41)Foreign-born:
93.5% (19)
Asian - Speak only English Native:
100.0% (286)Foreign-born:
33.8% (96)
Asian - Speak another language Native:
4.3% (12)Foreign-born:
65.3% (186)
Other race - Speak another language Native:
66.9% (103)Foreign-born:
96.6% (64)
Two or more races - Speak another language Native:
22.7% (275)Foreign-born:
100.0% (231)
White alone - Speak only English Native:
99.3% (14,953)Foreign-born:
69.9% (64)
White alone - Speak another language Native:
0.8% (118)Foreign-born:
26.0% (24)
Hispanic or Latino - Speak only English Native:
59.8% (870)Foreign-born:
24.0% (131)
Hispanic or Latino - Speak another language Native:
40.3% (586)Foreign-born:
79.6% (433)
Foreign-born residents in Pittsburg 1,017 residents are foreign born (2.9% Latin America , 1.6% Asia ).
This city:
4.9%Kansas:
7.1%
Marital status for residents in Pittsburg Marital status - White (Caucasian) population 15 years and over
Males 51.0% Never married34.7% Now married1.1% Separated2.4% Widowed10.8% DivorcedFemales 40.6% Never married32.3% Now married4.8% Separated9.2% Widowed13.1% DivorcedWomen who gave birth in the past 12 months Now married:
58.0% (165)Unmarried:
42.0% (120)
Women who did not give birth in the past 12 months Now married:
29.8% (1,279)Unmarried:
70.2% (3,013)
Marital status - Black or African American population 15 years and over
Males 60.8% Never married16.0% Now married2.5% Separated0.0% Widowed20.7% DivorcedFemales 46.8% Never married31.0% Now married5.6% Separated4.8% Widowed11.9% DivorcedWomen who gave birth in the past 12 months Now married:
100.0% (16)Unmarried:
0.0% (0)
Women who did not give birth in the past 12 months Now married:
22.1% (21)Unmarried:
77.9% (75)
Marital status - American Indian / Alaska Native population 15 years and over
Males 66.1% Never married0.0% Now married0.0% Separated0.0% Widowed33.9% DivorcedFemales 25.0% Never married60.0% Now married0.0% Separated0.0% Widowed15.0% DivorcedWomen who did not give birth in the past 12 months Now married:
48.4% (17)Unmarried:
51.6% (18)
Marital status - Asian population 15 years and over
Males 33.5% Never married66.5% Now married0.0% Separated0.0% Widowed0.0% DivorcedFemales 0.0% Never married100.0% Now married0.0% Separated0.0% Widowed0.0% DivorcedWomen who did not give birth in the past 12 months Now married:
100.0% (8)Unmarried:
0.0% (0)
Marital status - Native Hawaiian / Pacific Islander population 15 years and over
Males 61.5% Never married38.5% Now married0.0% Separated0.0% Widowed0.0% DivorcedFemales 0.0% Never married100.0% Now married0.0% Separated0.0% Widowed0.0% DivorcedMarital status - Other race population 15 years and over
Males 40.0% Never married60.0% Now married0.0% Separated0.0% Widowed0.0% DivorcedFemales 39.0% Never married50.0% Now married0.0% Separated11.0% Widowed0.0% DivorcedWomen who gave birth in the past 12 months Now married:
100.0% (40)Unmarried:
0.0% (0)
Women who did not give birth in the past 12 months Now married:
15.2% (9)Unmarried:
84.8% (49)
Marital status - Two or more races population 15 years and over
Males 67.1% Never married15.5% Now married0.0% Separated4.8% Widowed12.6% DivorcedFemales 51.2% Never married33.3% Now married0.0% Separated3.6% Widowed11.8% DivorcedWomen who gave birth in the past 12 months Now married:
0.0% (0)Unmarried:
100.0% (5)
Women who did not give birth in the past 12 months Now married:
33.7% (149)Unmarried:
66.3% (294)
Marital status - White alone, not Hispanic / Latino population 15 years and over
Males 51.2% Never married33.5% Now married1.2% Separated2.6% Widowed11.5% DivorcedFemales 41.4% Never married30.4% Now married5.1% Separated9.9% Widowed13.2% DivorcedWomen who gave birth in the past 12 months Now married:
57.5% (166)Unmarried:
42.5% (123)
Women who did not give birth in the past 12 months Now married:
26.8% (1,075)Unmarried:
73.2% (2,935)
Marital status - Hispanic or Latino population 15 years and over
Males 44.1% Never married47.8% Now married0.0% Separated0.0% Widowed8.1% DivorcedFemales 31.7% Never married59.2% Now married0.0% Separated0.0% Widowed9.1% DivorcedWomen who gave birth in the past 12 months Now married:
97.4% (39)Unmarried:
2.6% (1)
Women who did not give birth in the past 12 months Now married:
54.8% (331)Unmarried:
45.2% (273)
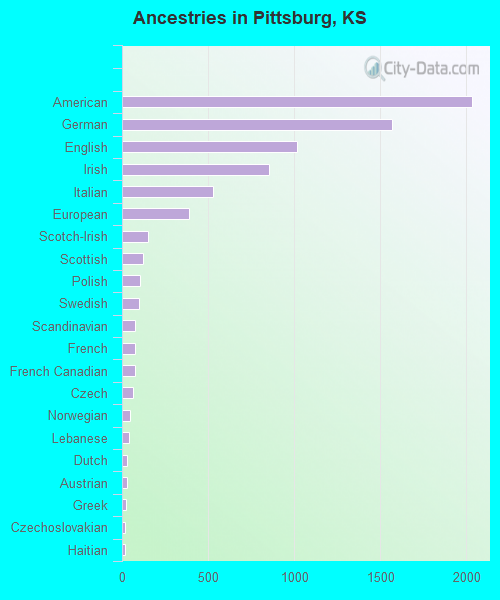
Ancestries in Pittsburg
2,030 20.1% American1,566 15.5% German1,014 10.0% English852 8.4% Irish526 5.2% Italian392 3.9% European153 1.5% Scotch-Irish122 1.2% Scottish102 1.0% Polish101 1.0% Swedish77 0.8% Scandinavian74 0.7% French73 0.7% French Canadian66 0.7% Czech44 0.4% Norwegian41 0.4% Lebanese29 0.3% Dutch28 0.3% Austrian25 0.2% Greek20 0.2% Czechoslovakian20 0.2% Haitian17 0.2% Russian16 0.2% Iranian8 0.08% Welsh7 0.07% Arab6 0.06% Slovene5 0.05% Belgian5 0.05% Eastern European5 0.05% Lithuanian5 0.05% Kenyan5 0.05% British4 0.04% Yugoslavian3 0.03% Romanian3 0.03% Northern European1 0.01% Finnish
Geographical mobility in Pittsburg Same house 1 year ago 12,031 71.1% White (Caucasian)389 62.1% Black or African American90 74.3% American Indian / Alaska Native513 90.6% Asian62 100.0% Native Hawaiian / Pacific Islander207 95.5% Other race1,182 79.3% Two or more races11,070 70.1% White alone, not Hispanic / Latino1,922 84.3% Hispanic or LatinoMoved within same county 2,214 13.1% White / Caucasian112 17.9% Black or African American13 10.7% American Indian / Alaska Native117 7.8% Two or more races2,130 13.5% White alone, not Hispanic / Latino202 8.9% Hispanic or LatinoMoved within same state 1,284 7.6% White / Caucasian127 20.2% Black or African American13 10.5% American Indian / Alaska Native7 1.2% Asian9 4.3% Other race29 1.9% Two or more races1,309 8.3% White alone, not Hispanic / Latino43 1.9% Hispanic or LatinoMoved from different state 1,231 7.3% White / Caucasian2 0.3% Black or African American43 7.6% Asian4 1.8% Other race144 9.6% Two or more races1,172 7.4% White alone, not Hispanic / Latino74 3.2% Hispanic or LatinoMoved from abroad 31 0.2% White5 0.3% Two or more races7 0.0% White alone, not Hispanic / Latino43 1.9% Hispanic or Latino
Children Nativity (place of birth) in Pittsburg
Children under 6 years - Living with two parents Both parents native 698 100.0% NativeBoth parents foreign-born 61 100.0% NativeOne native, one foreign-born parent 68 100.0% NativeChildren under 6 years - Living with one parent Native parent 472 100.0% NativeForeign-born parent 50 61.9% Native31 38.1% Foreign-bornChildren 6 to 17 years - Living with two parents Both parents native 1,051 99.9% Native1 0.1% Foreign-bornBoth parents foreign-born 94 100.0% NativeOne native, one foreign-born parent 172 96.3% Native7 3.7% Foreign-bornChildren 6 to 17 years - Living with one parent Native parent 1,346 100.0% NativeForeign-born parent 56 50.2% Native55 49.8% Foreign-born
Grandparents responsible for own grandchildren in Pittsburg
Grandparents (30 to 59 years) White / Caucasian 52 42.8% Responsible for grandchildren70 57.2% Not responsible for grandchildrenWhite alone, not Hispanic / Latino 55 42.2% Responsible for grandchildren76 57.8% Not responsible for grandchildrenGrandparents (60 years and over) White / Caucasian 90 54.2% Responsible for grandchildren77 45.8% Not responsible for grandchildrenWhite alone, not Hispanic / Latino 93 52.5% Responsible for grandchildren84 47.5% Not responsible for grandchildren