Races in Pinewood, Florida (FL) Detailed Stats
Data:
Races - White alone (%)
Races - White alone (% change since 2000)
Races - Black alone (%)
Races - Black alone (% change since 2000)
Races - American Indian alone (%)
Races - American Indian alone (% change since 2000)
Races - Asian alone (%)
Races - Asian alone (% change since 2000)
Races - Hispanic (%)
Races - Hispanic (% change since 2000)
Races - Native Hawaiian and Other Pacific Islander alone (%)
Races - Native Hawaiian and Other Pacific Islander alone (% change since 2000)
Races - Two or more races(%)
Races - Two or more races(% change since 2000)
Races - Other race alone (%)
Races - Other race alone (% change since 2000)
Racial diversity
Place of birth - Born in state of residence (%)
Place of birth - Born in state of residence (%) - White
Place of birth - Born in state of residence (%) - Black or African American
Place of birth - Born in state of residence (%) - Asian
Place of birth - Born in state of residence (%) - Hispanic or Latino
Place of birth - Born in state of residence (%) - American Indian and Alaska Native
Place of birth - Born in state of residence (%) - Multirace
Place of birth - Born in state of residence (%) - Other Race
Place of birth - Born in other state (%)
Place of birth - Born in other state (%) - White
Place of birth - Born in other state (%) - Black or African American
Place of birth - Born in other state (%) - Asian
Place of birth - Born in other state (%) - Hispanic or Latino
Place of birth - Born in other state (%) - American Indian and Alaska Native
Place of birth - Born in other state (%) - Multirace
Place of birth - Born in other state (%) - Other Race
Place of birth - Native, outside of US (%)
Place of birth - Native, outside of US (%) - White
Place of birth - Native, outside of US (%) - Black or African American
Place of birth - Native, outside of US (%) - Asian
Place of birth - Native, outside of US (%) - Hispanic or Latino
Place of birth - Native, outside of US (%) - American Indian and Alaska Native
Place of birth - Native, outside of US (%) - Multirace
Place of birth - Native, outside of US (%) - Other Race
Place of birth - Foreign born (%)
Place of birth - Foreign born (%) - White
Place of birth - Foreign born (%) - Black or African American
Place of birth - Foreign born (%) - Asian
Place of birth - Foreign born (%) - Hispanic or Latino
Place of birth - Foreign born (%) - American Indian and Alaska Native
Place of birth - Foreign born (%) - Multirace
Place of birth - Foreign born (%) - Other Race
Residents speaking English at home (%)
Residents speaking English at home - Born in the United States (%)
Residents speaking English at home - Native, born elsewhere (%)
Residents speaking English at home - Foreign born (%)
Residents speaking Spanish at home (%)
Residents speaking Spanish at home - Born in the United States (%)
Residents speaking Spanish at home - Native, born elsewhere (%)
Residents speaking Spanish at home - Foreign born (%)
Residents speaking other language at home (%)
Residents speaking other language at home - Born in the United States (%)
Residents speaking other language at home - Native, born elsewhere (%)
Residents speaking other language at home - Foreign born (%)
Marital status - Never married (%)
Marital status - Now married (%)
Marital status - Separated (%)
Marital status - Widowed (%)
Marital status - Divorced (%)
Ancestries Reported - Arab (%)
Ancestries Reported - Czech (%)
Ancestries Reported - Danish (%)
Ancestries Reported - Dutch (%)
Ancestries Reported - English (%)
Ancestries Reported - French (%)
Ancestries Reported - French Canadian (%)
Ancestries Reported - German (%)
Ancestries Reported - Greek (%)
Ancestries Reported - Hungarian (%)
Ancestries Reported - Irish (%)
Ancestries Reported - Italian (%)
Ancestries Reported - Lithuanian (%)
Ancestries Reported - Norwegian (%)
Ancestries Reported - Polish (%)
Ancestries Reported - Portuguese (%)
Ancestries Reported - Russian (%)
Ancestries Reported - Scotch-Irish (%)
Ancestries Reported - Scottish (%)
Ancestries Reported - Slovak (%)
Ancestries Reported - Subsaharan African (%)
Ancestries Reported - Swedish (%)
Ancestries Reported - Swiss (%)
Ancestries Reported - Ukrainian (%)
Ancestries Reported - United States (%)
Ancestries Reported - Welsh (%)
Ancestries Reported - West Indian (%)
Ancestries Reported - Other (%)
Geographical mobility - Same house 1 year ago (%)
Geographical mobility - Same house 1 year ago (%) - White
Geographical mobility - Same house 1 year ago (%) - Black or African American
Geographical mobility - Same house 1 year ago (%) - Asian
Geographical mobility - Same house 1 year ago (%) - Hispanic or Latino
Geographical mobility - Same house 1 year ago (%) - American Indian and Alaska Native
Geographical mobility - Same house 1 year ago (%) - Multirace
Geographical mobility - Same house 1 year ago (%) - Other Race
Geographical mobility - Moved within same county (%)
Geographical mobility - Moved within same county (%) - White
Geographical mobility - Moved within same county (%) - Black or African American
Geographical mobility - Moved within same county (%) - Asian
Geographical mobility - Moved within same county (%) - Hispanic or Latino
Geographical mobility - Moved within same county (%) - American Indian and Alaska Native
Geographical mobility - Moved within same county (%) - Multirace
Geographical mobility - Moved within same county (%) - Other Race
Geographical mobility - Moved from different county within same state (%)
Geographical mobility - Moved from different county within same state (%) - White
Geographical mobility - Moved from different county within same state (%) - Black or African American
Geographical mobility - Moved from different county within same state (%) - Asian
Geographical mobility - Moved from different county within same state (%) - Hispanic or Latino
Geographical mobility - Moved from different county within same state (%) - American Indian and Alaska Native
Geographical mobility - Moved from different county within same state (%) - Multirace
Geographical mobility - Moved from different county within same state (%) - Other Race
Geographical mobility - Moved from different state (%)
Geographical mobility - Moved from different state (%) - White
Geographical mobility - Moved from different state (%) - Black or African American
Geographical mobility - Moved from different state (%) - Asian
Geographical mobility - Moved from different state (%) - Hispanic or Latino
Geographical mobility - Moved from different state (%) - American Indian and Alaska Native
Geographical mobility - Moved from different state (%) - Multirace
Geographical mobility - Moved from different state (%) - Other Race
Geographical mobility - Moved from abroad (%)
Geographical mobility - Moved from abroad (%) - White
Geographical mobility - Moved from abroad (%) - Black or African American
Geographical mobility - Moved from abroad (%) - Asian
Geographical mobility - Moved from abroad (%) - Hispanic or Latino
Geographical mobility - Moved from abroad (%) - American Indian and Alaska Native
Geographical mobility - Moved from abroad (%) - Multirace
Geographical mobility - Moved from abroad (%) - Other Race
Place of birth for the foreign-born population - Ireland (%)
Place of birth for the foreign-born population - Denmark (%)
Place of birth for the foreign-born population - Norway (%)
Place of birth for the foreign-born population - Sweden (%)
Place of birth for the foreign-born population - United Kingdom (%)
Place of birth for the foreign-born population - England (%)
Place of birth for the foreign-born population - Scotland (%)
Place of birth for the foreign-born population - Other Northern Europe (%)
Place of birth for the foreign-born population - Austria (%)
Place of birth for the foreign-born population - Belgium (%)
Place of birth for the foreign-born population - France (%)
Place of birth for the foreign-born population - Germany (%)
Place of birth for the foreign-born population - Netherlands (%)
Place of birth for the foreign-born population - Switzerland (%)
Place of birth for the foreign-born population - Other Western Europe (%)
Place of birth for the foreign-born population - Greece (%)
Place of birth for the foreign-born population - Italy (%)
Place of birth for the foreign-born population - Portugal (%)
Place of birth for the foreign-born population - Spain (%)
Place of birth for the foreign-born population - Other Southern Europe (%)
Place of birth for the foreign-born population - Albania (%)
Place of birth for the foreign-born population - Belarus (%)
Place of birth for the foreign-born population - Bosnia and Herzegovina (%)
Place of birth for the foreign-born population - Bulgaria (%)
Place of birth for the foreign-born population - Croatia (%)
Place of birth for the foreign-born population - Czechoslovakia (%)
Place of birth for the foreign-born population - Hungary (%)
Place of birth for the foreign-born population - Latvia (%)
Place of birth for the foreign-born population - Lithuania (%)
Place of birth for the foreign-born population - North Macedonia (Macedonia) (%)
Place of birth for the foreign-born population - Moldova (%)
Place of birth for the foreign-born population - Poland (%)
Place of birth for the foreign-born population - Romania (%)
Place of birth for the foreign-born population - Russia (%)
Place of birth for the foreign-born population - Serbia (%)
Place of birth for the foreign-born population - Ukraine (%)
Place of birth for the foreign-born population - Other Eastern Europe (%)
Place of birth for the foreign-born population - China (%)
Place of birth for the foreign-born population - Hong Kong (%)
Place of birth for the foreign-born population - Taiwan (%)
Place of birth for the foreign-born population - Japan (%)
Place of birth for the foreign-born population - Korea (%)
Place of birth for the foreign-born population - Other Eastern Asia (%)
Place of birth for the foreign-born population - Afghanistan (%)
Place of birth for the foreign-born population - Bangladesh (%)
Place of birth for the foreign-born population - India (%)
Place of birth for the foreign-born population - Iran (%)
Place of birth for the foreign-born population - Kazakhstan (%)
Place of birth for the foreign-born population - Nepal (%)
Place of birth for the foreign-born population - Pakistan (%)
Place of birth for the foreign-born population - Sri Lanka (%)
Place of birth for the foreign-born population - Uzbekistan (%)
Place of birth for the foreign-born population - Other South Central Asia (%)
Place of birth for the foreign-born population - Burma (%)
Place of birth for the foreign-born population - Cambodia (%)
Place of birth for the foreign-born population - Indonesia (%)
Place of birth for the foreign-born population - Laos (%)
Place of birth for the foreign-born population - Malaysia (%)
Place of birth for the foreign-born population - Philippines (%)
Place of birth for the foreign-born population - Singapore (%)
Place of birth for the foreign-born population - Thailand (%)
Place of birth for the foreign-born population - Vietnam (%)
Place of birth for the foreign-born population - Other South Eastern Asia (%)
Place of birth for the foreign-born population - Armenia (%)
Place of birth for the foreign-born population - Iraq (%)
Place of birth for the foreign-born population - Israel (%)
Place of birth for the foreign-born population - Jordan (%)
Place of birth for the foreign-born population - Kuwait (%)
Place of birth for the foreign-born population - Lebanon (%)
Place of birth for the foreign-born population - Saudi Arabia (%)
Place of birth for the foreign-born population - Syria (%)
Place of birth for the foreign-born population - Turkey (%)
Place of birth for the foreign-born population - Yemen (%)
Place of birth for the foreign-born population - Other Western Asia (%)
Place of birth for the foreign-born population - Eritrea (%)
Place of birth for the foreign-born population - Ethiopia (%)
Place of birth for the foreign-born population - Kenya (%)
Place of birth for the foreign-born population - Somalia (%)
Place of birth for the foreign-born population - Uganda (%)
Place of birth for the foreign-born population - Zimbabwe (%)
Place of birth for the foreign-born population - Other Eastern Africa (%)
Place of birth for the foreign-born population - Cameroon (%)
Place of birth for the foreign-born population - Congo (%)
Place of birth for the foreign-born population - Democratic Republic of Congo (Zaire) (%)
Place of birth for the foreign-born population - Other Middle Africa (%)
Place of birth for the foreign-born population - Egypt (%)
Place of birth for the foreign-born population - Morocco (%)
Place of birth for the foreign-born population - Sudan (%)
Place of birth for the foreign-born population - Other Northern Africa (%)
Place of birth for the foreign-born population - South Africa (%)
Place of birth for the foreign-born population - Other Southern Africa (%)
Place of birth for the foreign-born population - Cabo Verde (%)
Place of birth for the foreign-born population - Ghana (%)
Place of birth for the foreign-born population - Liberia (%)
Place of birth for the foreign-born population - Nigeria (%)
Place of birth for the foreign-born population - Senegal (%)
Place of birth for the foreign-born population - Sierra Leone (%)
Place of birth for the foreign-born population - Other Western Africa (%)
Place of birth for the foreign-born population - Australia (%)
Place of birth for the foreign-born population - New Zealand (%)
Place of birth for the foreign-born population - Fiji (%)
Place of birth for the foreign-born population - Micronesia (%)
Place of birth for the foreign-born population - Bahamas (%)
Place of birth for the foreign-born population - Barbados (%)
Place of birth for the foreign-born population - Cuba (%)
Place of birth for the foreign-born population - Dominica (%)
Place of birth for the foreign-born population - Dominican Republic (%)
Place of birth for the foreign-born population - Grenada (%)
Place of birth for the foreign-born population - Haiti (%)
Place of birth for the foreign-born population - Jamaica (%)
Place of birth for the foreign-born population - St. Vincent and the Grenadines (%)
Place of birth for the foreign-born population - Trinidad and Tobago (%)
Place of birth for the foreign-born population - West Indies (%)
Place of birth for the foreign-born population - Other Caribbean (%)
Place of birth for the foreign-born population - Belize (%)
Place of birth for the foreign-born population - Costa Rica (%)
Place of birth for the foreign-born population - El Salvador (%)
Place of birth for the foreign-born population - Guatemala (%)
Place of birth for the foreign-born population - Honduras (%)
Place of birth for the foreign-born population - Mexico (%)
Place of birth for the foreign-born population - Nicaragua (%)
Place of birth for the foreign-born population - Panama (%)
Place of birth for the foreign-born population - Other Central America (%)
Place of birth for the foreign-born population - Argentina (%)
Place of birth for the foreign-born population - Bolivia (%)
Place of birth for the foreign-born population - Brazil (%)
Place of birth for the foreign-born population - Chile (%)
Place of birth for the foreign-born population - Colombia (%)
Place of birth for the foreign-born population - Ecuador (%)
Place of birth for the foreign-born population - Guyana (%)
Place of birth for the foreign-born population - Peru (%)
Place of birth for the foreign-born population - Uruguay (%)
Place of birth for the foreign-born population - Venezuela (%)
Place of birth for the foreign-born population - Other South America (%)
Place of birth for the foreign-born population - Canada (%)
Place of birth for the foreign-born population - Other Northern America (%)
Place of birth for the foreign-born population - Other (%)
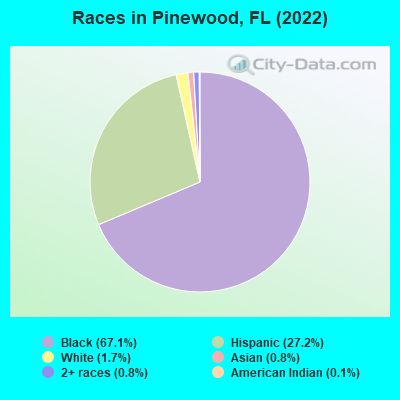
According to 2022 data, the most numerous races in Pinewood, FL are White alone (283 residents), Hispanic (4,641 residents), and Black alone (11,447 residents). 34.2% of Pinewood residents speak English at home. 48.3% of Pinewood, FL residents are foreign-born (46.3% born in Latin America), which is 56.5% greater than the foreign-born rate of 21.0% across the entire state of Florida.
Race distribution in Pinewood
2000 2022
10,458,509 65.4% White alone 2,682,715 16.8% Hispanic 2,264,268 14.2% Black alone 261,693 1.6% Asian alone 236,954 1.5% Two or more races 42,358 0.3% American Indian alone 28,994 0.2% Other race alone 6,887 0.04% Native Hawaiian and Other
11,309,403 50.8% White alone 6,025,039 27.1% Hispanic 3,241,015 14.6% Black alone 861,630 3.9% Two or more races 623,692 2.8% Asian alone 152,054 0.7% Other race alone 22,504 0.1% American Indian alone 9,486 0.04% Native Hawaiian and Other
Income and house value in Pinewood Median household income in 2022 $46,304 Black householders$25,607 Two or more races householders$34,770 Hispanic or Latino race householdersMedian 2022 house value $320,372 White Non-Hispanic householders$338,913 Black or African American householders $409,628 Asian householders$323,390 Some other race householders$388,068 Two or more races householders$303,556 Hispanic or Latino householders
Median age by race in Pinewood
48.7 Median age for White residents54.5 39.1 39.2 Median age for Black or African American residents34.7 41.2 -653,446,647.1 Median age for American Indian / Alaska Native residents-543,352,600.6 -762,696,213.5 30.8 Median age for Asian residents32.0 29.8 -679,849,340.2 Median age for Native Hawaiian / Pacific Islander residents-858,307,848.3 -443,298,968.6 42.5 Median age for Other race residents42.6 42.1 43.0 Median age for Two or more races residents38.0 46.1 20.5 Median age for White alone residents39.4 6.3 46.4 Median age for Hispanic or Latino residents46.8 45.0
Owner/renter occupied households by race in Pinewood
House owners and renters - White residents 150 47.2% Owner occupied168 52.8% Renter occupiedHouse owners and renters - Black or African American residents 881 22.9% Owner occupied2,968 77.1% Renter occupiedHouse owners and renters - American Indian / Alaska Native residents 27 100.0% Owner occupiedHouse owners and renters - Asian residents 33 100.0% Owner occupiedHouse owners and renters - Other race residents 266 53.8% Owner occupied228 46.2% Renter occupiedHouse owners and renters - Two or more races residents 288 30.0% Owner occupied671 70.0% Renter occupiedHouse owners and renters - White alone residents 35 38.1% Owner occupied56 61.9% Renter occupiedHouse owners and renters - Hispanic or Latino residents 599 39.0% Owner occupied937 61.0% Renter occupied
Language usage in Pinewood
English speakers - Total 34.2% of residents of Pinewood speak English at home.
27.4% of residents speak Spanish at home 1,862 42.6% Speak English very well2,505 57.4% Speak English less than very well38.5% of residents speak other language at home 3,349 54.5% Speak English very well2,797 45.5% Speak English less than very well
English speakers - Born in the United States 74.3% of residents of Pinewood speak English at home.
18.3% of residents speak Spanish at home 190 94.5% Speak English very well11 5.5% Speak English less than very well7.5% of residents speak other language at home 82 100.0% Speak English very well
English speakers - Native, born elsewhere 25.8% of residents of Pinewood speak English at home.
63.6% of residents speak Spanish at home 73 41.7% Speak English very well102 58.3% Speak English less than very well11.6% of residents speak other language at home 32 100.0% Speak English very well
English speakers - Foreign-born 4.4% of residents of Pinewood speak English at home.
35.5% of residents speak Spanish at home 635 22.0% Speak English very well2,245 78.0% Speak English less than very well58.8% of residents speak other language at home 2,142 44.9% Speak English very well2,625 55.1% Speak English less than very well
White (Caucasian) - Speak only English Native:
26.3% (95)Foreign-born:
5.2% (20)
White (Caucasian) - Speak another language Native:
63.7% (232)Foreign-born:
93.2% (349)
Black or African American - Speak only English Native:
77.3% (4,557)Foreign-born:
5.8% (272)
Black or African American - Speak another language Native:
22.7% (1,337)Foreign-born:
91.9% (4,339)
Other race - Speak another language Native:
92.5% (827)Foreign-born:
100.0% (1,359)
Two or more races - Speak only English Native:
16.5% (107)Foreign-born:
4.2% (69)
Two or more races - Speak another language Native:
83.6% (544)Foreign-born:
95.8% (1,582)
White alone - Speak another language Native:
43.2% (69)Foreign-born:
93.5% (46)
Hispanic or Latino - Speak only English Native:
14.5% (224)Foreign-born:
2.9% (83)
Hispanic or Latino - Speak another language Native:
85.4% (1,321)Foreign-born:
97.1% (2,828)
Foreign-born residents in Pinewood 8,248 residents are foreign born (46.3% Latin America ).
This city:
48.3%Florida:
21.1%
Marital status for residents in Pinewood Marital status - White (Caucasian) population 15 years and over
Males 33.3% Never married38.6% Now married5.7% Separated3.8% Widowed18.6% DivorcedFemales 20.7% Never married57.4% Now married0.0% Separated1.1% Widowed20.9% DivorcedWomen who did not give birth in the past 12 months Now married:
65.5% (60)Unmarried:
34.5% (32)
Marital status - Black or African American population 15 years and over
Males 47.7% Never married42.3% Now married0.3% Separated0.3% Widowed9.4% DivorcedFemales 40.7% Never married32.1% Now married4.5% Separated9.5% Widowed13.2% DivorcedWomen who gave birth in the past 12 months Now married:
58.6% (114)Unmarried:
41.4% (81)
Women who did not give birth in the past 12 months Now married:
33.8% (899)Unmarried:
66.2% (1,757)
Marital status - Asian population 15 years and over
Males 0.0% Never married53.4% Now married0.0% Separated0.0% Widowed46.6% DivorcedFemales 14.6% Never married85.4% Now married0.0% Separated0.0% Widowed0.0% DivorcedWomen who gave birth in the past 12 months Now married:
100.0% (23)Unmarried:
0.0% (0)
Women who did not give birth in the past 12 months Now married:
73.1% (20)Unmarried:
26.9% (7)
Marital status - Other race population 15 years and over
Males 76.4% Never married21.6% Now married0.0% Separated0.0% Widowed2.0% DivorcedFemales 46.1% Never married27.6% Now married3.8% Separated14.8% Widowed7.7% DivorcedWomen who gave birth in the past 12 months Now married:
0.0% (0)Unmarried:
100.0% (33)
Women who did not give birth in the past 12 months Now married:
43.6% (273)Unmarried:
56.4% (354)
Marital status - Two or more races population 15 years and over
Males 43.9% Never married42.8% Now married0.0% Separated2.7% Widowed10.5% DivorcedFemales 26.1% Never married25.0% Now married5.6% Separated17.3% Widowed26.1% DivorcedWomen who gave birth in the past 12 months Now married:
100.0% (65)Unmarried:
0.0% (0)
Women who did not give birth in the past 12 months Now married:
30.7% (134)Unmarried:
69.3% (303)
Marital status - White alone, not Hispanic / Latino population 15 years and over
Males 44.3% Never married2.1% Now married30.9% Separated0.0% Widowed22.7% DivorcedFemales 35.6% Never married15.3% Now married0.0% Separated6.8% Widowed42.4% DivorcedWomen who did not give birth in the past 12 months Now married:
56.2% (9)Unmarried:
43.8% (7)
Marital status - Hispanic or Latino population 15 years and over
Males 49.9% Never married34.8% Now married0.7% Separated2.2% Widowed12.4% DivorcedFemales 33.2% Never married34.3% Now married4.1% Separated11.2% Widowed17.2% DivorcedWomen who gave birth in the past 12 months Now married:
63.1% (40)Unmarried:
36.9% (23)
Women who did not give birth in the past 12 months Now married:
40.7% (368)Unmarried:
59.3% (535)
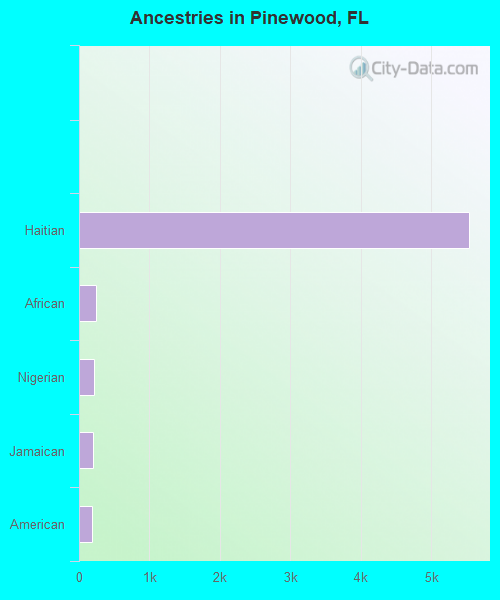
Ancestries in Pinewood
5,545 43.3% Haitian246 1.9% African209 1.6% Nigerian201 1.6% Jamaican178 1.4% American39 0.3% Russian38 0.3% Italian32 0.2% Bahamian28 0.2% Guyanese16 0.1% French13 0.1% English6 0.05% Scottish2 0.02% Iranian
Children Nativity (place of birth) in Pinewood
Children under 6 years - Living with two parents Both parents native 145 100.0% NativeBoth parents foreign-born 247 76.4% Native76 23.6% Foreign-bornOne native, one foreign-born parent 96 100.0% NativeChildren under 6 years - Living with one parent Native parent 357 99.1% Native3 0.9% Foreign-bornForeign-born parent 199 73.4% Native72 26.6% Foreign-bornChildren 6 to 17 years - Living with two parents Both parents native 120 96.5% Native4 3.5% Foreign-bornBoth parents foreign-born 452 71.1% Native184 28.9% Foreign-bornOne native, one foreign-born parent 6 100.0% NativeChildren 6 to 17 years - Living with one parent Native parent 327 100.0% NativeForeign-born parent 856 57.8% Native626 42.2% Foreign-born
Grandparents responsible for own grandchildren in Pinewood
Grandparents (30 to 59 years) White / Caucasian 4 100.0% Not responsible for grandchildrenBlack or African American 34 69.9% Responsible for grandchildren15 30.1% Not responsible for grandchildrenOther race 22 100.0% Not responsible for grandchildrenTwo or more races 72 100.0% Responsible for grandchildrenHispanic or Latino 38 64.1% Responsible for grandchildren21 35.9% Not responsible for grandchildrenGrandparents (60 years and over) White / Caucasian 9 100.0% Not responsible for grandchildrenBlack or African American 92 36.6% Responsible for grandchildren159 63.4% Not responsible for grandchildrenOther race 19 68.4% Responsible for grandchildren9 31.6% Not responsible for grandchildrenTwo or more races 47 100.0% Not responsible for grandchildrenHispanic or Latino 22 25.6% Responsible for grandchildren65 74.4% Not responsible for grandchildren