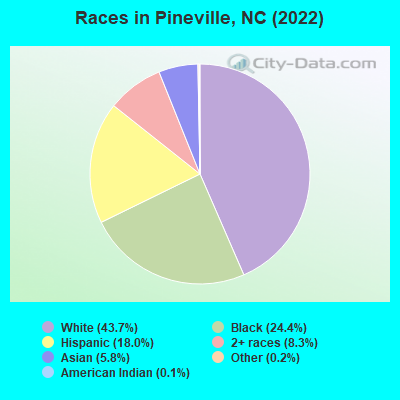
Races in Pineville, North Carolina (NC) Detailed Stats
Data:
Races - White alone (%)
Races - White alone (% change since 2000)
Races - Black alone (%)
Races - Black alone (% change since 2000)
Races - American Indian alone (%)
Races - American Indian alone (% change since 2000)
Races - Asian alone (%)
Races - Asian alone (% change since 2000)
Races - Hispanic (%)
Races - Hispanic (% change since 2000)
Races - Native Hawaiian and Other Pacific Islander alone (%)
Races - Native Hawaiian and Other Pacific Islander alone (% change since 2000)
Races - Two or more races(%)
Races - Two or more races(% change since 2000)
Races - Other race alone (%)
Races - Other race alone (% change since 2000)
Racial diversity
Place of birth - Born in state of residence (%)
Place of birth - Born in state of residence (%) - White
Place of birth - Born in state of residence (%) - Black or African American
Place of birth - Born in state of residence (%) - Asian
Place of birth - Born in state of residence (%) - Hispanic or Latino
Place of birth - Born in state of residence (%) - American Indian and Alaska Native
Place of birth - Born in state of residence (%) - Multirace
Place of birth - Born in state of residence (%) - Other Race
Place of birth - Born in other state (%)
Place of birth - Born in other state (%) - White
Place of birth - Born in other state (%) - Black or African American
Place of birth - Born in other state (%) - Asian
Place of birth - Born in other state (%) - Hispanic or Latino
Place of birth - Born in other state (%) - American Indian and Alaska Native
Place of birth - Born in other state (%) - Multirace
Place of birth - Born in other state (%) - Other Race
Place of birth - Native, outside of US (%)
Place of birth - Native, outside of US (%) - White
Place of birth - Native, outside of US (%) - Black or African American
Place of birth - Native, outside of US (%) - Asian
Place of birth - Native, outside of US (%) - Hispanic or Latino
Place of birth - Native, outside of US (%) - American Indian and Alaska Native
Place of birth - Native, outside of US (%) - Multirace
Place of birth - Native, outside of US (%) - Other Race
Place of birth - Foreign born (%)
Place of birth - Foreign born (%) - White
Place of birth - Foreign born (%) - Black or African American
Place of birth - Foreign born (%) - Asian
Place of birth - Foreign born (%) - Hispanic or Latino
Place of birth - Foreign born (%) - American Indian and Alaska Native
Place of birth - Foreign born (%) - Multirace
Place of birth - Foreign born (%) - Other Race
Residents speaking English at home (%)
Residents speaking English at home - Born in the United States (%)
Residents speaking English at home - Native, born elsewhere (%)
Residents speaking English at home - Foreign born (%)
Residents speaking Spanish at home (%)
Residents speaking Spanish at home - Born in the United States (%)
Residents speaking Spanish at home - Native, born elsewhere (%)
Residents speaking Spanish at home - Foreign born (%)
Residents speaking other language at home (%)
Residents speaking other language at home - Born in the United States (%)
Residents speaking other language at home - Native, born elsewhere (%)
Residents speaking other language at home - Foreign born (%)
Marital status - Never married (%)
Marital status - Now married (%)
Marital status - Separated (%)
Marital status - Widowed (%)
Marital status - Divorced (%)
Ancestries Reported - Arab (%)
Ancestries Reported - Czech (%)
Ancestries Reported - Danish (%)
Ancestries Reported - Dutch (%)
Ancestries Reported - English (%)
Ancestries Reported - French (%)
Ancestries Reported - French Canadian (%)
Ancestries Reported - German (%)
Ancestries Reported - Greek (%)
Ancestries Reported - Hungarian (%)
Ancestries Reported - Irish (%)
Ancestries Reported - Italian (%)
Ancestries Reported - Lithuanian (%)
Ancestries Reported - Norwegian (%)
Ancestries Reported - Polish (%)
Ancestries Reported - Portuguese (%)
Ancestries Reported - Russian (%)
Ancestries Reported - Scotch-Irish (%)
Ancestries Reported - Scottish (%)
Ancestries Reported - Slovak (%)
Ancestries Reported - Subsaharan African (%)
Ancestries Reported - Swedish (%)
Ancestries Reported - Swiss (%)
Ancestries Reported - Ukrainian (%)
Ancestries Reported - United States (%)
Ancestries Reported - Welsh (%)
Ancestries Reported - West Indian (%)
Ancestries Reported - Other (%)
Geographical mobility - Same house 1 year ago (%)
Geographical mobility - Same house 1 year ago (%) - White
Geographical mobility - Same house 1 year ago (%) - Black or African American
Geographical mobility - Same house 1 year ago (%) - Asian
Geographical mobility - Same house 1 year ago (%) - Hispanic or Latino
Geographical mobility - Same house 1 year ago (%) - American Indian and Alaska Native
Geographical mobility - Same house 1 year ago (%) - Multirace
Geographical mobility - Same house 1 year ago (%) - Other Race
Geographical mobility - Moved within same county (%)
Geographical mobility - Moved within same county (%) - White
Geographical mobility - Moved within same county (%) - Black or African American
Geographical mobility - Moved within same county (%) - Asian
Geographical mobility - Moved within same county (%) - Hispanic or Latino
Geographical mobility - Moved within same county (%) - American Indian and Alaska Native
Geographical mobility - Moved within same county (%) - Multirace
Geographical mobility - Moved within same county (%) - Other Race
Geographical mobility - Moved from different county within same state (%)
Geographical mobility - Moved from different county within same state (%) - White
Geographical mobility - Moved from different county within same state (%) - Black or African American
Geographical mobility - Moved from different county within same state (%) - Asian
Geographical mobility - Moved from different county within same state (%) - Hispanic or Latino
Geographical mobility - Moved from different county within same state (%) - American Indian and Alaska Native
Geographical mobility - Moved from different county within same state (%) - Multirace
Geographical mobility - Moved from different county within same state (%) - Other Race
Geographical mobility - Moved from different state (%)
Geographical mobility - Moved from different state (%) - White
Geographical mobility - Moved from different state (%) - Black or African American
Geographical mobility - Moved from different state (%) - Asian
Geographical mobility - Moved from different state (%) - Hispanic or Latino
Geographical mobility - Moved from different state (%) - American Indian and Alaska Native
Geographical mobility - Moved from different state (%) - Multirace
Geographical mobility - Moved from different state (%) - Other Race
Geographical mobility - Moved from abroad (%)
Geographical mobility - Moved from abroad (%) - White
Geographical mobility - Moved from abroad (%) - Black or African American
Geographical mobility - Moved from abroad (%) - Asian
Geographical mobility - Moved from abroad (%) - Hispanic or Latino
Geographical mobility - Moved from abroad (%) - American Indian and Alaska Native
Geographical mobility - Moved from abroad (%) - Multirace
Geographical mobility - Moved from abroad (%) - Other Race
Place of birth for the foreign-born population - Ireland (%)
Place of birth for the foreign-born population - Denmark (%)
Place of birth for the foreign-born population - Norway (%)
Place of birth for the foreign-born population - Sweden (%)
Place of birth for the foreign-born population - United Kingdom (%)
Place of birth for the foreign-born population - England (%)
Place of birth for the foreign-born population - Scotland (%)
Place of birth for the foreign-born population - Other Northern Europe (%)
Place of birth for the foreign-born population - Austria (%)
Place of birth for the foreign-born population - Belgium (%)
Place of birth for the foreign-born population - France (%)
Place of birth for the foreign-born population - Germany (%)
Place of birth for the foreign-born population - Netherlands (%)
Place of birth for the foreign-born population - Switzerland (%)
Place of birth for the foreign-born population - Other Western Europe (%)
Place of birth for the foreign-born population - Greece (%)
Place of birth for the foreign-born population - Italy (%)
Place of birth for the foreign-born population - Portugal (%)
Place of birth for the foreign-born population - Spain (%)
Place of birth for the foreign-born population - Other Southern Europe (%)
Place of birth for the foreign-born population - Albania (%)
Place of birth for the foreign-born population - Belarus (%)
Place of birth for the foreign-born population - Bosnia and Herzegovina (%)
Place of birth for the foreign-born population - Bulgaria (%)
Place of birth for the foreign-born population - Croatia (%)
Place of birth for the foreign-born population - Czechoslovakia (%)
Place of birth for the foreign-born population - Hungary (%)
Place of birth for the foreign-born population - Latvia (%)
Place of birth for the foreign-born population - Lithuania (%)
Place of birth for the foreign-born population - North Macedonia (Macedonia) (%)
Place of birth for the foreign-born population - Moldova (%)
Place of birth for the foreign-born population - Poland (%)
Place of birth for the foreign-born population - Romania (%)
Place of birth for the foreign-born population - Russia (%)
Place of birth for the foreign-born population - Serbia (%)
Place of birth for the foreign-born population - Ukraine (%)
Place of birth for the foreign-born population - Other Eastern Europe (%)
Place of birth for the foreign-born population - China (%)
Place of birth for the foreign-born population - Hong Kong (%)
Place of birth for the foreign-born population - Taiwan (%)
Place of birth for the foreign-born population - Japan (%)
Place of birth for the foreign-born population - Korea (%)
Place of birth for the foreign-born population - Other Eastern Asia (%)
Place of birth for the foreign-born population - Afghanistan (%)
Place of birth for the foreign-born population - Bangladesh (%)
Place of birth for the foreign-born population - India (%)
Place of birth for the foreign-born population - Iran (%)
Place of birth for the foreign-born population - Kazakhstan (%)
Place of birth for the foreign-born population - Nepal (%)
Place of birth for the foreign-born population - Pakistan (%)
Place of birth for the foreign-born population - Sri Lanka (%)
Place of birth for the foreign-born population - Uzbekistan (%)
Place of birth for the foreign-born population - Other South Central Asia (%)
Place of birth for the foreign-born population - Burma (%)
Place of birth for the foreign-born population - Cambodia (%)
Place of birth for the foreign-born population - Indonesia (%)
Place of birth for the foreign-born population - Laos (%)
Place of birth for the foreign-born population - Malaysia (%)
Place of birth for the foreign-born population - Philippines (%)
Place of birth for the foreign-born population - Singapore (%)
Place of birth for the foreign-born population - Thailand (%)
Place of birth for the foreign-born population - Vietnam (%)
Place of birth for the foreign-born population - Other South Eastern Asia (%)
Place of birth for the foreign-born population - Armenia (%)
Place of birth for the foreign-born population - Iraq (%)
Place of birth for the foreign-born population - Israel (%)
Place of birth for the foreign-born population - Jordan (%)
Place of birth for the foreign-born population - Kuwait (%)
Place of birth for the foreign-born population - Lebanon (%)
Place of birth for the foreign-born population - Saudi Arabia (%)
Place of birth for the foreign-born population - Syria (%)
Place of birth for the foreign-born population - Turkey (%)
Place of birth for the foreign-born population - Yemen (%)
Place of birth for the foreign-born population - Other Western Asia (%)
Place of birth for the foreign-born population - Eritrea (%)
Place of birth for the foreign-born population - Ethiopia (%)
Place of birth for the foreign-born population - Kenya (%)
Place of birth for the foreign-born population - Somalia (%)
Place of birth for the foreign-born population - Uganda (%)
Place of birth for the foreign-born population - Zimbabwe (%)
Place of birth for the foreign-born population - Other Eastern Africa (%)
Place of birth for the foreign-born population - Cameroon (%)
Place of birth for the foreign-born population - Congo (%)
Place of birth for the foreign-born population - Democratic Republic of Congo (Zaire) (%)
Place of birth for the foreign-born population - Other Middle Africa (%)
Place of birth for the foreign-born population - Egypt (%)
Place of birth for the foreign-born population - Morocco (%)
Place of birth for the foreign-born population - Sudan (%)
Place of birth for the foreign-born population - Other Northern Africa (%)
Place of birth for the foreign-born population - South Africa (%)
Place of birth for the foreign-born population - Other Southern Africa (%)
Place of birth for the foreign-born population - Cabo Verde (%)
Place of birth for the foreign-born population - Ghana (%)
Place of birth for the foreign-born population - Liberia (%)
Place of birth for the foreign-born population - Nigeria (%)
Place of birth for the foreign-born population - Senegal (%)
Place of birth for the foreign-born population - Sierra Leone (%)
Place of birth for the foreign-born population - Other Western Africa (%)
Place of birth for the foreign-born population - Australia (%)
Place of birth for the foreign-born population - New Zealand (%)
Place of birth for the foreign-born population - Fiji (%)
Place of birth for the foreign-born population - Micronesia (%)
Place of birth for the foreign-born population - Bahamas (%)
Place of birth for the foreign-born population - Barbados (%)
Place of birth for the foreign-born population - Cuba (%)
Place of birth for the foreign-born population - Dominica (%)
Place of birth for the foreign-born population - Dominican Republic (%)
Place of birth for the foreign-born population - Grenada (%)
Place of birth for the foreign-born population - Haiti (%)
Place of birth for the foreign-born population - Jamaica (%)
Place of birth for the foreign-born population - St. Vincent and the Grenadines (%)
Place of birth for the foreign-born population - Trinidad and Tobago (%)
Place of birth for the foreign-born population - West Indies (%)
Place of birth for the foreign-born population - Other Caribbean (%)
Place of birth for the foreign-born population - Belize (%)
Place of birth for the foreign-born population - Costa Rica (%)
Place of birth for the foreign-born population - El Salvador (%)
Place of birth for the foreign-born population - Guatemala (%)
Place of birth for the foreign-born population - Honduras (%)
Place of birth for the foreign-born population - Mexico (%)
Place of birth for the foreign-born population - Nicaragua (%)
Place of birth for the foreign-born population - Panama (%)
Place of birth for the foreign-born population - Other Central America (%)
Place of birth for the foreign-born population - Argentina (%)
Place of birth for the foreign-born population - Bolivia (%)
Place of birth for the foreign-born population - Brazil (%)
Place of birth for the foreign-born population - Chile (%)
Place of birth for the foreign-born population - Colombia (%)
Place of birth for the foreign-born population - Ecuador (%)
Place of birth for the foreign-born population - Guyana (%)
Place of birth for the foreign-born population - Peru (%)
Place of birth for the foreign-born population - Uruguay (%)
Place of birth for the foreign-born population - Venezuela (%)
Place of birth for the foreign-born population - Other South America (%)
Place of birth for the foreign-born population - Canada (%)
Place of birth for the foreign-born population - Other Northern America (%)
Place of birth for the foreign-born population - Other (%)
According to 2022 data, the most numerous races in Pineville, NC are White alone (4,731 residents), Black alone (2,636 residents), and Hispanic (1,951 residents). 77.6% of Pineville residents speak English at home. 16.0% of Pineville, NC residents are foreign-born (10.0% born in Latin America, 4.3% born in Asia), which is 50.1% greater than the foreign-born rate of 8.0% across the entire state of North Carolina.
Race distribution in Pineville
2000 2022
5,647,155 70.2% White alone 1,723,301 21.4% Black alone 378,963 4.7% Hispanic 112,416 1.4% Asian alone 95,333 1.2% American Indian alone 79,965 1.0% Two or more races 9,015 0.1% Other race alone 3,165 0.04% Native Hawaiian and Other
6,497,519 60.7% White alone 2,155,650 20.1% Black alone 1,114,799 10.4% Hispanic 438,061 4.1% Two or more races 341,052 3.2% Asian alone 91,758 0.9% American Indian alone 50,180 0.5% Other race alone 9,954 0.09% Native Hawaiian and Other
Income and house value in Pineville Median household income in 2022 $56,214 White non-Hispanic householders$54,360 Black householders$77,059 Asian householders$43,734 Some other race householders$52,737 Hispanic or Latino race householdersMedian 2022 house value $377,567 White Non-Hispanic householders$247,898 Some other race householders$247,898 Hispanic or Latino householders
Median age by race in Pineville
41.5 Median age for White residents35.0 48.0 29.8 Median age for Black or African American residents27.0 39.3 -623,853,210.4 Median age for American Indian / Alaska Native residents-596,273,291.3 -775,147,928.2 40.6 Median age for Asian residents38.3 66.4 -865,497,075.2 Median age for Native Hawaiian / Pacific Islander residents-706,616,728.4 -668,458,780.7 23.0 Median age for Other race residents24.6 17.1 16.4 Median age for Two or more races residents17.3 16.5 41.6 Median age for White alone residents35.5 49.1 23.3 Median age for Hispanic or Latino residents22.3 27.7
Owner/renter occupied households by race in Pineville
House owners and renters - White residents 1,338 52.6% Owner occupied1,204 47.4% Renter occupiedHouse owners and renters - Black or African American residents 403 33.2% Owner occupied811 66.8% Renter occupiedHouse owners and renters - American Indian / Alaska Native residents 18 100.0% Renter occupiedHouse owners and renters - Asian residents 152 74.4% Owner occupied52 25.6% Renter occupiedHouse owners and renters - Other race residents 118 49.6% Owner occupied120 50.4% Renter occupiedHouse owners and renters - Two or more races residents 179 37.2% Owner occupied302 62.8% Renter occupiedHouse owners and renters - White alone residents 1,336 53.1% Owner occupied1,180 46.9% Renter occupiedHouse owners and renters - Hispanic or Latino residents 221 42.9% Owner occupied294 57.1% Renter occupied
Language usage in Pineville
English speakers - Total 77.6% of residents of Pineville speak English at home.
16.2% of residents speak Spanish at home 981 61.2% Speak English very well623 38.8% Speak English less than very well5.8% of residents speak other language at home 331 57.5% Speak English very well245 42.5% Speak English less than very well
English speakers - Born in the United States 95.8% of residents of Pineville speak English at home.
2.5% of residents speak Spanish at home 98 74.2% Speak English very well34 25.8% Speak English less than very well1.8% of residents speak other language at home 74 78.7% Speak English very well20 21.3% Speak English less than very well
English speakers - Native, born elsewhere 62.2% of residents of Pineville speak English at home.
18.9% of residents speak Spanish at home 21 100.0% Speak English very well18.9% of residents speak other language at home 21 100.0% Speak English very well
English speakers - Foreign-born 11.0% of residents of Pineville speak English at home.
62.1% of residents speak Spanish at home 445 43.4% Speak English very well581 56.6% Speak English less than very well27.1% of residents speak other language at home 219 49.0% Speak English very well228 51.0% Speak English less than very well
White (Caucasian) - Speak only English Native:
99.1% (4,258)Foreign-born:
22.7% (60)
White (Caucasian) - Speak another language Native:
1.5% (65)Foreign-born:
74.7% (196)
Black or African American - Speak only English Native:
99.1% (2,366)Foreign-born:
82.1% (29)
Black or African American - Speak another language Native:
0.8% (19)Foreign-born:
24.1% (8)
Asian - Speak only English Native:
36.0% (41)Foreign-born:
11.0% (51)
Asian - Speak another language Native:
65.2% (75)Foreign-born:
88.8% (414)
Other race - Speak another language Native:
95.9% (402)Foreign-born:
100.0% (616)
Two or more races - Speak only English Native:
80.1% (908)Foreign-born:
16.4% (45)
Two or more races - Speak another language Native:
19.5% (221)Foreign-born:
83.7% (227)
White alone - Speak only English Native:
98.0% (4,222)Foreign-born:
59.1% (62)
White alone - Speak another language Native:
1.9% (81)Foreign-born:
36.2% (38)
Hispanic or Latino - Speak only English Native:
25.6% (199)Foreign-born:
0.5% (6)
Hispanic or Latino - Speak another language Native:
70.1% (546)Foreign-born:
99.7% (1,026)
Foreign-born residents in Pineville 1,733 residents are foreign born (10.0% Latin America , 4.3% Asia ).
This city:
16.0%North Carolina:
8.3%
Marital status for residents in Pineville Marital status - White (Caucasian) population 15 years and over
Males 30.7% Never married54.8% Now married0.8% Separated2.0% Widowed11.7% DivorcedFemales 20.5% Never married40.4% Now married1.0% Separated15.1% Widowed23.0% DivorcedWomen who gave birth in the past 12 months Now married:
87.3% (138)Unmarried:
12.7% (20)
Women who did not give birth in the past 12 months Now married:
32.8% (378)Unmarried:
67.2% (776)
Marital status - Black or African American population 15 years and over
Males 70.8% Never married21.1% Now married0.0% Separated1.7% Widowed6.4% DivorcedFemales 52.0% Never married11.9% Now married3.9% Separated1.9% Widowed30.3% DivorcedWomen who gave birth in the past 12 months Now married:
100.0% (35)Unmarried:
0.0% (0)
Women who did not give birth in the past 12 months Now married:
10.6% (80)Unmarried:
89.4% (676)
Marital status - Asian population 15 years and over
Males 25.9% Never married59.3% Now married6.5% Separated0.0% Widowed8.4% DivorcedFemales 17.3% Never married52.3% Now married0.0% Separated23.7% Widowed6.8% DivorcedWomen who gave birth in the past 12 months Now married:
100.0% (5)Unmarried:
0.0% (0)
Women who did not give birth in the past 12 months Now married:
50.0% (48)Unmarried:
50.0% (48)
Marital status - Other race population 15 years and over
Males 52.6% Never married44.9% Now married0.0% Separated0.0% Widowed2.6% DivorcedFemales 52.5% Never married34.4% Now married0.2% Separated0.0% Widowed12.9% DivorcedWomen who gave birth in the past 12 months Now married:
100.0% (11)Unmarried:
0.0% (0)
Women who did not give birth in the past 12 months Now married:
25.1% (86)Unmarried:
74.9% (257)
Marital status - Two or more races population 15 years and over
Males 35.3% Never married44.7% Now married20.0% Separated0.0% Widowed0.0% DivorcedFemales 37.2% Never married28.5% Now married8.2% Separated3.8% Widowed22.3% DivorcedWomen who gave birth in the past 12 months Now married:
100.0% (32)Unmarried:
0.0% (0)
Women who did not give birth in the past 12 months Now married:
29.0% (120)Unmarried:
71.0% (292)
Marital status - White alone, not Hispanic / Latino population 15 years and over
Males 30.7% Never married53.2% Now married0.9% Separated2.3% Widowed12.9% DivorcedFemales 20.6% Never married39.3% Now married1.0% Separated15.8% Widowed23.4% DivorcedWomen who gave birth in the past 12 months Now married:
100.0% (146)Unmarried:
0.0% (0)
Women who did not give birth in the past 12 months Now married:
29.9% (349)Unmarried:
70.1% (819)
Marital status - Hispanic or Latino population 15 years and over
Males 44.7% Never married47.3% Now married6.7% Separated0.0% Widowed1.3% DivorcedFemales 38.5% Never married41.3% Now married0.2% Separated2.4% Widowed17.6% DivorcedWomen who gave birth in the past 12 months Now married:
61.8% (36)Unmarried:
38.2% (22)
Women who did not give birth in the past 12 months Now married:
35.5% (163)Unmarried:
64.5% (296)
Ancestries in Pineville
802 13.8% African355 6.1% English256 4.4% American205 3.5% German169 2.9% Irish129 2.2% Italian85 1.5% Norwegian69 1.2% Scotch-Irish51 0.9% Scottish49 0.8% Russian42 0.7% French40 0.7% European32 0.5% British29 0.5% Jamaican26 0.4% Arab25 0.4% Northern European17 0.3% Polish13 0.2% Hungarian12 0.2% Slovak12 0.2% Swedish11 0.2% Portuguese11 0.2% Welsh10 0.2% Greek10 0.2% Pennsylvania German10 0.2% Haitian9 0.2% Australian9 0.2% West Indian5 0.09% Eastern European3 0.05% Canadian
Children Nativity (place of birth) in Pineville
Children under 6 years - Living with two parents Both parents native 481 100.0% NativeBoth parents foreign-born 51 54.6% Native42 45.4% Foreign-bornOne native, one foreign-born parent 106 100.0% NativeChildren under 6 years - Living with one parent Native parent 351 100.0% NativeChildren 6 to 17 years - Living with two parents Both parents native 109 100.0% NativeBoth parents foreign-born 75 42.3% Native103 57.7% Foreign-bornOne native, one foreign-born parent 59 100.0% NativeChildren 6 to 17 years - Living with one parent Native parent 837 100.0% NativeForeign-born parent 223 50.7% Native217 49.3% Foreign-born
Grandparents responsible for own grandchildren in Pineville
Grandparents (30 to 59 years) White / Caucasian 42 90.0% Responsible for grandchildren5 10.0% Not responsible for grandchildrenBlack or African American 8 100.0% Not responsible for grandchildrenWhite alone, not Hispanic / Latino 48 90.4% Responsible for grandchildren5 9.6% Not responsible for grandchildrenGrandparents (60 years and over) White / Caucasian 86 59.4% Responsible for grandchildren59 40.6% Not responsible for grandchildrenWhite alone, not Hispanic / Latino 113 93.3% Responsible for grandchildren8 6.7% Not responsible for grandchildren