Races in Pine Hill, New Jersey (NJ) Detailed Stats
Data:
Races - White alone (%)
Races - White alone (% change since 2000)
Races - Black alone (%)
Races - Black alone (% change since 2000)
Races - American Indian alone (%)
Races - American Indian alone (% change since 2000)
Races - Asian alone (%)
Races - Asian alone (% change since 2000)
Races - Hispanic (%)
Races - Hispanic (% change since 2000)
Races - Native Hawaiian and Other Pacific Islander alone (%)
Races - Native Hawaiian and Other Pacific Islander alone (% change since 2000)
Races - Two or more races(%)
Races - Two or more races(% change since 2000)
Races - Other race alone (%)
Races - Other race alone (% change since 2000)
Racial diversity
Place of birth - Born in state of residence (%)
Place of birth - Born in state of residence (%) - White
Place of birth - Born in state of residence (%) - Black or African American
Place of birth - Born in state of residence (%) - Asian
Place of birth - Born in state of residence (%) - Hispanic or Latino
Place of birth - Born in state of residence (%) - American Indian and Alaska Native
Place of birth - Born in state of residence (%) - Multirace
Place of birth - Born in state of residence (%) - Other Race
Place of birth - Born in other state (%)
Place of birth - Born in other state (%) - White
Place of birth - Born in other state (%) - Black or African American
Place of birth - Born in other state (%) - Asian
Place of birth - Born in other state (%) - Hispanic or Latino
Place of birth - Born in other state (%) - American Indian and Alaska Native
Place of birth - Born in other state (%) - Multirace
Place of birth - Born in other state (%) - Other Race
Place of birth - Native, outside of US (%)
Place of birth - Native, outside of US (%) - White
Place of birth - Native, outside of US (%) - Black or African American
Place of birth - Native, outside of US (%) - Asian
Place of birth - Native, outside of US (%) - Hispanic or Latino
Place of birth - Native, outside of US (%) - American Indian and Alaska Native
Place of birth - Native, outside of US (%) - Multirace
Place of birth - Native, outside of US (%) - Other Race
Place of birth - Foreign born (%)
Place of birth - Foreign born (%) - White
Place of birth - Foreign born (%) - Black or African American
Place of birth - Foreign born (%) - Asian
Place of birth - Foreign born (%) - Hispanic or Latino
Place of birth - Foreign born (%) - American Indian and Alaska Native
Place of birth - Foreign born (%) - Multirace
Place of birth - Foreign born (%) - Other Race
Residents speaking English at home (%)
Residents speaking English at home - Born in the United States (%)
Residents speaking English at home - Native, born elsewhere (%)
Residents speaking English at home - Foreign born (%)
Residents speaking Spanish at home (%)
Residents speaking Spanish at home - Born in the United States (%)
Residents speaking Spanish at home - Native, born elsewhere (%)
Residents speaking Spanish at home - Foreign born (%)
Residents speaking other language at home (%)
Residents speaking other language at home - Born in the United States (%)
Residents speaking other language at home - Native, born elsewhere (%)
Residents speaking other language at home - Foreign born (%)
Marital status - Never married (%)
Marital status - Now married (%)
Marital status - Separated (%)
Marital status - Widowed (%)
Marital status - Divorced (%)
Ancestries Reported - Arab (%)
Ancestries Reported - Czech (%)
Ancestries Reported - Danish (%)
Ancestries Reported - Dutch (%)
Ancestries Reported - English (%)
Ancestries Reported - French (%)
Ancestries Reported - French Canadian (%)
Ancestries Reported - German (%)
Ancestries Reported - Greek (%)
Ancestries Reported - Hungarian (%)
Ancestries Reported - Irish (%)
Ancestries Reported - Italian (%)
Ancestries Reported - Lithuanian (%)
Ancestries Reported - Norwegian (%)
Ancestries Reported - Polish (%)
Ancestries Reported - Portuguese (%)
Ancestries Reported - Russian (%)
Ancestries Reported - Scotch-Irish (%)
Ancestries Reported - Scottish (%)
Ancestries Reported - Slovak (%)
Ancestries Reported - Subsaharan African (%)
Ancestries Reported - Swedish (%)
Ancestries Reported - Swiss (%)
Ancestries Reported - Ukrainian (%)
Ancestries Reported - United States (%)
Ancestries Reported - Welsh (%)
Ancestries Reported - West Indian (%)
Ancestries Reported - Other (%)
Geographical mobility - Same house 1 year ago (%)
Geographical mobility - Same house 1 year ago (%) - White
Geographical mobility - Same house 1 year ago (%) - Black or African American
Geographical mobility - Same house 1 year ago (%) - Asian
Geographical mobility - Same house 1 year ago (%) - Hispanic or Latino
Geographical mobility - Same house 1 year ago (%) - American Indian and Alaska Native
Geographical mobility - Same house 1 year ago (%) - Multirace
Geographical mobility - Same house 1 year ago (%) - Other Race
Geographical mobility - Moved within same county (%)
Geographical mobility - Moved within same county (%) - White
Geographical mobility - Moved within same county (%) - Black or African American
Geographical mobility - Moved within same county (%) - Asian
Geographical mobility - Moved within same county (%) - Hispanic or Latino
Geographical mobility - Moved within same county (%) - American Indian and Alaska Native
Geographical mobility - Moved within same county (%) - Multirace
Geographical mobility - Moved within same county (%) - Other Race
Geographical mobility - Moved from different county within same state (%)
Geographical mobility - Moved from different county within same state (%) - White
Geographical mobility - Moved from different county within same state (%) - Black or African American
Geographical mobility - Moved from different county within same state (%) - Asian
Geographical mobility - Moved from different county within same state (%) - Hispanic or Latino
Geographical mobility - Moved from different county within same state (%) - American Indian and Alaska Native
Geographical mobility - Moved from different county within same state (%) - Multirace
Geographical mobility - Moved from different county within same state (%) - Other Race
Geographical mobility - Moved from different state (%)
Geographical mobility - Moved from different state (%) - White
Geographical mobility - Moved from different state (%) - Black or African American
Geographical mobility - Moved from different state (%) - Asian
Geographical mobility - Moved from different state (%) - Hispanic or Latino
Geographical mobility - Moved from different state (%) - American Indian and Alaska Native
Geographical mobility - Moved from different state (%) - Multirace
Geographical mobility - Moved from different state (%) - Other Race
Geographical mobility - Moved from abroad (%)
Geographical mobility - Moved from abroad (%) - White
Geographical mobility - Moved from abroad (%) - Black or African American
Geographical mobility - Moved from abroad (%) - Asian
Geographical mobility - Moved from abroad (%) - Hispanic or Latino
Geographical mobility - Moved from abroad (%) - American Indian and Alaska Native
Geographical mobility - Moved from abroad (%) - Multirace
Geographical mobility - Moved from abroad (%) - Other Race
Place of birth for the foreign-born population - Ireland (%)
Place of birth for the foreign-born population - Denmark (%)
Place of birth for the foreign-born population - Norway (%)
Place of birth for the foreign-born population - Sweden (%)
Place of birth for the foreign-born population - United Kingdom (%)
Place of birth for the foreign-born population - England (%)
Place of birth for the foreign-born population - Scotland (%)
Place of birth for the foreign-born population - Other Northern Europe (%)
Place of birth for the foreign-born population - Austria (%)
Place of birth for the foreign-born population - Belgium (%)
Place of birth for the foreign-born population - France (%)
Place of birth for the foreign-born population - Germany (%)
Place of birth for the foreign-born population - Netherlands (%)
Place of birth for the foreign-born population - Switzerland (%)
Place of birth for the foreign-born population - Other Western Europe (%)
Place of birth for the foreign-born population - Greece (%)
Place of birth for the foreign-born population - Italy (%)
Place of birth for the foreign-born population - Portugal (%)
Place of birth for the foreign-born population - Spain (%)
Place of birth for the foreign-born population - Other Southern Europe (%)
Place of birth for the foreign-born population - Albania (%)
Place of birth for the foreign-born population - Belarus (%)
Place of birth for the foreign-born population - Bosnia and Herzegovina (%)
Place of birth for the foreign-born population - Bulgaria (%)
Place of birth for the foreign-born population - Croatia (%)
Place of birth for the foreign-born population - Czechoslovakia (%)
Place of birth for the foreign-born population - Hungary (%)
Place of birth for the foreign-born population - Latvia (%)
Place of birth for the foreign-born population - Lithuania (%)
Place of birth for the foreign-born population - North Macedonia (Macedonia) (%)
Place of birth for the foreign-born population - Moldova (%)
Place of birth for the foreign-born population - Poland (%)
Place of birth for the foreign-born population - Romania (%)
Place of birth for the foreign-born population - Russia (%)
Place of birth for the foreign-born population - Serbia (%)
Place of birth for the foreign-born population - Ukraine (%)
Place of birth for the foreign-born population - Other Eastern Europe (%)
Place of birth for the foreign-born population - China (%)
Place of birth for the foreign-born population - Hong Kong (%)
Place of birth for the foreign-born population - Taiwan (%)
Place of birth for the foreign-born population - Japan (%)
Place of birth for the foreign-born population - Korea (%)
Place of birth for the foreign-born population - Other Eastern Asia (%)
Place of birth for the foreign-born population - Afghanistan (%)
Place of birth for the foreign-born population - Bangladesh (%)
Place of birth for the foreign-born population - India (%)
Place of birth for the foreign-born population - Iran (%)
Place of birth for the foreign-born population - Kazakhstan (%)
Place of birth for the foreign-born population - Nepal (%)
Place of birth for the foreign-born population - Pakistan (%)
Place of birth for the foreign-born population - Sri Lanka (%)
Place of birth for the foreign-born population - Uzbekistan (%)
Place of birth for the foreign-born population - Other South Central Asia (%)
Place of birth for the foreign-born population - Burma (%)
Place of birth for the foreign-born population - Cambodia (%)
Place of birth for the foreign-born population - Indonesia (%)
Place of birth for the foreign-born population - Laos (%)
Place of birth for the foreign-born population - Malaysia (%)
Place of birth for the foreign-born population - Philippines (%)
Place of birth for the foreign-born population - Singapore (%)
Place of birth for the foreign-born population - Thailand (%)
Place of birth for the foreign-born population - Vietnam (%)
Place of birth for the foreign-born population - Other South Eastern Asia (%)
Place of birth for the foreign-born population - Armenia (%)
Place of birth for the foreign-born population - Iraq (%)
Place of birth for the foreign-born population - Israel (%)
Place of birth for the foreign-born population - Jordan (%)
Place of birth for the foreign-born population - Kuwait (%)
Place of birth for the foreign-born population - Lebanon (%)
Place of birth for the foreign-born population - Saudi Arabia (%)
Place of birth for the foreign-born population - Syria (%)
Place of birth for the foreign-born population - Turkey (%)
Place of birth for the foreign-born population - Yemen (%)
Place of birth for the foreign-born population - Other Western Asia (%)
Place of birth for the foreign-born population - Eritrea (%)
Place of birth for the foreign-born population - Ethiopia (%)
Place of birth for the foreign-born population - Kenya (%)
Place of birth for the foreign-born population - Somalia (%)
Place of birth for the foreign-born population - Uganda (%)
Place of birth for the foreign-born population - Zimbabwe (%)
Place of birth for the foreign-born population - Other Eastern Africa (%)
Place of birth for the foreign-born population - Cameroon (%)
Place of birth for the foreign-born population - Congo (%)
Place of birth for the foreign-born population - Democratic Republic of Congo (Zaire) (%)
Place of birth for the foreign-born population - Other Middle Africa (%)
Place of birth for the foreign-born population - Egypt (%)
Place of birth for the foreign-born population - Morocco (%)
Place of birth for the foreign-born population - Sudan (%)
Place of birth for the foreign-born population - Other Northern Africa (%)
Place of birth for the foreign-born population - South Africa (%)
Place of birth for the foreign-born population - Other Southern Africa (%)
Place of birth for the foreign-born population - Cabo Verde (%)
Place of birth for the foreign-born population - Ghana (%)
Place of birth for the foreign-born population - Liberia (%)
Place of birth for the foreign-born population - Nigeria (%)
Place of birth for the foreign-born population - Senegal (%)
Place of birth for the foreign-born population - Sierra Leone (%)
Place of birth for the foreign-born population - Other Western Africa (%)
Place of birth for the foreign-born population - Australia (%)
Place of birth for the foreign-born population - New Zealand (%)
Place of birth for the foreign-born population - Fiji (%)
Place of birth for the foreign-born population - Micronesia (%)
Place of birth for the foreign-born population - Bahamas (%)
Place of birth for the foreign-born population - Barbados (%)
Place of birth for the foreign-born population - Cuba (%)
Place of birth for the foreign-born population - Dominica (%)
Place of birth for the foreign-born population - Dominican Republic (%)
Place of birth for the foreign-born population - Grenada (%)
Place of birth for the foreign-born population - Haiti (%)
Place of birth for the foreign-born population - Jamaica (%)
Place of birth for the foreign-born population - St. Vincent and the Grenadines (%)
Place of birth for the foreign-born population - Trinidad and Tobago (%)
Place of birth for the foreign-born population - West Indies (%)
Place of birth for the foreign-born population - Other Caribbean (%)
Place of birth for the foreign-born population - Belize (%)
Place of birth for the foreign-born population - Costa Rica (%)
Place of birth for the foreign-born population - El Salvador (%)
Place of birth for the foreign-born population - Guatemala (%)
Place of birth for the foreign-born population - Honduras (%)
Place of birth for the foreign-born population - Mexico (%)
Place of birth for the foreign-born population - Nicaragua (%)
Place of birth for the foreign-born population - Panama (%)
Place of birth for the foreign-born population - Other Central America (%)
Place of birth for the foreign-born population - Argentina (%)
Place of birth for the foreign-born population - Bolivia (%)
Place of birth for the foreign-born population - Brazil (%)
Place of birth for the foreign-born population - Chile (%)
Place of birth for the foreign-born population - Colombia (%)
Place of birth for the foreign-born population - Ecuador (%)
Place of birth for the foreign-born population - Guyana (%)
Place of birth for the foreign-born population - Peru (%)
Place of birth for the foreign-born population - Uruguay (%)
Place of birth for the foreign-born population - Venezuela (%)
Place of birth for the foreign-born population - Other South America (%)
Place of birth for the foreign-born population - Canada (%)
Place of birth for the foreign-born population - Other Northern America (%)
Place of birth for the foreign-born population - Other (%)
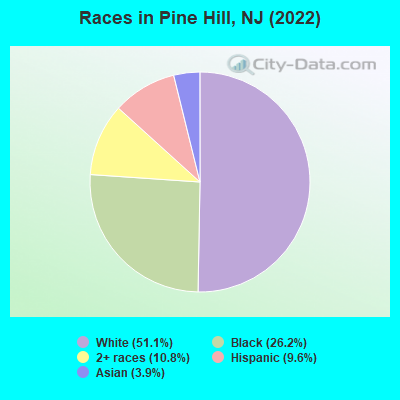
According to 2022 data, the most numerous races in Pine Hill, NJ are White alone (5,488 residents), Hispanic (1,031 residents), and Black alone (2,817 residents). 89.8% of Pine Hill residents speak English at home. 5.1% of Pine Hill, NJ residents are foreign-born (2.4% born in Asia, 2.0% born in Latin America, 0.6% born in Europe), which is 355.2% less than the foreign-born rate of 23.0% across the entire state of New Jersey.
Race distribution in Pine Hill
2000 2022
5,557,209 66.0% White alone 1,117,191 13.3% Hispanic 1,096,171 13.0% Black alone 477,012 5.7% Asian alone 133,689 1.6% Two or more races 19,565 0.2% Other race alone 11,338 0.1% American Indian alone 2,175 0.03% Native Hawaiian and Other
4,766,476 51.5% White alone 2,028,470 21.9% Hispanic 1,111,632 12.0% Black alone 923,546 10.0% Asian alone 332,237 3.6% Two or more races 89,847 1.0% Other race alone 8,557 0.09% American Indian alone 934 0.01% Native Hawaiian and Other
Income and house value in Pine Hill Median household income in 2022 $82,112 White non-Hispanic householders$54,057 Black householders$54,359 Asian householders$68,063 Two or more races householders$68,881 Hispanic or Latino race householdersMedian 2022 house value $194,302 White Non-Hispanic householders$179,589 Black or African American householders$140,642 American Indian or Alaska Native householders $214,208 Asian householders$173,098 Some other race householders$176,992 Two or more races householders$176,992 Hispanic or Latino householders
Median age by race in Pine Hill
44.0 Median age for White residents49.7 42.7 30.2 Median age for Black or African American residents24.3 34.7 -676,272,813.9 Median age for American Indian / Alaska Native residents-670,465,336.5 -688,298,917.7 37.5 Median age for Asian residents27.8 41.7 -701,509,871.5 Median age for Native Hawaiian / Pacific Islander residents-860,335,194.7 -668,881,505.4 27.2 Median age for Other race residents17.5 36.9 20.0 Median age for Two or more races residents19.4 14.2 45.7 Median age for White alone residents49.5 43.9 22.8 Median age for Hispanic or Latino residents22.7 25.4
Owner/renter occupied households by race in Pine Hill
House owners and renters - White residents 2,034 75.0% Owner occupied680 25.0% Renter occupiedHouse owners and renters - Black or African American residents 459 36.1% Owner occupied811 63.9% Renter occupiedHouse owners and renters - Asian residents 90 65.6% Owner occupied47 34.4% Renter occupiedHouse owners and renters - Other race residents 20 30.3% Owner occupied46 69.7% Renter occupiedHouse owners and renters - Two or more races residents 147 52.5% Owner occupied133 47.5% Renter occupiedHouse owners and renters - White alone residents 2,010 75.5% Owner occupied652 24.5% Renter occupiedHouse owners and renters - Hispanic or Latino residents 134 38.4% Owner occupied216 61.6% Renter occupied
Language usage in Pine Hill
English speakers - Total 89.8% of residents of Pine Hill speak English at home.
4.6% of residents speak Spanish at home 330 71.7% Speak English very well130 28.3% Speak English less than very well4.7% of residents speak other language at home 262 56.1% Speak English very well205 43.9% Speak English less than very well
English speakers - Born in the United States 94.2% of residents of Pine Hill speak English at home.
2.8% of residents speak Spanish at home 90 100.0% Speak English very well3.0% of residents speak other language at home 94 100.0% Speak English very well
English speakers - Native, born elsewhere 34.9% of residents of Pine Hill speak English at home.
69.2% of residents speak Spanish at home 96 80.7% Speak English very well23 19.3% Speak English less than very well
English speakers - Foreign-born 9.5% of residents of Pine Hill speak English at home.
27.9% of residents speak Spanish at home 76 49.0% Speak English very well79 51.0% Speak English less than very well57.2% of residents speak other language at home 120 37.7% Speak English very well198 62.3% Speak English less than very well
White (Caucasian) - Speak another language Native:
2.0% (109)Foreign-born:
100.0% (85)
Black or African American - Speak only English Native:
100.0% (2,392)Foreign-born:
84.7% (47)
Black or African American - Speak another language Native:
0.6% (14)Foreign-born:
22.0% (12)
Asian - Speak another language Native:
24.0% (42)Foreign-born:
98.3% (250)
Two or more races - Speak only English Native:
80.3% (1,063)Foreign-born:
6.3% (10)
Two or more races - Speak another language Native:
20.5% (271)Foreign-born:
91.9% (138)
White alone - Speak another language Native:
1.9% (99)Foreign-born:
100.0% (55)
Hispanic or Latino - Speak only English Native:
55.3% (347)Foreign-born:
5.8% (10)
Hispanic or Latino - Speak another language Native:
44.0% (276)Foreign-born:
94.2% (159)
Foreign-born residents in Pine Hill 543 residents are foreign born (2.4% Asia , 2.0% Latin America , 0.6% Europe ).
This city:
5.1%New Jersey:
23.2%
Marital status for residents in Pine Hill Marital status - White (Caucasian) population 15 years and over
Males 33.6% Never married48.0% Now married1.3% Separated2.6% Widowed14.5% DivorcedFemales 38.6% Never married36.9% Now married1.2% Separated9.0% Widowed14.2% DivorcedWomen who gave birth in the past 12 months Now married:
80.4% (42)Unmarried:
19.6% (10)
Women who did not give birth in the past 12 months Now married:
25.9% (371)Unmarried:
74.1% (1,058)
Marital status - Black or African American population 15 years and over
Males 58.4% Never married28.4% Now married1.9% Separated0.0% Widowed11.4% DivorcedFemales 57.2% Never married18.7% Now married7.1% Separated2.5% Widowed14.5% DivorcedWomen who gave birth in the past 12 months Now married:
47.7% (41)Unmarried:
52.3% (44)
Women who did not give birth in the past 12 months Now married:
9.6% (77)Unmarried:
90.4% (726)
Marital status - Asian population 15 years and over
Males 34.2% Never married65.8% Now married0.0% Separated0.0% Widowed0.0% DivorcedFemales 23.7% Never married66.3% Now married0.0% Separated0.0% Widowed10.1% DivorcedWomen who did not give birth in the past 12 months Now married:
67.7% (86)Unmarried:
32.3% (41)
Marital status - Other race population 15 years and over
Males 100.0% Never married0.0% Now married0.0% Separated0.0% Widowed0.0% DivorcedFemales 100.0% Never married0.0% Now married0.0% Separated0.0% Widowed0.0% DivorcedWomen who did not give birth in the past 12 months Now married:
0.0% (0)Unmarried:
100.0% (69)
Marital status - Two or more races population 15 years and over
Males 70.9% Never married24.3% Now married1.7% Separated3.1% Widowed0.0% DivorcedFemales 61.0% Never married24.4% Now married0.0% Separated5.5% Widowed9.1% DivorcedWomen who gave birth in the past 12 months Now married:
0.0% (0)Unmarried:
100.0% (47)
Women who did not give birth in the past 12 months Now married:
18.9% (59)Unmarried:
81.1% (252)
Marital status - White alone, not Hispanic / Latino population 15 years and over
Males 34.1% Never married46.6% Now married1.4% Separated2.8% Widowed15.2% DivorcedFemales 38.7% Never married36.2% Now married1.3% Separated8.8% Widowed14.9% DivorcedWomen who gave birth in the past 12 months Now married:
80.4% (43)Unmarried:
19.6% (11)
Women who did not give birth in the past 12 months Now married:
25.1% (346)Unmarried:
74.9% (1,033)
Marital status - Hispanic or Latino population 15 years and over
Males 53.7% Never married46.3% Now married0.0% Separated0.0% Widowed0.0% DivorcedFemales 56.6% Never married29.9% Now married0.0% Separated6.3% Widowed7.3% DivorcedWomen who gave birth in the past 12 months Now married:
0.0% (0)Unmarried:
100.0% (35)
Women who did not give birth in the past 12 months Now married:
29.0% (62)Unmarried:
71.0% (151)
Ancestries in Pine Hill
463 10.0% Italian443 9.6% American331 7.2% Irish242 5.2% German190 4.1% English167 3.6% Jamaican144 3.1% Polish23 0.5% African21 0.5% Norwegian20 0.4% European20 0.4% Lithuanian19 0.4% Ukrainian17 0.4% Scottish15 0.3% Serbian15 0.3% Haitian14 0.3% Scotch-Irish13 0.3% Hungarian8 0.2% Portuguese7 0.2% Northern European7 0.2% Swedish
Children Nativity (place of birth) in Pine Hill
Children under 6 years - Living with two parents Both parents native 236 100.0% NativeChildren under 6 years - Living with one parent Native parent 612 100.0% Native
Children 6 to 17 years - Living with two parents Both parents native 255 100.0% NativeBoth parents foreign-born 112 100.0% NativeOne native, one foreign-born parent 14 100.0% NativeChildren 6 to 17 years - Living with one parent Native parent 1,071 100.0% Native
Grandparents responsible for own grandchildren in Pine Hill
Grandparents (30 to 59 years) White / Caucasian 22 34.8% Responsible for grandchildren42 65.2% Not responsible for grandchildrenBlack or African American 62 87.4% Responsible for grandchildren9 12.6% Not responsible for grandchildrenWhite alone, not Hispanic / Latino 23 37.1% Responsible for grandchildren40 62.9% Not responsible for grandchildrenGrandparents (60 years and over) White / Caucasian 12 41.1% Responsible for grandchildren17 58.9% Not responsible for grandchildrenBlack or African American 46 50.4% Responsible for grandchildren45 49.6% Not responsible for grandchildrenWhite alone, not Hispanic / Latino 13 38.8% Responsible for grandchildren20 61.2% Not responsible for grandchildren