Races in Philema, Georgia (GA) Detailed Stats
Ancestries, Foreign-born residents, place of birth
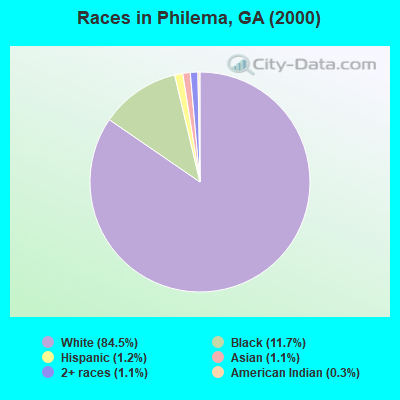
Race distribution in Philema

- 5,49084.5%White alone
- 76311.7%Black alone
- 781.2%Hispanic
- 721.1%Asian alone
- 711.1%Two or more races
- 190.3%American Indian alone
- 20.03%Other race alone
2000
2022
-
- 5,128,66162.6%White alone
- 2,331,46528.5%Black alone
- 435,2275.3%Hispanic
- 171,5132.1%Asian alone
- 87,3641.1%Two or more races
- 17,6700.2%American Indian alone
- 11,2750.1%Other race alone
- 3,2780.04%Native Hawaiian and Other
Pacific Islander alone

-
- 5,415,65749.6%White alone
- 3,349,24030.7%Black alone
- 1,132,60410.4%Hispanic
- 479,1564.4%Asian alone
- 462,9234.2%Two or more races
- 54,4160.5%Other race alone
- 11,9230.1%American Indian alone
- 6,9570.06%Native Hawaiian and Other
Pacific Islander alone

Income and house value in Philema
- Median household income in 2022
- $82,229White non-Hispanic householders
- $77,621Black householders
- $53,267American Indian and Alaska Native householders
- $48,065Asian householders
- $105,911Some other race householders
- $39,489Two or more races householders
- $95,369Hispanic or Latino race householders
- Median 2022 house value
- $245,439White Non-Hispanic householders
- $207,805Black or African American householders
- $177,261American Indian or Alaska Native householders
- $177,261Two or more races householders
- $289,891Hispanic or Latino householders
Household income for White non-Hispanic householders

Household income for Black householders

Household income for American Indian and Alaska Native householders

Household income for Asian householders

Household income for Two or more races householders

Household income for Hispanic or Latino race householders

Zip code: 31763