Races in Philadelphia, Pennsylvania (PA) Detailed Stats
Data:
Races - White alone (%)
Races - White alone (% change since 2000)
Races - Black alone (%)
Races - Black alone (% change since 2000)
Races - American Indian alone (%)
Races - American Indian alone (% change since 2000)
Races - Asian alone (%)
Races - Asian alone (% change since 2000)
Races - Hispanic (%)
Races - Hispanic (% change since 2000)
Races - Native Hawaiian and Other Pacific Islander alone (%)
Races - Native Hawaiian and Other Pacific Islander alone (% change since 2000)
Races - Two or more races(%)
Races - Two or more races(% change since 2000)
Races - Other race alone (%)
Races - Other race alone (% change since 2000)
Racial diversity
Place of birth - Born in state of residence (%)
Place of birth - Born in state of residence (%) - White
Place of birth - Born in state of residence (%) - Black or African American
Place of birth - Born in state of residence (%) - Asian
Place of birth - Born in state of residence (%) - Hispanic or Latino
Place of birth - Born in state of residence (%) - American Indian and Alaska Native
Place of birth - Born in state of residence (%) - Multirace
Place of birth - Born in state of residence (%) - Other Race
Place of birth - Born in other state (%)
Place of birth - Born in other state (%) - White
Place of birth - Born in other state (%) - Black or African American
Place of birth - Born in other state (%) - Asian
Place of birth - Born in other state (%) - Hispanic or Latino
Place of birth - Born in other state (%) - American Indian and Alaska Native
Place of birth - Born in other state (%) - Multirace
Place of birth - Born in other state (%) - Other Race
Place of birth - Native, outside of US (%)
Place of birth - Native, outside of US (%) - White
Place of birth - Native, outside of US (%) - Black or African American
Place of birth - Native, outside of US (%) - Asian
Place of birth - Native, outside of US (%) - Hispanic or Latino
Place of birth - Native, outside of US (%) - American Indian and Alaska Native
Place of birth - Native, outside of US (%) - Multirace
Place of birth - Native, outside of US (%) - Other Race
Place of birth - Foreign born (%)
Place of birth - Foreign born (%) - White
Place of birth - Foreign born (%) - Black or African American
Place of birth - Foreign born (%) - Asian
Place of birth - Foreign born (%) - Hispanic or Latino
Place of birth - Foreign born (%) - American Indian and Alaska Native
Place of birth - Foreign born (%) - Multirace
Place of birth - Foreign born (%) - Other Race
Residents speaking English at home (%)
Residents speaking English at home - Born in the United States (%)
Residents speaking English at home - Native, born elsewhere (%)
Residents speaking English at home - Foreign born (%)
Residents speaking Spanish at home (%)
Residents speaking Spanish at home - Born in the United States (%)
Residents speaking Spanish at home - Native, born elsewhere (%)
Residents speaking Spanish at home - Foreign born (%)
Residents speaking other language at home (%)
Residents speaking other language at home - Born in the United States (%)
Residents speaking other language at home - Native, born elsewhere (%)
Residents speaking other language at home - Foreign born (%)
Marital status - Never married (%)
Marital status - Now married (%)
Marital status - Separated (%)
Marital status - Widowed (%)
Marital status - Divorced (%)
Ancestries Reported - Arab (%)
Ancestries Reported - Czech (%)
Ancestries Reported - Danish (%)
Ancestries Reported - Dutch (%)
Ancestries Reported - English (%)
Ancestries Reported - French (%)
Ancestries Reported - French Canadian (%)
Ancestries Reported - German (%)
Ancestries Reported - Greek (%)
Ancestries Reported - Hungarian (%)
Ancestries Reported - Irish (%)
Ancestries Reported - Italian (%)
Ancestries Reported - Lithuanian (%)
Ancestries Reported - Norwegian (%)
Ancestries Reported - Polish (%)
Ancestries Reported - Portuguese (%)
Ancestries Reported - Russian (%)
Ancestries Reported - Scotch-Irish (%)
Ancestries Reported - Scottish (%)
Ancestries Reported - Slovak (%)
Ancestries Reported - Subsaharan African (%)
Ancestries Reported - Swedish (%)
Ancestries Reported - Swiss (%)
Ancestries Reported - Ukrainian (%)
Ancestries Reported - United States (%)
Ancestries Reported - Welsh (%)
Ancestries Reported - West Indian (%)
Ancestries Reported - Other (%)
Geographical mobility - Same house 1 year ago (%)
Geographical mobility - Same house 1 year ago (%) - White
Geographical mobility - Same house 1 year ago (%) - Black or African American
Geographical mobility - Same house 1 year ago (%) - Asian
Geographical mobility - Same house 1 year ago (%) - Hispanic or Latino
Geographical mobility - Same house 1 year ago (%) - American Indian and Alaska Native
Geographical mobility - Same house 1 year ago (%) - Multirace
Geographical mobility - Same house 1 year ago (%) - Other Race
Geographical mobility - Moved within same county (%)
Geographical mobility - Moved within same county (%) - White
Geographical mobility - Moved within same county (%) - Black or African American
Geographical mobility - Moved within same county (%) - Asian
Geographical mobility - Moved within same county (%) - Hispanic or Latino
Geographical mobility - Moved within same county (%) - American Indian and Alaska Native
Geographical mobility - Moved within same county (%) - Multirace
Geographical mobility - Moved within same county (%) - Other Race
Geographical mobility - Moved from different county within same state (%)
Geographical mobility - Moved from different county within same state (%) - White
Geographical mobility - Moved from different county within same state (%) - Black or African American
Geographical mobility - Moved from different county within same state (%) - Asian
Geographical mobility - Moved from different county within same state (%) - Hispanic or Latino
Geographical mobility - Moved from different county within same state (%) - American Indian and Alaska Native
Geographical mobility - Moved from different county within same state (%) - Multirace
Geographical mobility - Moved from different county within same state (%) - Other Race
Geographical mobility - Moved from different state (%)
Geographical mobility - Moved from different state (%) - White
Geographical mobility - Moved from different state (%) - Black or African American
Geographical mobility - Moved from different state (%) - Asian
Geographical mobility - Moved from different state (%) - Hispanic or Latino
Geographical mobility - Moved from different state (%) - American Indian and Alaska Native
Geographical mobility - Moved from different state (%) - Multirace
Geographical mobility - Moved from different state (%) - Other Race
Geographical mobility - Moved from abroad (%)
Geographical mobility - Moved from abroad (%) - White
Geographical mobility - Moved from abroad (%) - Black or African American
Geographical mobility - Moved from abroad (%) - Asian
Geographical mobility - Moved from abroad (%) - Hispanic or Latino
Geographical mobility - Moved from abroad (%) - American Indian and Alaska Native
Geographical mobility - Moved from abroad (%) - Multirace
Geographical mobility - Moved from abroad (%) - Other Race
Place of birth for the foreign-born population - Ireland (%)
Place of birth for the foreign-born population - Denmark (%)
Place of birth for the foreign-born population - Norway (%)
Place of birth for the foreign-born population - Sweden (%)
Place of birth for the foreign-born population - United Kingdom (%)
Place of birth for the foreign-born population - England (%)
Place of birth for the foreign-born population - Scotland (%)
Place of birth for the foreign-born population - Other Northern Europe (%)
Place of birth for the foreign-born population - Austria (%)
Place of birth for the foreign-born population - Belgium (%)
Place of birth for the foreign-born population - France (%)
Place of birth for the foreign-born population - Germany (%)
Place of birth for the foreign-born population - Netherlands (%)
Place of birth for the foreign-born population - Switzerland (%)
Place of birth for the foreign-born population - Other Western Europe (%)
Place of birth for the foreign-born population - Greece (%)
Place of birth for the foreign-born population - Italy (%)
Place of birth for the foreign-born population - Portugal (%)
Place of birth for the foreign-born population - Spain (%)
Place of birth for the foreign-born population - Other Southern Europe (%)
Place of birth for the foreign-born population - Albania (%)
Place of birth for the foreign-born population - Belarus (%)
Place of birth for the foreign-born population - Bosnia and Herzegovina (%)
Place of birth for the foreign-born population - Bulgaria (%)
Place of birth for the foreign-born population - Croatia (%)
Place of birth for the foreign-born population - Czechoslovakia (%)
Place of birth for the foreign-born population - Hungary (%)
Place of birth for the foreign-born population - Latvia (%)
Place of birth for the foreign-born population - Lithuania (%)
Place of birth for the foreign-born population - North Macedonia (Macedonia) (%)
Place of birth for the foreign-born population - Moldova (%)
Place of birth for the foreign-born population - Poland (%)
Place of birth for the foreign-born population - Romania (%)
Place of birth for the foreign-born population - Russia (%)
Place of birth for the foreign-born population - Serbia (%)
Place of birth for the foreign-born population - Ukraine (%)
Place of birth for the foreign-born population - Other Eastern Europe (%)
Place of birth for the foreign-born population - China (%)
Place of birth for the foreign-born population - Hong Kong (%)
Place of birth for the foreign-born population - Taiwan (%)
Place of birth for the foreign-born population - Japan (%)
Place of birth for the foreign-born population - Korea (%)
Place of birth for the foreign-born population - Other Eastern Asia (%)
Place of birth for the foreign-born population - Afghanistan (%)
Place of birth for the foreign-born population - Bangladesh (%)
Place of birth for the foreign-born population - India (%)
Place of birth for the foreign-born population - Iran (%)
Place of birth for the foreign-born population - Kazakhstan (%)
Place of birth for the foreign-born population - Nepal (%)
Place of birth for the foreign-born population - Pakistan (%)
Place of birth for the foreign-born population - Sri Lanka (%)
Place of birth for the foreign-born population - Uzbekistan (%)
Place of birth for the foreign-born population - Other South Central Asia (%)
Place of birth for the foreign-born population - Burma (%)
Place of birth for the foreign-born population - Cambodia (%)
Place of birth for the foreign-born population - Indonesia (%)
Place of birth for the foreign-born population - Laos (%)
Place of birth for the foreign-born population - Malaysia (%)
Place of birth for the foreign-born population - Philippines (%)
Place of birth for the foreign-born population - Singapore (%)
Place of birth for the foreign-born population - Thailand (%)
Place of birth for the foreign-born population - Vietnam (%)
Place of birth for the foreign-born population - Other South Eastern Asia (%)
Place of birth for the foreign-born population - Armenia (%)
Place of birth for the foreign-born population - Iraq (%)
Place of birth for the foreign-born population - Israel (%)
Place of birth for the foreign-born population - Jordan (%)
Place of birth for the foreign-born population - Kuwait (%)
Place of birth for the foreign-born population - Lebanon (%)
Place of birth for the foreign-born population - Saudi Arabia (%)
Place of birth for the foreign-born population - Syria (%)
Place of birth for the foreign-born population - Turkey (%)
Place of birth for the foreign-born population - Yemen (%)
Place of birth for the foreign-born population - Other Western Asia (%)
Place of birth for the foreign-born population - Eritrea (%)
Place of birth for the foreign-born population - Ethiopia (%)
Place of birth for the foreign-born population - Kenya (%)
Place of birth for the foreign-born population - Somalia (%)
Place of birth for the foreign-born population - Uganda (%)
Place of birth for the foreign-born population - Zimbabwe (%)
Place of birth for the foreign-born population - Other Eastern Africa (%)
Place of birth for the foreign-born population - Cameroon (%)
Place of birth for the foreign-born population - Congo (%)
Place of birth for the foreign-born population - Democratic Republic of Congo (Zaire) (%)
Place of birth for the foreign-born population - Other Middle Africa (%)
Place of birth for the foreign-born population - Egypt (%)
Place of birth for the foreign-born population - Morocco (%)
Place of birth for the foreign-born population - Sudan (%)
Place of birth for the foreign-born population - Other Northern Africa (%)
Place of birth for the foreign-born population - South Africa (%)
Place of birth for the foreign-born population - Other Southern Africa (%)
Place of birth for the foreign-born population - Cabo Verde (%)
Place of birth for the foreign-born population - Ghana (%)
Place of birth for the foreign-born population - Liberia (%)
Place of birth for the foreign-born population - Nigeria (%)
Place of birth for the foreign-born population - Senegal (%)
Place of birth for the foreign-born population - Sierra Leone (%)
Place of birth for the foreign-born population - Other Western Africa (%)
Place of birth for the foreign-born population - Australia (%)
Place of birth for the foreign-born population - New Zealand (%)
Place of birth for the foreign-born population - Fiji (%)
Place of birth for the foreign-born population - Micronesia (%)
Place of birth for the foreign-born population - Bahamas (%)
Place of birth for the foreign-born population - Barbados (%)
Place of birth for the foreign-born population - Cuba (%)
Place of birth for the foreign-born population - Dominica (%)
Place of birth for the foreign-born population - Dominican Republic (%)
Place of birth for the foreign-born population - Grenada (%)
Place of birth for the foreign-born population - Haiti (%)
Place of birth for the foreign-born population - Jamaica (%)
Place of birth for the foreign-born population - St. Vincent and the Grenadines (%)
Place of birth for the foreign-born population - Trinidad and Tobago (%)
Place of birth for the foreign-born population - West Indies (%)
Place of birth for the foreign-born population - Other Caribbean (%)
Place of birth for the foreign-born population - Belize (%)
Place of birth for the foreign-born population - Costa Rica (%)
Place of birth for the foreign-born population - El Salvador (%)
Place of birth for the foreign-born population - Guatemala (%)
Place of birth for the foreign-born population - Honduras (%)
Place of birth for the foreign-born population - Mexico (%)
Place of birth for the foreign-born population - Nicaragua (%)
Place of birth for the foreign-born population - Panama (%)
Place of birth for the foreign-born population - Other Central America (%)
Place of birth for the foreign-born population - Argentina (%)
Place of birth for the foreign-born population - Bolivia (%)
Place of birth for the foreign-born population - Brazil (%)
Place of birth for the foreign-born population - Chile (%)
Place of birth for the foreign-born population - Colombia (%)
Place of birth for the foreign-born population - Ecuador (%)
Place of birth for the foreign-born population - Guyana (%)
Place of birth for the foreign-born population - Peru (%)
Place of birth for the foreign-born population - Uruguay (%)
Place of birth for the foreign-born population - Venezuela (%)
Place of birth for the foreign-born population - Other South America (%)
Place of birth for the foreign-born population - Canada (%)
Place of birth for the foreign-born population - Other Northern America (%)
Place of birth for the foreign-born population - Other (%)
Latest news about races in Philadelphia, PA collected exclusively by city-data.com from local newspapers, TV, and radio stations
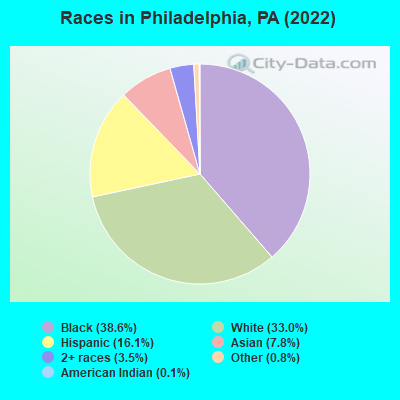
According to 2022 data, the most numerous races in Philadelphia, PA are White alone (516,647 residents), Black alone (605,160 residents), and Hispanic (252,374 residents). 75.1% of Philadelphia residents speak English at home. 15.4% of Philadelphia, PA residents are foreign-born (5.6% born in Asia, 5.1% born in Latin America, 2.1% born in Europe, 1.6% born in Africa), which is 54.6% greater than the foreign-born rate of 7.0% across the entire state of Pennsylvania.
Race distribution in Philadelphia
2000 2022
646,123 42.6% Black alone 644,395 42.5% White alone 128,928 8.5% Hispanic 67,119 4.4% Asian alone 24,726 1.6% Two or more races 2,856 0.2% Other race alone 2,908 0.2% American Indian alone 495 0.03% Native Hawaiian and Other
605,160 38.6% Black alone 516,647 33.0% White alone 252,374 16.1% Hispanic 122,443 7.8% Asian alone 55,158 3.5% Two or more races 13,122 0.8% Other race alone 1,923 0.1% American Indian alone 431 0.03% Native Hawaiian and Other
2000 2022
10,322,455 84.1% White alone 1,202,437 9.8% Black alone 394,088 3.2% Hispanic 218,296 1.8% Asian alone 113,097 0.9% Two or more races 13,086 0.1% Other race alone 14,904 0.1% American Indian alone 2,691 0.02% Native Hawaiian and Other
9,487,228 73.1% White alone 1,311,581 10.1% Black alone 1,115,997 8.6% Hispanic 493,942 3.8% Two or more races 487,124 3.8% Asian alone 63,582 0.5% Other race alone 10,130 0.08% American Indian alone 2,424 0.02% Native Hawaiian and Other
Income and house value in Philadelphia Median household income in 2022 $81,968 White non-Hispanic householders$42,747 Black householders$45,698 American Indian and Alaska Native householders$61,985 Asian householders$75,720 Native Hawaiian and other Pacific Islander householders$34,338 Some other race householders$60,225 Two or more races householders$42,654 Hispanic or Latino race householdersMedian 2022 house value $285,870 White Non-Hispanic householders$176,670 Black or African American householders$211,380 American Indian or Alaska Native householders $231,660 Asian householders$241,800 Native Hawaiian and other Pacific Islander householders$147,810 Some other race householders$207,090 Two or more races householders$157,170 Hispanic or Latino householders
Median age by race in Philadelphia
37.9 Median age for White residents37.7 38.2 35.0 Median age for Black or African American residents32.6 37.5 29.2 Median age for American Indian / Alaska Native residents26.9 30.5 35.4 Median age for Asian residents35.3 35.5 57.9 Median age for Native Hawaiian / Pacific Islander residents-666,666,666.0 63.0 32.3 Median age for Other race residents30.1 35.0 27.7 Median age for Two or more races residents27.2 28.1 38.4 Median age for White alone residents38.0 38.8 28.7 Median age for Hispanic or Latino residents28.1 29.5
Owner/renter occupied households by race in Philadelphia
House owners and renters - White residents 153,547 56.6% Owner occupied117,565 43.4% Renter occupiedHouse owners and renters - Black or African American residents 126,746 45.8% Owner occupied149,741 54.2% Renter occupiedHouse owners and renters - American Indian / Alaska Native residents 807 29.8% Owner occupied1,905 70.2% Renter occupiedHouse owners and renters - Asian residents 26,870 56.0% Owner occupied21,129 44.0% Renter occupiedHouse owners and renters - Native Hawaiian / Pacific Islander residents 94 33.3% Owner occupied188 66.7% Renter occupiedHouse owners and renters - Other race residents 25,006 50.0% Owner occupied24,958 50.0% Renter occupiedHouse owners and renters - Two or more races residents 20,362 43.6% Owner occupied26,358 56.4% Renter occupiedHouse owners and renters - White alone residents 148,451 56.8% Owner occupied112,685 43.2% Renter occupiedHouse owners and renters - Hispanic or Latino residents 40,313 48.2% Owner occupied43,349 51.8% Renter occupied
Language usage in Philadelphia
English speakers - Total 75.1% of residents of Philadelphia speak English at home.
11.6% of residents speak Spanish at home 86,838 50.7% Speak English very well84,338 49.3% Speak English less than very well13.2% of residents speak other language at home 95,286 48.8% Speak English very well99,867 51.2% Speak English less than very well
English speakers - Born in the United States 86.4% of residents of Philadelphia speak English at home.
7.6% of residents speak Spanish at home 15,276 69.2% Speak English very well6,793 30.8% Speak English less than very well6.0% of residents speak other language at home 15,969 91.4% Speak English very well1,508 8.6% Speak English less than very well
English speakers - Native, born elsewhere 30.2% of residents of Philadelphia speak English at home.
60.8% of residents speak Spanish at home 14,779 42.4% Speak English very well20,078 57.6% Speak English less than very well9.0% of residents speak other language at home 3,186 61.5% Speak English very well1,991 38.5% Speak English less than very well
English speakers - Foreign-born 17.5% of residents of Philadelphia speak English at home.
25.0% of residents speak Spanish at home 17,967 29.3% Speak English very well43,291 70.7% Speak English less than very well57.5% of residents speak other language at home 50,346 35.7% Speak English very well90,687 64.3% Speak English less than very well
White (Caucasian) - Speak only English Native:
93.4% (439,075)Foreign-born:
17.3% (8,425)
White (Caucasian) - Speak another language Native:
6.6% (30,820)Foreign-born:
82.7% (40,314)
Black or African American - Speak only English Native:
96.5% (520,428)Foreign-born:
52.5% (21,727)
Black or African American - Speak another language Native:
3.5% (18,773)Foreign-born:
47.5% (19,630)
American Indian / Alaska Native - Speak another language Native:
54.4% (4,282)Foreign-born:
100.0% (1,108)
Asian - Speak only English Native:
41.4% (15,282)Foreign-born:
8.5% (6,937)
Asian - Speak another language Native:
58.6% (21,646)Foreign-born:
91.5% (74,198)
Native Hawaiian / Pacific Islander - Speak another language Native:
33.3% (165)Foreign-born:
100.0% (110)
Other race - Speak only English Native:
31.1% (25,995)Foreign-born:
7.7% (3,355)
Other race - Speak another language Native:
68.9% (57,650)Foreign-born:
92.3% (40,082)
Two or more races - Speak only English Native:
66.1% (60,190)Foreign-born:
8.4% (2,437)
Two or more races - Speak another language Native:
33.9% (30,812)Foreign-born:
91.6% (26,735)
White alone - Speak only English Native:
95.3% (427,846)Foreign-born:
18.2% (8,394)
White alone - Speak another language Native:
4.7% (21,013)Foreign-born:
81.8% (37,690)
Hispanic or Latino - Speak only English Native:
38.6% (63,132)Foreign-born:
5.8% (3,774)
Hispanic or Latino - Speak another language Native:
61.4% (100,211)Foreign-born:
94.2% (61,586)
Foreign-born residents in Philadelphia 241,795 residents are foreign born (5.6% Asia , 5.1% Latin America , 2.1% Europe , 1.6% Africa ).
This city:
15.4%Pennsylvania:
7.3%
Marital status for residents in Philadelphia Marital status - White (Caucasian) population 15 years and over
Males 46.5% Never married41.9% Now married1.6% Separated2.4% Widowed7.6% DivorcedFemales 43.4% Never married37.4% Now married1.6% Separated8.1% Widowed9.5% DivorcedWomen who gave birth in the past 12 months Now married:
77.4% (5,227)Unmarried:
22.6% (1,523)
Women who did not give birth in the past 12 months Now married:
30.5% (42,380)Unmarried:
69.5% (96,462)
Marital status - Black or African American population 15 years and over
Males 59.1% Never married27.1% Now married3.6% Separated2.9% Widowed7.3% DivorcedFemales 57.2% Never married17.4% Now married4.8% Separated8.5% Widowed12.1% DivorcedWomen who gave birth in the past 12 months Now married:
38.2% (2,516)Unmarried:
61.8% (4,062)
Women who did not give birth in the past 12 months Now married:
16.3% (24,911)Unmarried:
83.7% (128,346)
Marital status - American Indian / Alaska Native population 15 years and over
Males 71.8% Never married16.3% Now married1.5% Separated0.0% Widowed10.4% DivorcedFemales 57.9% Never married20.2% Now married0.0% Separated7.6% Widowed14.4% DivorcedWomen who gave birth in the past 12 months Now married:
0.0% (0)Unmarried:
100.0% (64)
Women who did not give birth in the past 12 months Now married:
29.8% (547)Unmarried:
70.2% (1,290)
Marital status - Asian population 15 years and over
Males 39.0% Never married50.7% Now married2.3% Separated2.9% Widowed5.1% DivorcedFemales 37.2% Never married50.7% Now married1.1% Separated5.3% Widowed5.7% DivorcedWomen who gave birth in the past 12 months Now married:
90.8% (2,634)Unmarried:
9.2% (268)
Women who did not give birth in the past 12 months Now married:
41.2% (13,972)Unmarried:
58.8% (19,905)
Marital status - Native Hawaiian / Pacific Islander population 15 years and over
Males 78.4% Never married16.6% Now married0.0% Separated0.0% Widowed5.0% DivorcedFemales 31.9% Never married18.0% Now married30.8% Separated17.0% Widowed2.3% DivorcedWomen who gave birth in the past 12 months Now married:
0.0% (0)Unmarried:
100.0% (24)
Women who did not give birth in the past 12 months Now married:
48.4% (127)Unmarried:
51.6% (136)
Marital status - Other race population 15 years and over
Males 43.7% Never married45.0% Now married3.5% Separated1.9% Widowed5.9% DivorcedFemales 41.2% Never married34.9% Now married5.5% Separated5.1% Widowed13.2% DivorcedWomen who gave birth in the past 12 months Now married:
78.0% (2,088)Unmarried:
22.0% (588)
Women who did not give birth in the past 12 months Now married:
35.2% (12,318)Unmarried:
64.8% (22,710)
Marital status - Two or more races population 15 years and over
Males 57.3% Never married32.8% Now married2.2% Separated0.2% Widowed7.5% DivorcedFemales 49.5% Never married32.2% Now married3.8% Separated4.8% Widowed9.6% DivorcedWomen who gave birth in the past 12 months Now married:
59.3% (1,031)Unmarried:
40.7% (708)
Women who did not give birth in the past 12 months Now married:
31.1% (11,586)Unmarried:
68.9% (25,613)
Marital status - White alone, not Hispanic / Latino population 15 years and over
Males 46.2% Never married42.0% Now married1.5% Separated2.3% Widowed7.9% DivorcedFemales 42.6% Never married37.7% Now married1.6% Separated8.3% Widowed9.8% DivorcedWomen who gave birth in the past 12 months Now married:
88.0% (5,227)Unmarried:
12.0% (711)
Women who did not give birth in the past 12 months Now married:
30.7% (40,642)Unmarried:
69.3% (91,574)
Marital status - Hispanic or Latino population 15 years and over
Males 48.5% Never married40.4% Now married2.9% Separated1.9% Widowed6.2% DivorcedFemales 46.0% Never married34.0% Now married4.8% Separated4.4% Widowed10.7% DivorcedWomen who gave birth in the past 12 months Now married:
57.8% (3,101)Unmarried:
42.2% (2,268)
Women who did not give birth in the past 12 months Now married:
35.7% (22,501)Unmarried:
64.3% (40,545)
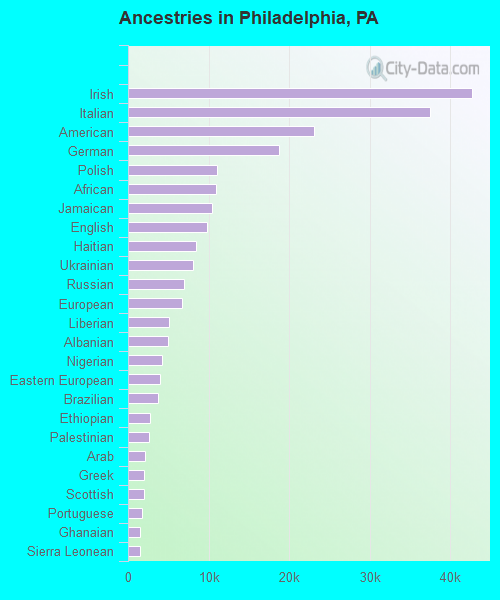
Ancestries in Philadelphia
42,651 4.6% Irish37,421 4.1% Italian23,038 2.5% American18,727 2.0% German11,045 1.2% Polish10,942 1.2% African10,365 1.1% Jamaican9,742 1.1% English8,418 0.9% Haitian8,044 0.9% Ukrainian6,893 0.7% Russian6,749 0.7% European5,088 0.6% Liberian5,020 0.5% Albanian4,193 0.5% Nigerian4,024 0.4% Eastern European3,736 0.4% Brazilian2,708 0.3% Ethiopian2,596 0.3% Palestinian2,096 0.2% Arab2,040 0.2% Greek2,021 0.2% Scottish1,781 0.2% Portuguese1,486 0.2% Ghanaian1,444 0.2% Sierra Leonean1,355 0.1% Moroccan1,331 0.1% Trinidadian and Tobagonian1,287 0.1% West Indian1,274 0.1% Egyptian1,250 0.1% French1,080 0.1% Lithuanian1,018 0.1% Dutch1,015 0.1% Hungarian895 0.10% Turkish856 0.09% Scotch-Irish821 0.09% Armenian722 0.08% Swedish716 0.08% Pennsylvania German680 0.07% Guyanese631 0.07% Slavic628 0.07% Romanian614 0.07% British534 0.06% Iranian525 0.06% Czech496 0.05% Slovak496 0.05% Kenyan453 0.05% Iraqi423 0.05% Norwegian401 0.04% Austrian396 0.04% Danish378 0.04% British West Indian367 0.04% Lebanese359 0.04% Barbadian355 0.04% French Canadian350 0.04% Welsh321 0.03% Finnish316 0.03% Canadian301 0.03% Syrian298 0.03% Afghan285 0.03% Serbian277 0.03% Bulgarian257 0.03% Northern European253 0.03% Israeli252 0.03% Bahamian234 0.03% Australian227 0.02% Croatian225 0.02% Jordanian212 0.02% Swiss175 0.02% Senegalese156 0.02% Czechoslovakian113 0.01% Somali106 0.01% Ugandan104 0.01% Scandinavian92 0.01% South African86 0.01% Estonian77 0.01% Belgian75 0.01% Sudanese62 0.01% Yugoslavian58 0.01% Cape Verdean52 0.01% Belizean52 0.01% Bermudan
Geographical mobility in Philadelphia Same house 1 year ago 447,058 83.3% White (Caucasian)558,641 91.0% Black or African American8,088 93.4% American Indian / Alaska Native99,721 81.8% Asian810 94.5% Native Hawaiian / Pacific Islander120,011 88.6% Other race106,873 82.9% Two or more races427,210 83.5% White alone, not Hispanic / Latino213,020 86.3% Hispanic or LatinoMoved within same county 44,767 8.3% White / Caucasian35,323 5.8% Black or African American453 5.2% American Indian / Alaska Native11,425 9.4% Asian39 4.6% Native Hawaiian / Pacific Islander8,181 6.0% Other race14,924 11.6% Two or more races41,487 8.1% White alone, not Hispanic / Latino23,258 9.4% Hispanic or LatinoMoved within same state 16,706 3.1% White / Caucasian8,215 1.3% Black or African American47 0.5% American Indian / Alaska Native2,275 1.9% Asian478 0.4% Other race1,189 0.9% Two or more races15,923 3.1% White alone, not Hispanic / Latino1,697 0.7% Hispanic or LatinoMoved from different state 23,945 4.5% White / Caucasian10,014 1.6% Black or African American28 0.3% American Indian / Alaska Native5,242 4.3% Asian14 1.6% Native Hawaiian / Pacific Islander2,742 2.0% Other race3,797 2.9% Two or more races22,720 4.4% White alone, not Hispanic / Latino4,968 2.0% Hispanic or LatinoMoved from abroad 4,429 0.8% White1,852 0.3% Black or African American3,317 2.7% Asian4,000 3.0% Other race2,205 1.7% Two or more races4,357 0.9% White alone, not Hispanic / Latino3,804 1.5% Hispanic or Latino
Children Nativity (place of birth) in Philadelphia
Children under 6 years - Living with two parents Both parents native 25,597 100.0% NativeBoth parents foreign-born 14,077 95.8% Native622 4.2% Foreign-bornOne native, one foreign-born parent 7,337 98.0% Native152 2.0% Foreign-bornChildren under 6 years - Living with one parent Native parent 44,843 100.0% NativeForeign-born parent 4,638 88.6% Native596 11.4% Foreign-bornChildren 6 to 17 years - Living with two parents Both parents native 50,172 100.0% NativeBoth parents foreign-born 22,938 74.7% Native7,759 25.3% Foreign-bornOne native, one foreign-born parent 9,307 93.0% Native702 7.0% Foreign-bornChildren 6 to 17 years - Living with one parent Native parent 91,520 100.0% NativeForeign-born parent 14,902 58.7% Native10,499 41.3% Foreign-born
Place of birth for residents in Philadelphia 92,145 Asia86,596 Americas84,180 Latin America47,510 Caribbean35,116 Europe32,552 Eastern Asia28,559 South Eastern Asia27,302 Africa27,278 China23,656 Eastern Europe23,641 South Central Asia19,019 Central America17,650 South America16,359 Western Africa6,882 Western Asia5,049 Southern Europe4,289 Northern Africa3,255 Northern Europe3,100 Western Europe2,491 Eastern Africa2,416 Northern America1,526 Middle Africa634 Oceania574 Australia and New Zealand Subregion351 Southern Africa25,334 China23,703 Dominican Republic12,968 India12,533 Vietnam9,693 Jamaica8,066 Mexico7,142 Haiti6,745 Ukraine5,946 Brazil5,927 Cambodia5,823 Liberia4,861 Albania4,634 Philippines4,606 Korea4,265 Nigeria3,895 Guatemala3,868 Colombia3,180 Russia3,026 Bangladesh2,986 Italy2,902 Trinidad and Tobago2,815 Pakistan2,696 Honduras2,330 Canada2,053 Indonesia2,040 Uzbekistan1,945 Venezuela1,943 Ghana1,920 Germany1,843 Ecuador1,769 Poland1,692 El Salvador1,607 Thailand1,572 Costa Rica1,527 Morocco1,458 Ethiopia1,457 Belarus1,379 Israel1,353 Argentina1,342 Egypt1,166 United Kingdom1,153 Sierra Leone1,117 Cuba1,049 Hong Kong997 Peru923 Guyana895 Taiwan891 Greece878 Algeria874 Cameroon867 England853 Romania821 Turkey801 Dominica783 Portugal776 Georgia734 Saudi Arabia733 Nicaragua639 Iraq639 Jordan612 France612 Ireland604 Ivory Coast574 Burma (Myanmar)566 Malaysia544 Japan506 West Indies464 Nepal456 Laos435 Iran416 Barbados416 Australia397 Kenya389 Spain385 Chile367 Syria366 Afghanistan360 Togo339 Sudan318 Kuwait290 Lebanon276 South Africa265 Zimbabwe263 Azerbaijan261 Bulgaria257 Sri Lanka247 United Arab Emirates245 Panama233 Czechoslovakia223 Serbia221 Switzerland217 Bhutan216 Uruguay208 Moldova206 Lithuania206 Singapore193 Yemen172 St. Lucia168 St. Vincent and the Grenadines168 Netherlands157 New Zealand155 Croatia149 Hungary149 Latvia145 Sweden138 Armenia138 Democratic Republic of Congo (Zaire)135 Kazakhstan127 Senegal127 Bahamas126 Scotland119 Eritrea118 Norway116 Belize112 North Macedonia (Macedonia)112 Austria92 Grenada89 Bosnia and Herzegovina88 Bolivia68 Tanzania65 Belgium39 Congo37 Denmark30 Somalia29 Uganda9 Fiji
Grandparents responsible for own grandchildren in Philadelphia
Grandparents (30 to 59 years) White / Caucasian 418 32.0% Responsible for grandchildren890 68.0% Not responsible for grandchildrenBlack or African American 3,194 44.2% Responsible for grandchildren4,036 55.8% Not responsible for grandchildrenAmerican Indian / Alaska Native 30 71.5% Responsible for grandchildren12 28.5% Not responsible for grandchildrenAsian 408 24.7% Responsible for grandchildren1,241 75.3% Not responsible for grandchildrenNative Hawaiian / Pacific Islander 52 100.0% Not responsible for grandchildrenOther race 312 7.3% Responsible for grandchildren3,936 92.7% Not responsible for grandchildrenTwo or more races 525 38.7% Responsible for grandchildren830 61.3% Not responsible for grandchildrenWhite alone, not Hispanic / Latino 418 32.0% Responsible for grandchildren890 68.0% Not responsible for grandchildrenHispanic or Latino 312 6.2% Responsible for grandchildren4,708 93.8% Not responsible for grandchildrenGrandparents (60 years and over) White / Caucasian 1,249 28.2% Responsible for grandchildren3,180 71.8% Not responsible for grandchildrenBlack or African American 3,052 26.8% Responsible for grandchildren8,356 73.2% Not responsible for grandchildrenAmerican Indian / Alaska Native 53 42.7% Responsible for grandchildren71 57.3% Not responsible for grandchildrenAsian 74 2.2% Responsible for grandchildren3,283 97.8% Not responsible for grandchildrenOther race 180 10.2% Responsible for grandchildren1,585 89.8% Not responsible for grandchildrenTwo or more races 173 16.2% Responsible for grandchildren898 83.8% Not responsible for grandchildrenWhite alone, not Hispanic / Latino 570 15.5% Responsible for grandchildren3,118 84.5% Not responsible for grandchildrenHispanic or Latino 1,311 40.0% Responsible for grandchildren1,964 60.0% Not responsible for grandchildren
Zip codes: 19102 , 19103 , 19104 , 19106 , 19107 , 19109, 19111 , 19112, 19114 , 19115 , 19116 , 19118 , 19119 , 19120 , 19121 , 19122 , 19123 , 19124 , 19125 , 19126 , 19127 , 19128 , 19129 , 19130 , 19131 , 19132 , 19133 , 19134 , 19135 , 19136 , 19137 , 19138 , 19139 , 19140 , 19141 , 19142 , 19143 , 19144 , 19145 , 19146 , 19147 , 19148 , 19149 , 19150 , 19151 , 19152 , 19153 , 19154 .