Races in Peoria, Illinois (IL) Detailed Stats
Data:
Races - White alone (%)
Races - White alone (% change since 2000)
Races - Black alone (%)
Races - Black alone (% change since 2000)
Races - American Indian alone (%)
Races - American Indian alone (% change since 2000)
Races - Asian alone (%)
Races - Asian alone (% change since 2000)
Races - Hispanic (%)
Races - Hispanic (% change since 2000)
Races - Native Hawaiian and Other Pacific Islander alone (%)
Races - Native Hawaiian and Other Pacific Islander alone (% change since 2000)
Races - Two or more races(%)
Races - Two or more races(% change since 2000)
Races - Other race alone (%)
Races - Other race alone (% change since 2000)
Racial diversity
Place of birth - Born in state of residence (%)
Place of birth - Born in state of residence (%) - White
Place of birth - Born in state of residence (%) - Black or African American
Place of birth - Born in state of residence (%) - Asian
Place of birth - Born in state of residence (%) - Hispanic or Latino
Place of birth - Born in state of residence (%) - American Indian and Alaska Native
Place of birth - Born in state of residence (%) - Multirace
Place of birth - Born in state of residence (%) - Other Race
Place of birth - Born in other state (%)
Place of birth - Born in other state (%) - White
Place of birth - Born in other state (%) - Black or African American
Place of birth - Born in other state (%) - Asian
Place of birth - Born in other state (%) - Hispanic or Latino
Place of birth - Born in other state (%) - American Indian and Alaska Native
Place of birth - Born in other state (%) - Multirace
Place of birth - Born in other state (%) - Other Race
Place of birth - Native, outside of US (%)
Place of birth - Native, outside of US (%) - White
Place of birth - Native, outside of US (%) - Black or African American
Place of birth - Native, outside of US (%) - Asian
Place of birth - Native, outside of US (%) - Hispanic or Latino
Place of birth - Native, outside of US (%) - American Indian and Alaska Native
Place of birth - Native, outside of US (%) - Multirace
Place of birth - Native, outside of US (%) - Other Race
Place of birth - Foreign born (%)
Place of birth - Foreign born (%) - White
Place of birth - Foreign born (%) - Black or African American
Place of birth - Foreign born (%) - Asian
Place of birth - Foreign born (%) - Hispanic or Latino
Place of birth - Foreign born (%) - American Indian and Alaska Native
Place of birth - Foreign born (%) - Multirace
Place of birth - Foreign born (%) - Other Race
Residents speaking English at home (%)
Residents speaking English at home - Born in the United States (%)
Residents speaking English at home - Native, born elsewhere (%)
Residents speaking English at home - Foreign born (%)
Residents speaking Spanish at home (%)
Residents speaking Spanish at home - Born in the United States (%)
Residents speaking Spanish at home - Native, born elsewhere (%)
Residents speaking Spanish at home - Foreign born (%)
Residents speaking other language at home (%)
Residents speaking other language at home - Born in the United States (%)
Residents speaking other language at home - Native, born elsewhere (%)
Residents speaking other language at home - Foreign born (%)
Marital status - Never married (%)
Marital status - Now married (%)
Marital status - Separated (%)
Marital status - Widowed (%)
Marital status - Divorced (%)
Ancestries Reported - Arab (%)
Ancestries Reported - Czech (%)
Ancestries Reported - Danish (%)
Ancestries Reported - Dutch (%)
Ancestries Reported - English (%)
Ancestries Reported - French (%)
Ancestries Reported - French Canadian (%)
Ancestries Reported - German (%)
Ancestries Reported - Greek (%)
Ancestries Reported - Hungarian (%)
Ancestries Reported - Irish (%)
Ancestries Reported - Italian (%)
Ancestries Reported - Lithuanian (%)
Ancestries Reported - Norwegian (%)
Ancestries Reported - Polish (%)
Ancestries Reported - Portuguese (%)
Ancestries Reported - Russian (%)
Ancestries Reported - Scotch-Irish (%)
Ancestries Reported - Scottish (%)
Ancestries Reported - Slovak (%)
Ancestries Reported - Subsaharan African (%)
Ancestries Reported - Swedish (%)
Ancestries Reported - Swiss (%)
Ancestries Reported - Ukrainian (%)
Ancestries Reported - United States (%)
Ancestries Reported - Welsh (%)
Ancestries Reported - West Indian (%)
Ancestries Reported - Other (%)
Geographical mobility - Same house 1 year ago (%)
Geographical mobility - Same house 1 year ago (%) - White
Geographical mobility - Same house 1 year ago (%) - Black or African American
Geographical mobility - Same house 1 year ago (%) - Asian
Geographical mobility - Same house 1 year ago (%) - Hispanic or Latino
Geographical mobility - Same house 1 year ago (%) - American Indian and Alaska Native
Geographical mobility - Same house 1 year ago (%) - Multirace
Geographical mobility - Same house 1 year ago (%) - Other Race
Geographical mobility - Moved within same county (%)
Geographical mobility - Moved within same county (%) - White
Geographical mobility - Moved within same county (%) - Black or African American
Geographical mobility - Moved within same county (%) - Asian
Geographical mobility - Moved within same county (%) - Hispanic or Latino
Geographical mobility - Moved within same county (%) - American Indian and Alaska Native
Geographical mobility - Moved within same county (%) - Multirace
Geographical mobility - Moved within same county (%) - Other Race
Geographical mobility - Moved from different county within same state (%)
Geographical mobility - Moved from different county within same state (%) - White
Geographical mobility - Moved from different county within same state (%) - Black or African American
Geographical mobility - Moved from different county within same state (%) - Asian
Geographical mobility - Moved from different county within same state (%) - Hispanic or Latino
Geographical mobility - Moved from different county within same state (%) - American Indian and Alaska Native
Geographical mobility - Moved from different county within same state (%) - Multirace
Geographical mobility - Moved from different county within same state (%) - Other Race
Geographical mobility - Moved from different state (%)
Geographical mobility - Moved from different state (%) - White
Geographical mobility - Moved from different state (%) - Black or African American
Geographical mobility - Moved from different state (%) - Asian
Geographical mobility - Moved from different state (%) - Hispanic or Latino
Geographical mobility - Moved from different state (%) - American Indian and Alaska Native
Geographical mobility - Moved from different state (%) - Multirace
Geographical mobility - Moved from different state (%) - Other Race
Geographical mobility - Moved from abroad (%)
Geographical mobility - Moved from abroad (%) - White
Geographical mobility - Moved from abroad (%) - Black or African American
Geographical mobility - Moved from abroad (%) - Asian
Geographical mobility - Moved from abroad (%) - Hispanic or Latino
Geographical mobility - Moved from abroad (%) - American Indian and Alaska Native
Geographical mobility - Moved from abroad (%) - Multirace
Geographical mobility - Moved from abroad (%) - Other Race
Place of birth for the foreign-born population - Ireland (%)
Place of birth for the foreign-born population - Denmark (%)
Place of birth for the foreign-born population - Norway (%)
Place of birth for the foreign-born population - Sweden (%)
Place of birth for the foreign-born population - United Kingdom (%)
Place of birth for the foreign-born population - England (%)
Place of birth for the foreign-born population - Scotland (%)
Place of birth for the foreign-born population - Other Northern Europe (%)
Place of birth for the foreign-born population - Austria (%)
Place of birth for the foreign-born population - Belgium (%)
Place of birth for the foreign-born population - France (%)
Place of birth for the foreign-born population - Germany (%)
Place of birth for the foreign-born population - Netherlands (%)
Place of birth for the foreign-born population - Switzerland (%)
Place of birth for the foreign-born population - Other Western Europe (%)
Place of birth for the foreign-born population - Greece (%)
Place of birth for the foreign-born population - Italy (%)
Place of birth for the foreign-born population - Portugal (%)
Place of birth for the foreign-born population - Spain (%)
Place of birth for the foreign-born population - Other Southern Europe (%)
Place of birth for the foreign-born population - Albania (%)
Place of birth for the foreign-born population - Belarus (%)
Place of birth for the foreign-born population - Bosnia and Herzegovina (%)
Place of birth for the foreign-born population - Bulgaria (%)
Place of birth for the foreign-born population - Croatia (%)
Place of birth for the foreign-born population - Czechoslovakia (%)
Place of birth for the foreign-born population - Hungary (%)
Place of birth for the foreign-born population - Latvia (%)
Place of birth for the foreign-born population - Lithuania (%)
Place of birth for the foreign-born population - North Macedonia (Macedonia) (%)
Place of birth for the foreign-born population - Moldova (%)
Place of birth for the foreign-born population - Poland (%)
Place of birth for the foreign-born population - Romania (%)
Place of birth for the foreign-born population - Russia (%)
Place of birth for the foreign-born population - Serbia (%)
Place of birth for the foreign-born population - Ukraine (%)
Place of birth for the foreign-born population - Other Eastern Europe (%)
Place of birth for the foreign-born population - China (%)
Place of birth for the foreign-born population - Hong Kong (%)
Place of birth for the foreign-born population - Taiwan (%)
Place of birth for the foreign-born population - Japan (%)
Place of birth for the foreign-born population - Korea (%)
Place of birth for the foreign-born population - Other Eastern Asia (%)
Place of birth for the foreign-born population - Afghanistan (%)
Place of birth for the foreign-born population - Bangladesh (%)
Place of birth for the foreign-born population - India (%)
Place of birth for the foreign-born population - Iran (%)
Place of birth for the foreign-born population - Kazakhstan (%)
Place of birth for the foreign-born population - Nepal (%)
Place of birth for the foreign-born population - Pakistan (%)
Place of birth for the foreign-born population - Sri Lanka (%)
Place of birth for the foreign-born population - Uzbekistan (%)
Place of birth for the foreign-born population - Other South Central Asia (%)
Place of birth for the foreign-born population - Burma (%)
Place of birth for the foreign-born population - Cambodia (%)
Place of birth for the foreign-born population - Indonesia (%)
Place of birth for the foreign-born population - Laos (%)
Place of birth for the foreign-born population - Malaysia (%)
Place of birth for the foreign-born population - Philippines (%)
Place of birth for the foreign-born population - Singapore (%)
Place of birth for the foreign-born population - Thailand (%)
Place of birth for the foreign-born population - Vietnam (%)
Place of birth for the foreign-born population - Other South Eastern Asia (%)
Place of birth for the foreign-born population - Armenia (%)
Place of birth for the foreign-born population - Iraq (%)
Place of birth for the foreign-born population - Israel (%)
Place of birth for the foreign-born population - Jordan (%)
Place of birth for the foreign-born population - Kuwait (%)
Place of birth for the foreign-born population - Lebanon (%)
Place of birth for the foreign-born population - Saudi Arabia (%)
Place of birth for the foreign-born population - Syria (%)
Place of birth for the foreign-born population - Turkey (%)
Place of birth for the foreign-born population - Yemen (%)
Place of birth for the foreign-born population - Other Western Asia (%)
Place of birth for the foreign-born population - Eritrea (%)
Place of birth for the foreign-born population - Ethiopia (%)
Place of birth for the foreign-born population - Kenya (%)
Place of birth for the foreign-born population - Somalia (%)
Place of birth for the foreign-born population - Uganda (%)
Place of birth for the foreign-born population - Zimbabwe (%)
Place of birth for the foreign-born population - Other Eastern Africa (%)
Place of birth for the foreign-born population - Cameroon (%)
Place of birth for the foreign-born population - Congo (%)
Place of birth for the foreign-born population - Democratic Republic of Congo (Zaire) (%)
Place of birth for the foreign-born population - Other Middle Africa (%)
Place of birth for the foreign-born population - Egypt (%)
Place of birth for the foreign-born population - Morocco (%)
Place of birth for the foreign-born population - Sudan (%)
Place of birth for the foreign-born population - Other Northern Africa (%)
Place of birth for the foreign-born population - South Africa (%)
Place of birth for the foreign-born population - Other Southern Africa (%)
Place of birth for the foreign-born population - Cabo Verde (%)
Place of birth for the foreign-born population - Ghana (%)
Place of birth for the foreign-born population - Liberia (%)
Place of birth for the foreign-born population - Nigeria (%)
Place of birth for the foreign-born population - Senegal (%)
Place of birth for the foreign-born population - Sierra Leone (%)
Place of birth for the foreign-born population - Other Western Africa (%)
Place of birth for the foreign-born population - Australia (%)
Place of birth for the foreign-born population - New Zealand (%)
Place of birth for the foreign-born population - Fiji (%)
Place of birth for the foreign-born population - Micronesia (%)
Place of birth for the foreign-born population - Bahamas (%)
Place of birth for the foreign-born population - Barbados (%)
Place of birth for the foreign-born population - Cuba (%)
Place of birth for the foreign-born population - Dominica (%)
Place of birth for the foreign-born population - Dominican Republic (%)
Place of birth for the foreign-born population - Grenada (%)
Place of birth for the foreign-born population - Haiti (%)
Place of birth for the foreign-born population - Jamaica (%)
Place of birth for the foreign-born population - St. Vincent and the Grenadines (%)
Place of birth for the foreign-born population - Trinidad and Tobago (%)
Place of birth for the foreign-born population - West Indies (%)
Place of birth for the foreign-born population - Other Caribbean (%)
Place of birth for the foreign-born population - Belize (%)
Place of birth for the foreign-born population - Costa Rica (%)
Place of birth for the foreign-born population - El Salvador (%)
Place of birth for the foreign-born population - Guatemala (%)
Place of birth for the foreign-born population - Honduras (%)
Place of birth for the foreign-born population - Mexico (%)
Place of birth for the foreign-born population - Nicaragua (%)
Place of birth for the foreign-born population - Panama (%)
Place of birth for the foreign-born population - Other Central America (%)
Place of birth for the foreign-born population - Argentina (%)
Place of birth for the foreign-born population - Bolivia (%)
Place of birth for the foreign-born population - Brazil (%)
Place of birth for the foreign-born population - Chile (%)
Place of birth for the foreign-born population - Colombia (%)
Place of birth for the foreign-born population - Ecuador (%)
Place of birth for the foreign-born population - Guyana (%)
Place of birth for the foreign-born population - Peru (%)
Place of birth for the foreign-born population - Uruguay (%)
Place of birth for the foreign-born population - Venezuela (%)
Place of birth for the foreign-born population - Other South America (%)
Place of birth for the foreign-born population - Canada (%)
Place of birth for the foreign-born population - Other Northern America (%)
Place of birth for the foreign-born population - Other (%)
Latest news about races in Peoria, IL collected exclusively by city-data.com from local newspapers, TV, and radio stations
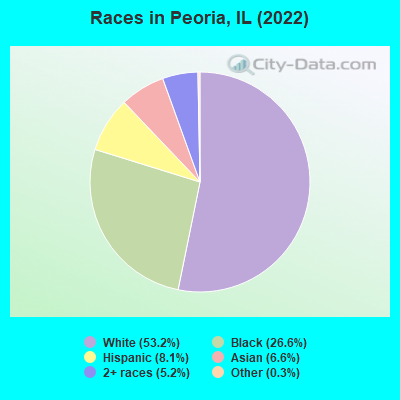
According to 2022 data, the most numerous races in Peoria, IL are White alone (58,056 residents), Hispanic (8,820 residents), and Black alone (29,105 residents). 88.2% of Peoria residents speak English at home. 9.3% of Peoria, IL residents are foreign-born (5.5% born in Asia, 2.1% born in Latin America), which is 51.2% less than the foreign-born rate of 14.0% across the entire state of Illinois.
Race distribution in Peoria
2000 2022
77,138 68.3% White alone 27,783 24.6% Black alone 2,839 2.5% Hispanic 2,603 2.3% Asian alone 2,105 1.9% Two or more races 230 0.2% Other race alone 207 0.2% American Indian alone 31 0.03% Native Hawaiian and Other
58,056 53.2% White alone 29,105 26.6% Black alone 8,820 8.1% Hispanic 7,168 6.6% Asian alone 5,696 5.2% Two or more races 314 0.3% Other race alone 62 0.06% American Indian alone
2000 2022
8,424,140 67.8% White alone 1,856,152 14.9% Black alone 1,530,262 12.3% Hispanic 419,916 3.4% Asian alone 153,996 1.2% Two or more races 13,479 0.1% Other race alone 18,232 0.1% American Indian alone 3,116 0.03% Native Hawaiian and Other
7,356,301 58.5% White alone 2,299,726 18.3% Hispanic 1,660,423 13.2% Black alone 747,296 5.9% Asian alone 458,599 3.6% Two or more races 45,386 0.4% Other race alone 10,405 0.08% American Indian alone 3,896 0.03% Native Hawaiian and Other
Income and house value in Peoria Median household income in 2022 $71,202 White non-Hispanic householders$36,690 Black householders$83,760 Asian householders$42,125 Some other race householders$46,966 Two or more races householders$48,128 Hispanic or Latino race householdersMedian 2022 house value $163,656 White Non-Hispanic householders$96,968 Black or African American householders$107,061 American Indian or Alaska Native householders $245,484 Asian householders$202,767 Native Hawaiian and other Pacific Islander householders$99,671 Some other race householders$114,451 Two or more races householders$124,544 Hispanic or Latino householders
Median age by race in Peoria
41.3 Median age for White residents41.0 41.6 29.5 Median age for Black or African American residents27.4 30.5 61.5 Median age for American Indian / Alaska Native residents67.3 61.2 31.5 Median age for Asian residents32.5 30.2 -666,666,666.0 Median age for Native Hawaiian / Pacific Islander residents-666,666,666.0 -666,666,666.0 21.4 Median age for Other race residents19.6 23.4 19.1 Median age for Two or more races residents17.7 22.0 41.6 Median age for White alone residents41.0 42.2 21.5 Median age for Hispanic or Latino residents18.8 23.6
Owner/renter occupied households by race in Peoria
House owners and renters - White residents 18,964 67.1% Owner occupied9,281 32.9% Renter occupiedHouse owners and renters - Black or African American residents 4,106 32.1% Owner occupied8,685 67.9% Renter occupiedHouse owners and renters - American Indian / Alaska Native residents 153 86.5% Owner occupied24 13.5% Renter occupiedHouse owners and renters - Asian residents 1,403 47.1% Owner occupied1,576 52.9% Renter occupiedHouse owners and renters - Native Hawaiian / Pacific Islander residents 17 100.0% Renter occupiedHouse owners and renters - Other race residents 323 52.4% Owner occupied294 47.6% Renter occupiedHouse owners and renters - Two or more races residents 1,563 58.0% Owner occupied1,131 42.0% Renter occupiedHouse owners and renters - White alone residents 18,727 67.4% Owner occupied9,057 32.6% Renter occupiedHouse owners and renters - Hispanic or Latino residents 1,378 61.7% Owner occupied854 38.3% Renter occupied
Language usage in Peoria
English speakers - Total 88.2% of residents of Peoria speak English at home.
3.7% of residents speak Spanish at home 2,330 61.5% Speak English very well1,456 38.5% Speak English less than very well8.1% of residents speak other language at home 5,110 62.4% Speak English very well3,077 37.6% Speak English less than very well
English speakers - Born in the United States 90.5% of residents of Peoria speak English at home.
5.7% of residents speak Spanish at home 964 85.5% Speak English very well164 14.5% Speak English less than very well3.8% of residents speak other language at home 762 100.0% Speak English very well
English speakers - Native, born elsewhere 94.2% of residents of Peoria speak English at home.
3.3% of residents speak Spanish at home 49 100.0% Speak English very well2.5% of residents speak other language at home 37 100.0% Speak English very well
English speakers - Foreign-born 13.9% of residents of Peoria speak English at home.
16.5% of residents speak Spanish at home 318 23.0% Speak English very well1,065 77.0% Speak English less than very well69.5% of residents speak other language at home 3,003 51.6% Speak English very well2,819 48.4% Speak English less than very well
White (Caucasian) - Speak only English Native:
95.7% (52,711)Foreign-born:
35.6% (466)
White (Caucasian) - Speak another language Native:
4.3% (2,393)Foreign-born:
64.4% (844)
Black or African American - Speak only English Native:
99.0% (24,508)Foreign-born:
38.7% (451)
Black or African American - Speak another language Native:
1.0% (254)Foreign-born:
62.1% (723)
American Indian / Alaska Native - Speak only English Native:
81.8% (156)Foreign-born:
4.7% (4)
American Indian / Alaska Native - Speak another language Native:
6.1% (12)Foreign-born:
95.7% (75)
Asian - Speak only English Native:
53.9% (1,078)Foreign-born:
12.5% (600)
Asian - Speak another language Native:
46.1% (921)Foreign-born:
87.5% (4,189)
Other race - Speak another language Native:
47.7% (808)Foreign-born:
100.0% (1,092)
Two or more races - Speak only English Native:
90.4% (7,895)Foreign-born:
12.8% (82)
Two or more races - Speak another language Native:
7.9% (688)Foreign-born:
86.9% (556)
White alone - Speak only English Native:
96.4% (52,125)Foreign-born:
37.8% (466)
White alone - Speak another language Native:
3.6% (1,966)Foreign-born:
62.2% (768)
Hispanic or Latino - Speak another language Native:
27.0% (1,687)Foreign-born:
100.0% (1,570)
Foreign-born residents in Peoria 10,303 residents are foreign born (5.5% Asia , 2.1% Latin America ).
This city:
9.3%Illinois:
14.1%
Marital status for residents in Peoria Marital status - White (Caucasian) population 15 years and over
Males 37.0% Never married46.5% Now married2.0% Separated2.6% Widowed12.0% DivorcedFemales 27.7% Never married44.5% Now married1.0% Separated12.1% Widowed14.8% DivorcedWomen who gave birth in the past 12 months Now married:
76.3% (708)Unmarried:
23.7% (220)
Women who did not give birth in the past 12 months Now married:
40.5% (5,187)Unmarried:
59.5% (7,634)
Marital status - Black or African American population 15 years and over
Males 47.6% Never married26.7% Now married6.7% Separated5.2% Widowed13.8% DivorcedFemales 51.2% Never married18.4% Now married7.4% Separated7.7% Widowed15.2% DivorcedWomen who gave birth in the past 12 months Now married:
24.6% (207)Unmarried:
75.4% (635)
Women who did not give birth in the past 12 months Now married:
17.9% (1,232)Unmarried:
82.1% (5,651)
Marital status - American Indian / Alaska Native population 15 years and over
Males 31.6% Never married42.9% Now married4.1% Separated20.4% Widowed1.0% DivorcedFemales 28.0% Never married37.3% Now married0.0% Separated0.0% Widowed34.7% DivorcedWomen who did not give birth in the past 12 months Now married:
0.0% (0)Unmarried:
100.0% (32)
Marital status - Asian population 15 years and over
Males 35.4% Never married62.6% Now married0.0% Separated0.9% Widowed1.0% DivorcedFemales 23.8% Never married66.1% Now married0.4% Separated5.2% Widowed4.5% DivorcedWomen who gave birth in the past 12 months Now married:
79.4% (113)Unmarried:
20.6% (29)
Women who did not give birth in the past 12 months Now married:
65.3% (1,194)Unmarried:
34.7% (633)
Marital status - Other race population 15 years and over
Males 40.6% Never married50.5% Now married0.7% Separated0.8% Widowed7.4% DivorcedFemales 37.9% Never married45.7% Now married2.0% Separated6.2% Widowed8.2% DivorcedWomen who gave birth in the past 12 months Now married:
82.1% (64)Unmarried:
17.9% (14)
Women who did not give birth in the past 12 months Now married:
39.9% (307)Unmarried:
60.1% (462)
Marital status - Two or more races population 15 years and over
Males 61.6% Never married26.6% Now married0.0% Separated0.0% Widowed11.8% DivorcedFemales 52.7% Never married31.5% Now married0.0% Separated1.3% Widowed14.5% DivorcedWomen who gave birth in the past 12 months Now married:
19.7% (44)Unmarried:
80.3% (181)
Women who did not give birth in the past 12 months Now married:
23.8% (653)Unmarried:
76.2% (2,086)
Marital status - White alone, not Hispanic / Latino population 15 years and over
Males 36.8% Never married46.6% Now married2.0% Separated2.6% Widowed12.0% DivorcedFemales 26.9% Never married44.9% Now married1.0% Separated12.1% Widowed15.1% DivorcedWomen who gave birth in the past 12 months Now married:
76.3% (708)Unmarried:
23.7% (220)
Women who did not give birth in the past 12 months Now married:
40.6% (4,940)Unmarried:
59.4% (7,216)
Marital status - Hispanic or Latino population 15 years and over
Males 54.8% Never married29.0% Now married0.0% Separated2.0% Widowed14.2% DivorcedFemales 45.8% Never married38.7% Now married0.0% Separated3.2% Widowed12.3% DivorcedWomen who gave birth in the past 12 months Now married:
66.9% (109)Unmarried:
33.1% (54)
Women who did not give birth in the past 12 months Now married:
40.1% (769)Unmarried:
59.9% (1,151)
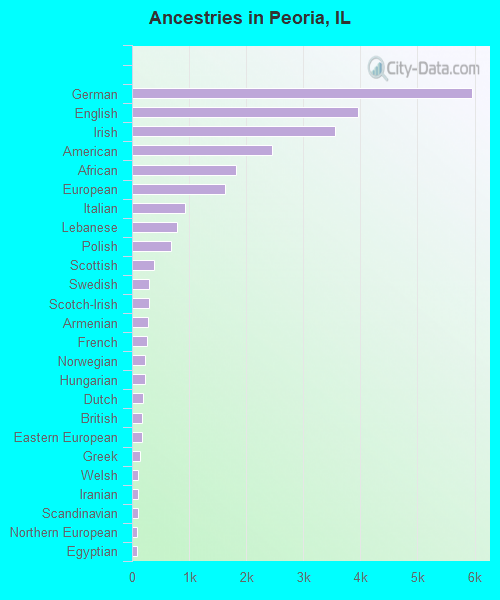
Ancestries in Peoria
5,955 10.5% German3,955 7.0% English3,556 6.3% Irish2,450 4.3% American1,821 3.2% African1,629 2.9% European929 1.6% Italian791 1.4% Lebanese682 1.2% Polish390 0.7% Scottish293 0.5% Swedish290 0.5% Scotch-Irish272 0.5% Armenian261 0.5% French235 0.4% Norwegian225 0.4% Hungarian192 0.3% Dutch177 0.3% British177 0.3% Eastern European133 0.2% Greek110 0.2% Welsh108 0.2% Iranian101 0.2% Scandinavian92 0.2% Northern European84 0.1% Egyptian63 0.1% Australian63 0.1% Croatian61 0.1% Swiss56 0.10% Ghanaian54 0.10% Romanian51 0.09% Ukrainian48 0.09% Portuguese45 0.08% Nigerian44 0.08% Czech43 0.08% Danish42 0.07% Russian38 0.07% French Canadian37 0.07% Trinidadian and Tobagonian32 0.06% Ethiopian29 0.05% Maltese27 0.05% Pennsylvania German26 0.05% Moroccan23 0.04% Austrian22 0.04% Brazilian21 0.04% Turkish18 0.03% Slovak18 0.03% Palestinian16 0.03% Lithuanian16 0.03% Bulgarian12 0.02% Czechoslovakian10 0.02% Cape Verdean8 0.01% Jordanian6 0.01% Slavic5 0.01% Albanian5 0.01% Belgian4 0.01% Sudanese3 0.01% Bahamian
Geographical mobility in Peoria Same house 1 year ago 48,995 84.0% White (Caucasian)24,122 83.5% Black or African American219 81.3% American Indian / Alaska Native4,747 67.4% Asian14 100.0% Native Hawaiian / Pacific Islander2,831 87.5% Other race6,173 64.1% Two or more races48,099 84.1% White alone, not Hispanic / Latino6,582 76.6% Hispanic or LatinoMoved within same county 3,910 6.7% White / Caucasian3,911 13.5% Black or African American10 3.5% American Indian / Alaska Native1,234 17.5% Asian199 6.1% Other race3,093 32.1% Two or more races3,823 6.7% White alone, not Hispanic / Latino1,377 16.0% Hispanic or LatinoMoved within same state 3,519 6.0% White / Caucasian353 1.2% Black or African American5 1.9% American Indian / Alaska Native773 11.0% Asian87 2.7% Other race221 2.3% Two or more races3,478 6.1% White alone, not Hispanic / Latino322 3.7% Hispanic or LatinoMoved from different state 1,405 2.4% White / Caucasian288 1.0% Black or African American35 13.1% American Indian / Alaska Native81 1.2% Asian125 3.9% Other race141 1.5% Two or more races1,340 2.3% White alone, not Hispanic / Latino315 3.7% Hispanic or LatinoMoved from abroad 466 0.8% White198 0.7% Black or African American206 2.9% Asian466 0.8% White alone, not Hispanic / Latino
Children Nativity (place of birth) in Peoria
Children under 6 years - Living with two parents Both parents native 3,279 100.0% NativeBoth parents foreign-born 976 67.8% Native463 32.2% Foreign-bornOne native, one foreign-born parent 451 100.0% NativeChildren under 6 years - Living with one parent Native parent 3,543 100.0% NativeForeign-born parent 60 19.7% Native246 80.3% Foreign-bornChildren 6 to 17 years - Living with two parents Both parents native 5,928 98.2% Native106 1.8% Foreign-bornBoth parents foreign-born 960 75.4% Native313 24.6% Foreign-bornOne native, one foreign-born parent 558 100.0% NativeChildren 6 to 17 years - Living with one parent Native parent 7,583 96.3% Native288 3.7% Foreign-bornForeign-born parent 483 83.0% Native99 17.0% Foreign-born
Grandparents responsible for own grandchildren in Peoria
Grandparents (30 to 59 years) White / Caucasian 145 53.4% Responsible for grandchildren126 46.6% Not responsible for grandchildrenBlack or African American 60 46.9% Responsible for grandchildren68 53.1% Not responsible for grandchildrenOther race 51 40.0% Responsible for grandchildren77 60.0% Not responsible for grandchildrenTwo or more races 13 100.0% Responsible for grandchildrenWhite alone, not Hispanic / Latino 160 53.8% Responsible for grandchildren137 46.2% Not responsible for grandchildrenHispanic or Latino 34 27.4% Responsible for grandchildren91 72.6% Not responsible for grandchildrenGrandparents (60 years and over) White / Caucasian 214 59.1% Responsible for grandchildren148 40.9% Not responsible for grandchildrenBlack or African American 161 60.9% Responsible for grandchildren103 39.1% Not responsible for grandchildrenOther race 37 100.0% Not responsible for grandchildrenTwo or more races 52 86.6% Responsible for grandchildren8 13.4% Not responsible for grandchildrenWhite alone, not Hispanic / Latino 232 58.0% Responsible for grandchildren168 42.0% Not responsible for grandchildrenHispanic or Latino 39 100.0% Not responsible for grandchildren