Races in Pennsville, New Jersey (NJ) Detailed Stats
Ancestries, Foreign-born residents, place of birth
Settings
X


Recent posts about races in Pennsville, New Jersey on our local forum with over 2,400,000 registered users:
 | Why Is South/Central Jersey So Relatively Undeveloped? (83 replies) |
| Help choosing a dentist in either Pennsville, Carneys Point, Millville, Vineland or Cape May Court House. (1 reply) |
| House to share in Salem County, Pennsville (0 replies) |
| South Jersey transit expansion? (55 replies) |
| living in Swedsboro or bridgport NJ (2 replies) |
| NJ Transit and PATCO (4 replies) |
Latest news about races in Pennsville, NJ collected exclusively by city-data.com from local newspapers, TV, and radio stations
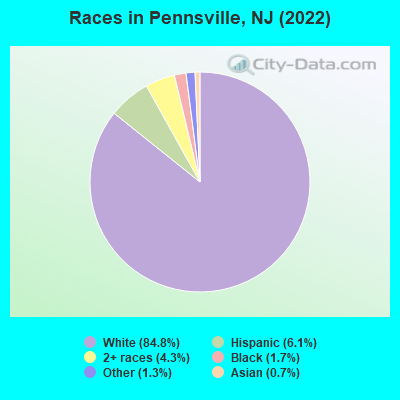
According to 2022 data, the most numerous races in Pennsville, NJ are White alone (10,402 residents), Hispanic (746 residents), and Black alone (210 residents). 93.0% of Pennsville residents speak English at home. 2.6% of Pennsville, NJ residents are foreign-born (1.2% born in Europe, 0.7% born in Latin America, 0.6% born in Asia), which is 795.8% less than the foreign-born rate of 23.0% across the entire state of New Jersey.
Race distribution in Pennsville
2000
2022

- 11,20096.1%White alone
- 1851.6%Hispanic
- 1030.9%Asian alone
- 780.7%Two or more races
- 650.6%Black alone
- 160.1%American Indian alone
- 80.07%Other race alone
- 20.02%Native Hawaiian and Other
Pacific Islander alone

-
- 10,40284.8%White alone
- 7466.1%Hispanic
- 5314.3%Two or more races
- 2101.7%Black alone
- 1541.3%Other race alone
- 920.7%Asian alone
- 70.06%American Indian alone
2000
2022
-
- 5,557,20966.0%White alone
- 1,117,19113.3%Hispanic
- 1,096,17113.0%Black alone
- 477,0125.7%Asian alone
- 133,6891.6%Two or more races
- 19,5650.2%Other race alone
- 11,3380.1%American Indian alone
- 2,1750.03%Native Hawaiian and Other
Pacific Islander alone

-
- 4,766,47651.5%White alone
- 2,028,47021.9%Hispanic
- 1,111,63212.0%Black alone
- 923,54610.0%Asian alone
- 332,2373.6%Two or more races
- 89,8471.0%Other race alone
- 8,5570.09%American Indian alone
- 9340.01%Native Hawaiian and Other
Pacific Islander alone

Income and house value in Pennsville
- Median household income in 2022
- $79,610White non-Hispanic householders
- $107,615Asian householders
- $65,656Some other race householders
- $60,529Two or more races householders
- $86,025Hispanic or Latino race householders
- Median 2022 house value
- $201,776White Non-Hispanic householders
- $170,236Black or African American householders
- $146,924American Indian or Alaska Native householders
- $251,926Asian householders
- $166,514Some other race householders
- $161,617Two or more races householders
- $244,874Hispanic or Latino householders
Household income for White non-Hispanic householders

Household income for Black householders

Household income for Asian householders

Household income for Some other race householders

Household income for Two or more races householders

Household income for Hispanic or Latino race householders

Median age by race in Pennsville
- 42.3Median age for White residents
- 39.9Males
- 46.6Females
- 38.8Median age for Black or African American residents
- 17.6Males
- 49.3Females
- -676,272,813.9Median age for American Indian / Alaska Native residents
- -670,465,336.5Males
- -688,298,917.7Females
- 34.7Median age for Asian residents
- 19.0Males
- 34.8Females
- -666,666,666.0Median age for Native Hawaiian / Pacific Islander residents
- -666,666,666.0Males
- -666,666,666.0Females
- 35.0Median age for Other race residents
- 27.3Males
- 16.5Females
- 24.4Median age for Two or more races residents
- 23.1Males
- 43.2Females
- 44.0Median age for White alone residents
- 41.0Males
- 46.2Females
- 22.1Median age for Hispanic or Latino residents
- 19.4Males
- 24.6Females
Owner/renter occupied households by race in Pennsville
- House owners and renters - White residents
- 3,73280.5%Owner occupied
- 90219.5%Renter occupied
- House owners and renters - Black or African American residents
- 610.9%Owner occupied
- 4689.1%Renter occupied
- House owners and renters - Asian residents
- 1874.4%Owner occupied
- 625.6%Renter occupied
- House owners and renters - Other race residents
- 9870.0%Owner occupied
- 4230.0%Renter occupied
- House owners and renters - Two or more races residents
- 26390.4%Owner occupied
- 289.6%Renter occupied
- House owners and renters - White alone residents
- 3,68979.4%Owner occupied
- 96020.6%Renter occupied
- House owners and renters - Hispanic or Latino residents
- 16288.6%Owner occupied
- 2111.4%Renter occupied
Language usage in Pennsville
- English speakers - Total
- 93.0% of residents of Pennsville speak English at home.
- 2.1% of residents speak Spanish at home
- 5221.1%Speak English very well
- 19578.9%Speak English less than very well
- 4.1% of residents speak other language at home
- 34572.0%Speak English very well
- 13428.0%Speak English less than very well
- English speakers - Born in the United States
- 93.7% of residents of Pennsville speak English at home.
- 0.5% of residents speak Spanish at home
- 1346.4%Speak English very well
- 1553.6%Speak English less than very well
- 7.1% of residents speak other language at home
- 35493.4%Speak English very well
- 256.6%Speak English less than very well
- English speakers - Native, born elsewhere
- 35.0% of residents of Pennsville speak English at home.
- 90.0% of residents speak Spanish at home
- 90100.0%Speak English less than very well
- English speakers - Foreign-born
- 42.2% of residents of Pennsville speak English at home.
- 8.1% of residents speak Spanish at home
- 414.8%Speak English very well
- 2385.2%Speak English less than very well
- 49.7% of residents speak other language at home
- 7545.5%Speak English very well
- 9054.5%Speak English less than very well
White (Caucasian) - Speak only English
| Native: | 98.4% (9,487) |
| Foreign-born: | 25.9% (34) |
White (Caucasian) - Speak another language
| Native: | 3.1% (296) |
| Foreign-born: | 74.8% (98) |
Asian - Speak another language
| Native: | 96.5% (43) |
| Foreign-born: | 86.2% (43) |
Other race - Speak only English
| Native: | 82.4% (404) |
| Foreign-born: | 80.6% (54) |
Two or more races - Speak only English
| Native: | 87.1% (505) |
| Foreign-born: | 50.1% (32) |
Two or more races - Speak another language
| Native: | 12.2% (71) |
| Foreign-born: | 53.1% (33) |
White alone - Speak only English
| Native: | 96.5% (9,458) |
| Foreign-born: | 20.2% (30) |
White alone - Speak another language
| Native: | 3.5% (346) |
| Foreign-born: | 80.0% (118) |
Hispanic or Latino - Speak only English
| Native: | 54.6% (305) |
| Foreign-born: | 100.0% (114) |
Hispanic or Latino - Speak another language
| Native: | 37.2% (208) |
| Foreign-born: | 17.1% (20) |
Foreign-born residents in Pennsville
316 residents are foreign born (1.2% Europe, 0.7% Latin America, 0.6% Asia).
| This city: | 2.6% |
| New Jersey: | 23.2% |


Marital status for residents in Pennsville
Marital status - White (Caucasian) population 15 years and over
- Males
- 36.8%Never married
- 44.4%Now married
- 2.3%Separated
- 4.9%Widowed
- 11.6%Divorced
- Females
- 30.5%Never married
- 41.9%Now married
- 3.1%Separated
- 8.8%Widowed
- 15.8%Divorced
Women who gave birth in the past 12 months
| Now married: | 8.0% (13) |
| Unmarried: | 92.0% (155) |
Women who did not give birth in the past 12 months
| Now married: | 36.9% (731) |
| Unmarried: | 63.1% (1,249) |
Marital status - Black or African American population 15 years and over
- Males
- 48.4%Never married
- 48.4%Now married
- 0.0%Separated
- 0.0%Widowed
- 3.2%Divorced
- Females
- 73.1%Never married
- 5.6%Now married
- 0.0%Separated
- 10.2%Widowed
- 11.1%Divorced
Women who did not give birth in the past 12 months
| Now married: | 9.8% (6) |
| Unmarried: | 90.2% (53) |
Marital status - Asian population 15 years and over
- Males
- 31.3%Never married
- 68.8%Now married
- 0.0%Separated
- 0.0%Widowed
- 0.0%Divorced
- Females
- 28.2%Never married
- 71.8%Now married
- 0.0%Separated
- 0.0%Widowed
- 0.0%Divorced
Women who did not give birth in the past 12 months
| Now married: | 68.6% (24) |
| Unmarried: | 31.4% (11) |
Marital status - Other race population 15 years and over
- Males
- 78.1%Never married
- 9.9%Now married
- 0.0%Separated
- 0.0%Widowed
- 12.0%Divorced
- Females
- 52.0%Never married
- 28.0%Now married
- 0.0%Separated
- 0.0%Widowed
- 20.0%Divorced
Women who did not give birth in the past 12 months
| Now married: | 28.0% (18) |
| Unmarried: | 72.0% (45) |
Marital status - Two or more races population 15 years and over
- Males
- 50.6%Never married
- 49.4%Now married
- 0.0%Separated
- 0.0%Widowed
- 0.0%Divorced
- Females
- 34.8%Never married
- 32.4%Now married
- 0.0%Separated
- 1.5%Widowed
- 31.4%Divorced
Women who did not give birth in the past 12 months
| Now married: | 17.5% (20) |
| Unmarried: | 82.5% (94) |
Marital status - White alone, not Hispanic / Latino population 15 years and over
- Males
- 36.8%Never married
- 43.9%Now married
- 2.4%Separated
- 5.1%Widowed
- 11.9%Divorced
- Females
- 30.3%Never married
- 41.4%Now married
- 3.2%Separated
- 8.9%Widowed
- 16.1%Divorced
Women who gave birth in the past 12 months
| Now married: | 1.2% (2) |
| Unmarried: | 98.8% (158) |
Women who did not give birth in the past 12 months
| Now married: | 36.9% (721) |
| Unmarried: | 63.1% (1,233) |
Marital status - Hispanic or Latino population 15 years and over
- Males
- 71.9%Never married
- 28.1%Now married
- 0.0%Separated
- 0.0%Widowed
- 0.0%Divorced
- Females
- 57.0%Never married
- 38.0%Now married
- 0.0%Separated
- 0.0%Widowed
- 5.0%Divorced
Women who gave birth in the past 12 months
| Now married: | 100.0% (12) |
| Unmarried: | 0.0% (0) |
Women who did not give birth in the past 12 months
| Now married: | 24.2% (39) |
| Unmarried: | 75.8% (122) |
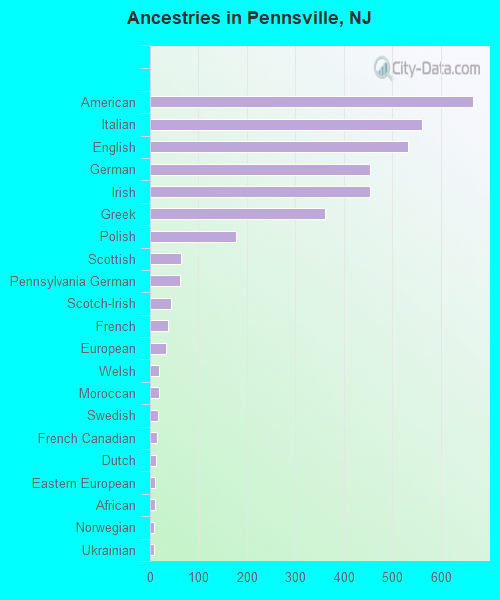
Ancestries in Pennsville

- 66615.4%American
- 56113.0%Italian
- 53212.3%English
- 45410.5%German
- 45410.5%Irish
- 3628.4%Greek
- 1774.1%Polish
- 641.5%Scottish
- 611.4%Pennsylvania German
- 431.0%Scotch-Irish
- 370.9%French
- 320.7%European
- 190.4%Welsh
- 180.4%Moroccan
- 160.4%Swedish
- 150.3%French Canadian
- 130.3%Dutch
- 110.3%Eastern European
- 110.3%African
- 90.2%Norwegian
- 80.2%Ukrainian
- 60.1%Austrian
- 50.1%Finnish
- 30.07%Hungarian
Geographical mobility in Pennsville

- Same house 1 year ago
- 9,57191.9%White (Caucasian)
- 17273.6%Black or African American
- 9096.6%Asian
- 440100.0%Other race
- 69292.5%Two or more races
- 9,41392.2%White alone, not Hispanic / Latino
- 76198.4%Hispanic or Latino

-
- Moved within same county
- 4023.9%White / Caucasian
- 4820.5%Black or African American
- 547.2%Two or more races
- 4224.1%White alone, not Hispanic / Latino
- 253.2%Hispanic or Latino

-
- Moved within same state
- 1131.1%White / Caucasian
- 14100.0%American Indian / Alaska Native
- 43.9%Asian
- 830.8%White alone, not Hispanic / Latino

-
- Moved from different state
- 3153.0%White / Caucasian
- 3483.4%White alone, not Hispanic / Latino

Children Nativity (place of birth) in Pennsville
Place of birth for residents in Pennsville
![Place of birth for the foreign-born population - Regions]()
- 151Europe
- 118Southern Europe
- 94Americas
- 92Latin America
- 70Asia
- 61South Central Asia
- 57Central America
- 32Northern Europe
- 27Caribbean
- 7Eastern Asia
- 7South America
- 2Western Asia
- 2Northern America

![Place of birth for the foreign-born population - Countries]()
- 79Greece
- 61India
- 57Guatemala
- 39Italy
- 32United Kingdom
- 27Cuba
- 7Korea
- 7Colombia
- 2Jordan
- 2Canada

Grandparents responsible for own grandchildren in Pennsville
Zip codes: 08070.