Races in Pebble Creek, Florida (FL) Detailed Stats
Data:
Races - White alone (%)
Races - White alone (% change since 2000)
Races - Black alone (%)
Races - Black alone (% change since 2000)
Races - American Indian alone (%)
Races - American Indian alone (% change since 2000)
Races - Asian alone (%)
Races - Asian alone (% change since 2000)
Races - Hispanic (%)
Races - Hispanic (% change since 2000)
Races - Native Hawaiian and Other Pacific Islander alone (%)
Races - Native Hawaiian and Other Pacific Islander alone (% change since 2000)
Races - Two or more races(%)
Races - Two or more races(% change since 2000)
Races - Other race alone (%)
Races - Other race alone (% change since 2000)
Racial diversity
Place of birth - Born in state of residence (%)
Place of birth - Born in state of residence (%) - White
Place of birth - Born in state of residence (%) - Black or African American
Place of birth - Born in state of residence (%) - Asian
Place of birth - Born in state of residence (%) - Hispanic or Latino
Place of birth - Born in state of residence (%) - American Indian and Alaska Native
Place of birth - Born in state of residence (%) - Multirace
Place of birth - Born in state of residence (%) - Other Race
Place of birth - Born in other state (%)
Place of birth - Born in other state (%) - White
Place of birth - Born in other state (%) - Black or African American
Place of birth - Born in other state (%) - Asian
Place of birth - Born in other state (%) - Hispanic or Latino
Place of birth - Born in other state (%) - American Indian and Alaska Native
Place of birth - Born in other state (%) - Multirace
Place of birth - Born in other state (%) - Other Race
Place of birth - Native, outside of US (%)
Place of birth - Native, outside of US (%) - White
Place of birth - Native, outside of US (%) - Black or African American
Place of birth - Native, outside of US (%) - Asian
Place of birth - Native, outside of US (%) - Hispanic or Latino
Place of birth - Native, outside of US (%) - American Indian and Alaska Native
Place of birth - Native, outside of US (%) - Multirace
Place of birth - Native, outside of US (%) - Other Race
Place of birth - Foreign born (%)
Place of birth - Foreign born (%) - White
Place of birth - Foreign born (%) - Black or African American
Place of birth - Foreign born (%) - Asian
Place of birth - Foreign born (%) - Hispanic or Latino
Place of birth - Foreign born (%) - American Indian and Alaska Native
Place of birth - Foreign born (%) - Multirace
Place of birth - Foreign born (%) - Other Race
Residents speaking English at home (%)
Residents speaking English at home - Born in the United States (%)
Residents speaking English at home - Native, born elsewhere (%)
Residents speaking English at home - Foreign born (%)
Residents speaking Spanish at home (%)
Residents speaking Spanish at home - Born in the United States (%)
Residents speaking Spanish at home - Native, born elsewhere (%)
Residents speaking Spanish at home - Foreign born (%)
Residents speaking other language at home (%)
Residents speaking other language at home - Born in the United States (%)
Residents speaking other language at home - Native, born elsewhere (%)
Residents speaking other language at home - Foreign born (%)
Marital status - Never married (%)
Marital status - Now married (%)
Marital status - Separated (%)
Marital status - Widowed (%)
Marital status - Divorced (%)
Ancestries Reported - Arab (%)
Ancestries Reported - Czech (%)
Ancestries Reported - Danish (%)
Ancestries Reported - Dutch (%)
Ancestries Reported - English (%)
Ancestries Reported - French (%)
Ancestries Reported - French Canadian (%)
Ancestries Reported - German (%)
Ancestries Reported - Greek (%)
Ancestries Reported - Hungarian (%)
Ancestries Reported - Irish (%)
Ancestries Reported - Italian (%)
Ancestries Reported - Lithuanian (%)
Ancestries Reported - Norwegian (%)
Ancestries Reported - Polish (%)
Ancestries Reported - Portuguese (%)
Ancestries Reported - Russian (%)
Ancestries Reported - Scotch-Irish (%)
Ancestries Reported - Scottish (%)
Ancestries Reported - Slovak (%)
Ancestries Reported - Subsaharan African (%)
Ancestries Reported - Swedish (%)
Ancestries Reported - Swiss (%)
Ancestries Reported - Ukrainian (%)
Ancestries Reported - United States (%)
Ancestries Reported - Welsh (%)
Ancestries Reported - West Indian (%)
Ancestries Reported - Other (%)
Geographical mobility - Same house 1 year ago (%)
Geographical mobility - Same house 1 year ago (%) - White
Geographical mobility - Same house 1 year ago (%) - Black or African American
Geographical mobility - Same house 1 year ago (%) - Asian
Geographical mobility - Same house 1 year ago (%) - Hispanic or Latino
Geographical mobility - Same house 1 year ago (%) - American Indian and Alaska Native
Geographical mobility - Same house 1 year ago (%) - Multirace
Geographical mobility - Same house 1 year ago (%) - Other Race
Geographical mobility - Moved within same county (%)
Geographical mobility - Moved within same county (%) - White
Geographical mobility - Moved within same county (%) - Black or African American
Geographical mobility - Moved within same county (%) - Asian
Geographical mobility - Moved within same county (%) - Hispanic or Latino
Geographical mobility - Moved within same county (%) - American Indian and Alaska Native
Geographical mobility - Moved within same county (%) - Multirace
Geographical mobility - Moved within same county (%) - Other Race
Geographical mobility - Moved from different county within same state (%)
Geographical mobility - Moved from different county within same state (%) - White
Geographical mobility - Moved from different county within same state (%) - Black or African American
Geographical mobility - Moved from different county within same state (%) - Asian
Geographical mobility - Moved from different county within same state (%) - Hispanic or Latino
Geographical mobility - Moved from different county within same state (%) - American Indian and Alaska Native
Geographical mobility - Moved from different county within same state (%) - Multirace
Geographical mobility - Moved from different county within same state (%) - Other Race
Geographical mobility - Moved from different state (%)
Geographical mobility - Moved from different state (%) - White
Geographical mobility - Moved from different state (%) - Black or African American
Geographical mobility - Moved from different state (%) - Asian
Geographical mobility - Moved from different state (%) - Hispanic or Latino
Geographical mobility - Moved from different state (%) - American Indian and Alaska Native
Geographical mobility - Moved from different state (%) - Multirace
Geographical mobility - Moved from different state (%) - Other Race
Geographical mobility - Moved from abroad (%)
Geographical mobility - Moved from abroad (%) - White
Geographical mobility - Moved from abroad (%) - Black or African American
Geographical mobility - Moved from abroad (%) - Asian
Geographical mobility - Moved from abroad (%) - Hispanic or Latino
Geographical mobility - Moved from abroad (%) - American Indian and Alaska Native
Geographical mobility - Moved from abroad (%) - Multirace
Geographical mobility - Moved from abroad (%) - Other Race
Place of birth for the foreign-born population - Ireland (%)
Place of birth for the foreign-born population - Denmark (%)
Place of birth for the foreign-born population - Norway (%)
Place of birth for the foreign-born population - Sweden (%)
Place of birth for the foreign-born population - United Kingdom (%)
Place of birth for the foreign-born population - England (%)
Place of birth for the foreign-born population - Scotland (%)
Place of birth for the foreign-born population - Other Northern Europe (%)
Place of birth for the foreign-born population - Austria (%)
Place of birth for the foreign-born population - Belgium (%)
Place of birth for the foreign-born population - France (%)
Place of birth for the foreign-born population - Germany (%)
Place of birth for the foreign-born population - Netherlands (%)
Place of birth for the foreign-born population - Switzerland (%)
Place of birth for the foreign-born population - Other Western Europe (%)
Place of birth for the foreign-born population - Greece (%)
Place of birth for the foreign-born population - Italy (%)
Place of birth for the foreign-born population - Portugal (%)
Place of birth for the foreign-born population - Spain (%)
Place of birth for the foreign-born population - Other Southern Europe (%)
Place of birth for the foreign-born population - Albania (%)
Place of birth for the foreign-born population - Belarus (%)
Place of birth for the foreign-born population - Bosnia and Herzegovina (%)
Place of birth for the foreign-born population - Bulgaria (%)
Place of birth for the foreign-born population - Croatia (%)
Place of birth for the foreign-born population - Czechoslovakia (%)
Place of birth for the foreign-born population - Hungary (%)
Place of birth for the foreign-born population - Latvia (%)
Place of birth for the foreign-born population - Lithuania (%)
Place of birth for the foreign-born population - North Macedonia (Macedonia) (%)
Place of birth for the foreign-born population - Moldova (%)
Place of birth for the foreign-born population - Poland (%)
Place of birth for the foreign-born population - Romania (%)
Place of birth for the foreign-born population - Russia (%)
Place of birth for the foreign-born population - Serbia (%)
Place of birth for the foreign-born population - Ukraine (%)
Place of birth for the foreign-born population - Other Eastern Europe (%)
Place of birth for the foreign-born population - China (%)
Place of birth for the foreign-born population - Hong Kong (%)
Place of birth for the foreign-born population - Taiwan (%)
Place of birth for the foreign-born population - Japan (%)
Place of birth for the foreign-born population - Korea (%)
Place of birth for the foreign-born population - Other Eastern Asia (%)
Place of birth for the foreign-born population - Afghanistan (%)
Place of birth for the foreign-born population - Bangladesh (%)
Place of birth for the foreign-born population - India (%)
Place of birth for the foreign-born population - Iran (%)
Place of birth for the foreign-born population - Kazakhstan (%)
Place of birth for the foreign-born population - Nepal (%)
Place of birth for the foreign-born population - Pakistan (%)
Place of birth for the foreign-born population - Sri Lanka (%)
Place of birth for the foreign-born population - Uzbekistan (%)
Place of birth for the foreign-born population - Other South Central Asia (%)
Place of birth for the foreign-born population - Burma (%)
Place of birth for the foreign-born population - Cambodia (%)
Place of birth for the foreign-born population - Indonesia (%)
Place of birth for the foreign-born population - Laos (%)
Place of birth for the foreign-born population - Malaysia (%)
Place of birth for the foreign-born population - Philippines (%)
Place of birth for the foreign-born population - Singapore (%)
Place of birth for the foreign-born population - Thailand (%)
Place of birth for the foreign-born population - Vietnam (%)
Place of birth for the foreign-born population - Other South Eastern Asia (%)
Place of birth for the foreign-born population - Armenia (%)
Place of birth for the foreign-born population - Iraq (%)
Place of birth for the foreign-born population - Israel (%)
Place of birth for the foreign-born population - Jordan (%)
Place of birth for the foreign-born population - Kuwait (%)
Place of birth for the foreign-born population - Lebanon (%)
Place of birth for the foreign-born population - Saudi Arabia (%)
Place of birth for the foreign-born population - Syria (%)
Place of birth for the foreign-born population - Turkey (%)
Place of birth for the foreign-born population - Yemen (%)
Place of birth for the foreign-born population - Other Western Asia (%)
Place of birth for the foreign-born population - Eritrea (%)
Place of birth for the foreign-born population - Ethiopia (%)
Place of birth for the foreign-born population - Kenya (%)
Place of birth for the foreign-born population - Somalia (%)
Place of birth for the foreign-born population - Uganda (%)
Place of birth for the foreign-born population - Zimbabwe (%)
Place of birth for the foreign-born population - Other Eastern Africa (%)
Place of birth for the foreign-born population - Cameroon (%)
Place of birth for the foreign-born population - Congo (%)
Place of birth for the foreign-born population - Democratic Republic of Congo (Zaire) (%)
Place of birth for the foreign-born population - Other Middle Africa (%)
Place of birth for the foreign-born population - Egypt (%)
Place of birth for the foreign-born population - Morocco (%)
Place of birth for the foreign-born population - Sudan (%)
Place of birth for the foreign-born population - Other Northern Africa (%)
Place of birth for the foreign-born population - South Africa (%)
Place of birth for the foreign-born population - Other Southern Africa (%)
Place of birth for the foreign-born population - Cabo Verde (%)
Place of birth for the foreign-born population - Ghana (%)
Place of birth for the foreign-born population - Liberia (%)
Place of birth for the foreign-born population - Nigeria (%)
Place of birth for the foreign-born population - Senegal (%)
Place of birth for the foreign-born population - Sierra Leone (%)
Place of birth for the foreign-born population - Other Western Africa (%)
Place of birth for the foreign-born population - Australia (%)
Place of birth for the foreign-born population - New Zealand (%)
Place of birth for the foreign-born population - Fiji (%)
Place of birth for the foreign-born population - Micronesia (%)
Place of birth for the foreign-born population - Bahamas (%)
Place of birth for the foreign-born population - Barbados (%)
Place of birth for the foreign-born population - Cuba (%)
Place of birth for the foreign-born population - Dominica (%)
Place of birth for the foreign-born population - Dominican Republic (%)
Place of birth for the foreign-born population - Grenada (%)
Place of birth for the foreign-born population - Haiti (%)
Place of birth for the foreign-born population - Jamaica (%)
Place of birth for the foreign-born population - St. Vincent and the Grenadines (%)
Place of birth for the foreign-born population - Trinidad and Tobago (%)
Place of birth for the foreign-born population - West Indies (%)
Place of birth for the foreign-born population - Other Caribbean (%)
Place of birth for the foreign-born population - Belize (%)
Place of birth for the foreign-born population - Costa Rica (%)
Place of birth for the foreign-born population - El Salvador (%)
Place of birth for the foreign-born population - Guatemala (%)
Place of birth for the foreign-born population - Honduras (%)
Place of birth for the foreign-born population - Mexico (%)
Place of birth for the foreign-born population - Nicaragua (%)
Place of birth for the foreign-born population - Panama (%)
Place of birth for the foreign-born population - Other Central America (%)
Place of birth for the foreign-born population - Argentina (%)
Place of birth for the foreign-born population - Bolivia (%)
Place of birth for the foreign-born population - Brazil (%)
Place of birth for the foreign-born population - Chile (%)
Place of birth for the foreign-born population - Colombia (%)
Place of birth for the foreign-born population - Ecuador (%)
Place of birth for the foreign-born population - Guyana (%)
Place of birth for the foreign-born population - Peru (%)
Place of birth for the foreign-born population - Uruguay (%)
Place of birth for the foreign-born population - Venezuela (%)
Place of birth for the foreign-born population - Other South America (%)
Place of birth for the foreign-born population - Canada (%)
Place of birth for the foreign-born population - Other Northern America (%)
Place of birth for the foreign-born population - Other (%)
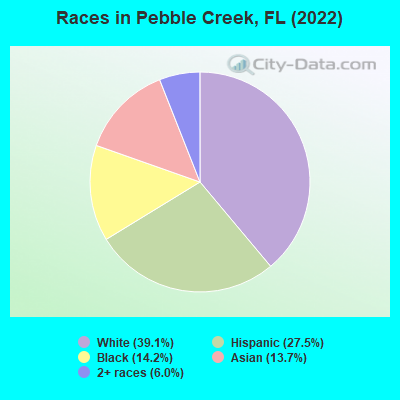
According to 2022 data, the most numerous races in Pebble Creek, FL are White alone (4,427 residents), Hispanic (3,105 residents), and Black alone (1,610 residents). 54.6% of Pebble Creek residents speak English at home. 27.5% of Pebble Creek, FL residents are foreign-born (12.4% born in Asia, 10.5% born in Latin America), which is 23.6% greater than the foreign-born rate of 21.0% across the entire state of Florida.
Race distribution in Pebble Creek
2000 2022
10,458,509 65.4% White alone 2,682,715 16.8% Hispanic 2,264,268 14.2% Black alone 261,693 1.6% Asian alone 236,954 1.5% Two or more races 42,358 0.3% American Indian alone 28,994 0.2% Other race alone 6,887 0.04% Native Hawaiian and Other
11,309,403 50.8% White alone 6,025,039 27.1% Hispanic 3,241,015 14.6% Black alone 861,630 3.9% Two or more races 623,692 2.8% Asian alone 152,054 0.7% Other race alone 22,504 0.1% American Indian alone 9,486 0.04% Native Hawaiian and Other
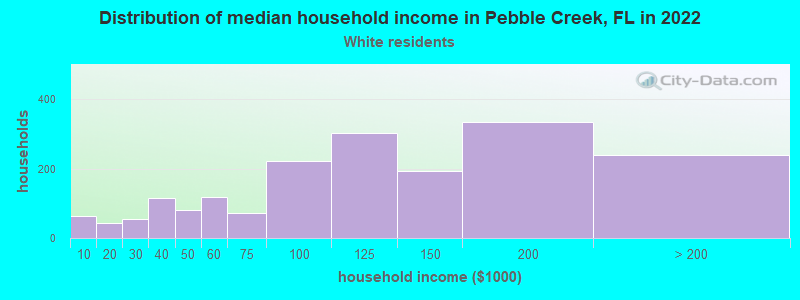
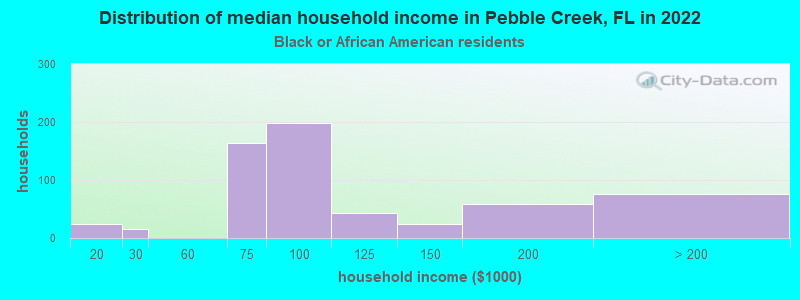
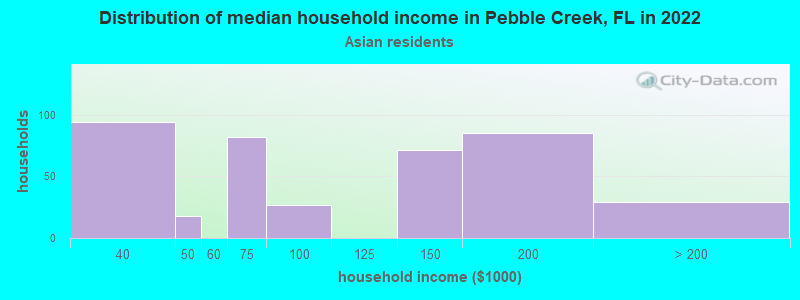
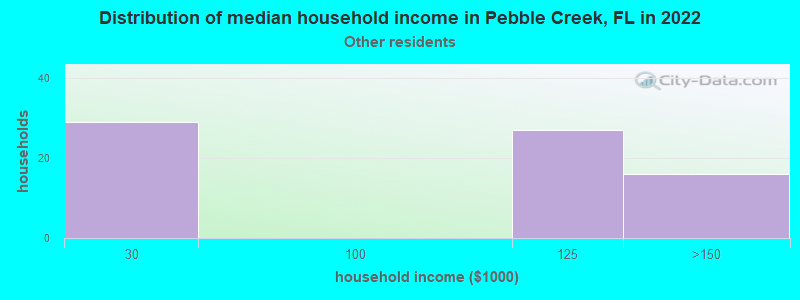
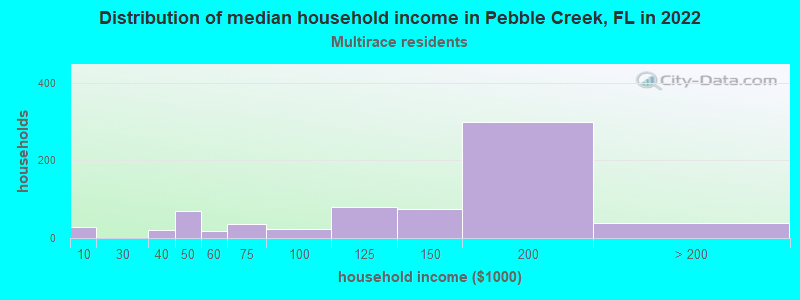
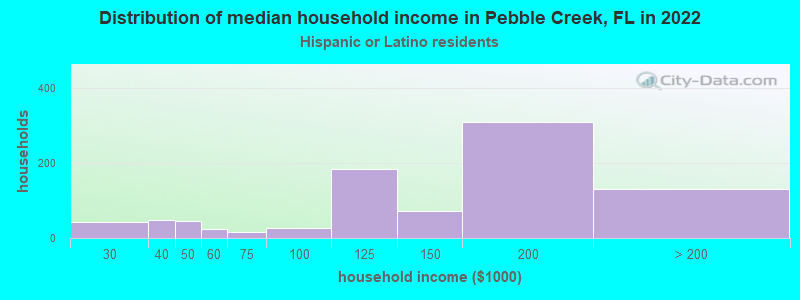
Income and house value in Pebble Creek Median household income in 2022 $101,468 White non-Hispanic householders$80,426 Black householders$125,850 Asian householders$132,134 Two or more races householders$144,276 Hispanic or Latino race householdersMedian 2022 house value $460,470 White Non-Hispanic householders$371,879 Black or African American householders $434,686 Asian householders$371,879 Some other race householders$488,567 Two or more races householders$377,168 Hispanic or Latino householders
Median age by race in Pebble Creek
38.7 Median age for White residents40.2 37.8 41.0 Median age for Black or African American residents43.5 40.3 -670,487,105.3 Median age for American Indian / Alaska Native residents-676,245,210.1 -655,399,060.4 43.8 Median age for Asian residents44.7 43.8 -848,484,847.6 Median age for Native Hawaiian / Pacific Islander residents-776,729,559.0 -490,118,576.6 31.2 Median age for Other race residents31.3 31.1 30.8 Median age for Two or more races residents20.7 34.9 37.5 Median age for White alone residents38.9 36.7 36.2 Median age for Hispanic or Latino residents36.6 36.3
Owner/renter occupied households by race in Pebble Creek
House owners and renters - White residents 1,395 76.5% Owner occupied430 23.5% Renter occupiedHouse owners and renters - Black or African American residents 435 72.3% Owner occupied167 27.7% Renter occupiedHouse owners and renters - American Indian / Alaska Native residents 14 100.0% Renter occupiedHouse owners and renters - Asian residents 509 92.7% Owner occupied40 7.3% Renter occupiedHouse owners and renters - Other race residents 93 100.0% Owner occupiedHouse owners and renters - Two or more races residents 503 71.3% Owner occupied202 28.7% Renter occupiedHouse owners and renters - White alone residents 1,124 71.7% Owner occupied443 28.3% Renter occupiedHouse owners and renters - Hispanic or Latino residents 766 88.6% Owner occupied98 11.4% Renter occupied
Language usage in Pebble Creek
English speakers - Total 54.6% of residents of Pebble Creek speak English at home.
20.2% of residents speak Spanish at home 1,806 86.6% Speak English very well280 13.4% Speak English less than very well25.4% of residents speak other language at home 1,914 73.0% Speak English very well709 27.0% Speak English less than very well
English speakers - Born in the United States 73.1% of residents of Pebble Creek speak English at home.
17.5% of residents speak Spanish at home 508 93.7% Speak English very well34 6.3% Speak English less than very well8.3% of residents speak other language at home 243 94.2% Speak English very well15 5.8% Speak English less than very well
English speakers - Native, born elsewhere 15.6% of residents of Pebble Creek speak English at home.
70.5% of residents speak Spanish at home 326 80.3% Speak English very well80 19.7% Speak English less than very well17.2% of residents speak other language at home 99 100.0% Speak English very well
English speakers - Foreign-born 19.5% of residents of Pebble Creek speak English at home.
21.0% of residents speak Spanish at home 522 76.7% Speak English very well159 23.3% Speak English less than very well58.2% of residents speak other language at home 1,200 63.7% Speak English very well685 36.3% Speak English less than very well
White (Caucasian) - Speak only English Native:
82.7% (3,262)Foreign-born:
22.4% (79)
White (Caucasian) - Speak another language Native:
11.3% (447)Foreign-born:
74.0% (260)
Black or African American - Speak only English Native:
91.8% (1,047)Foreign-born:
51.9% (266)
Black or African American - Speak another language Native:
8.1% (92)Foreign-born:
48.0% (246)
Asian - Speak only English Native:
43.1% (99)Foreign-born:
10.9% (133)
Asian - Speak another language Native:
58.2% (134)Foreign-born:
89.0% (1,086)
Other race - Speak another language Native:
84.7% (194)Foreign-born:
100.0% (194)
Two or more races - Speak only English Native:
32.8% (601)Foreign-born:
21.6% (212)
Two or more races - Speak another language Native:
69.2% (1,267)Foreign-born:
72.6% (710)
White alone - Speak only English Native:
88.4% (2,995)Foreign-born:
10.0% (49)
White alone - Speak another language Native:
11.0% (372)Foreign-born:
87.3% (427)
Hispanic or Latino - Speak only English Native:
31.9% (681)Foreign-born:
5.7% (44)
Hispanic or Latino - Speak another language Native:
66.0% (1,408)Foreign-born:
94.2% (722)
Foreign-born residents in Pebble Creek 3,110 residents are foreign born (12.4% Asia , 10.5% Latin America ).
This city:
27.5%Florida:
21.1%
Marital status for residents in Pebble Creek Marital status - White (Caucasian) population 15 years and over
Males 29.5% Never married64.9% Now married0.8% Separated1.1% Widowed3.6% DivorcedFemales 19.7% Never married56.9% Now married1.8% Separated4.6% Widowed17.0% DivorcedWomen who gave birth in the past 12 months Now married:
100.0% (20)Unmarried:
0.0% (0)
Women who did not give birth in the past 12 months Now married:
57.1% (516)Unmarried:
42.9% (387)
Marital status - Black or African American population 15 years and over
Males 37.0% Never married58.0% Now married0.0% Separated0.0% Widowed5.0% DivorcedFemales 35.9% Never married44.2% Now married0.0% Separated9.4% Widowed10.5% DivorcedWomen who did not give birth in the past 12 months Now married:
38.0% (166)Unmarried:
62.0% (270)
Marital status - Asian population 15 years and over
Males 18.4% Never married78.0% Now married0.0% Separated3.6% Widowed0.0% DivorcedFemales 11.3% Never married68.3% Now married0.0% Separated0.0% Widowed20.4% DivorcedWomen who gave birth in the past 12 months Now married:
100.0% (16)Unmarried:
0.0% (0)
Women who did not give birth in the past 12 months Now married:
82.1% (387)Unmarried:
17.9% (84)
Marital status - Other race population 15 years and over
Males 68.5% Never married23.8% Now married0.0% Separated0.0% Widowed7.7% DivorcedFemales 63.0% Never married31.2% Now married0.0% Separated0.0% Widowed5.8% DivorcedWomen who gave birth in the past 12 months Now married:
0.0% (0)Unmarried:
100.0% (65)
Women who did not give birth in the past 12 months Now married:
25.8% (34)Unmarried:
74.2% (99)
Marital status - Two or more races population 15 years and over
Males 21.7% Never married78.3% Now married0.0% Separated0.0% Widowed0.0% DivorcedFemales 26.2% Never married65.9% Now married0.0% Separated4.3% Widowed3.5% DivorcedWomen who did not give birth in the past 12 months Now married:
63.5% (384)Unmarried:
36.5% (220)
Marital status - White alone, not Hispanic / Latino population 15 years and over
Males 33.0% Never married59.9% Now married1.1% Separated1.5% Widowed4.5% DivorcedFemales 18.9% Never married62.4% Now married2.3% Separated5.9% Widowed10.5% DivorcedWomen who did not give birth in the past 12 months Now married:
62.2% (531)Unmarried:
37.8% (322)
Marital status - Hispanic or Latino population 15 years and over
Males 20.9% Never married78.0% Now married0.0% Separated0.0% Widowed1.1% DivorcedFemales 26.7% Never married50.1% Now married0.0% Separated2.0% Widowed21.1% DivorcedWomen who gave birth in the past 12 months Now married:
33.8% (25)Unmarried:
66.2% (49)
Women who did not give birth in the past 12 months Now married:
53.5% (327)Unmarried:
46.5% (284)
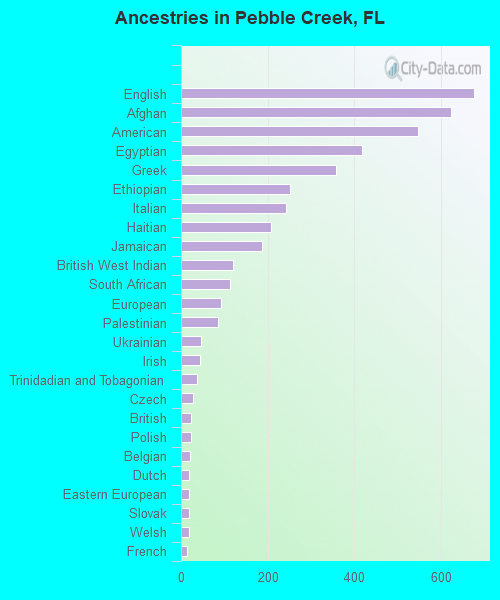
Ancestries in Pebble Creek
677 9.3% English622 8.5% Afghan547 7.5% American417 5.7% Egyptian357 4.9% Greek251 3.4% Ethiopian242 3.3% Italian207 2.8% Haitian186 2.5% Jamaican121 1.7% British West Indian113 1.5% South African93 1.3% European85 1.2% Palestinian46 0.6% Ukrainian45 0.6% Irish37 0.5% Trinidadian and Tobagonian27 0.4% Czech23 0.3% British23 0.3% Polish21 0.3% Belgian19 0.3% Dutch19 0.3% Eastern European18 0.2% Slovak18 0.2% Welsh15 0.2% French14 0.2% Portuguese13 0.2% Jordanian13 0.2% West Indian10 0.1% French Canadian10 0.1% Bahamian9 0.1% Celtic9 0.1% German7 0.10% Brazilian6 0.08% African
Geographical mobility in Pebble Creek Same house 1 year ago 4,085 84.1% White (Caucasian)1,212 75.3% Black or African American13 100.0% American Indian / Alaska Native1,511 96.6% Asian8 100.0% Native Hawaiian / Pacific Islander430 100.0% Other race2,749 88.1% Two or more races3,556 80.2% White alone, not Hispanic / Latino2,983 97.7% Hispanic or LatinoMoved within same county 278 5.7% White / Caucasian171 10.6% Black or African American60 3.9% Asian32 1.0% Two or more races325 7.3% White alone, not Hispanic / LatinoMoved within same state 214 4.4% White / Caucasian134 8.3% Black or African American15 0.9% Asian330 10.6% Two or more races248 5.6% White alone, not Hispanic / Latino27 0.9% Hispanic or LatinoMoved from different state 144 3.0% White / Caucasian8 0.5% Asian47 1.5% Two or more races155 3.5% White alone, not Hispanic / Latino17 0.6% Hispanic or LatinoMoved from abroad 74 1.5% White65 4.0% Black or African American93 2.1% White alone, not Hispanic / Latino69 2.3% Hispanic or Latino
Children Nativity (place of birth) in Pebble Creek
Children under 6 years - Living with two parents Both parents native 513 100.0% NativeBoth parents foreign-born 266 97.1% Native8 2.9% Foreign-bornOne native, one foreign-born parent 109 100.0% NativeChildren under 6 years - Living with one parent Native parent 157 100.0% NativeForeign-born parent 62 100.0% NativeChildren 6 to 17 years - Living with two parents Both parents native 531 100.0% NativeBoth parents foreign-born 549 93.8% Native36 6.2% Foreign-bornOne native, one foreign-born parent 589 100.0% NativeChildren 6 to 17 years - Living with one parent Native parent 310 100.0% NativeForeign-born parent 58 54.5% Native49 45.5% Foreign-born
Grandparents responsible for own grandchildren in Pebble Creek
Grandparents (30 to 59 years) White / Caucasian 57 63.0% Responsible for grandchildren33 37.0% Not responsible for grandchildrenBlack or African American 8 100.0% Responsible for grandchildrenTwo or more races 11 100.0% Responsible for grandchildrenWhite alone, not Hispanic / Latino 69 91.7% Responsible for grandchildren6 8.3% Not responsible for grandchildrenHispanic or Latino 14 36.5% Responsible for grandchildren25 63.5% Not responsible for grandchildren
Grandparents (60 years and over) White / Caucasian 121 100.0% Not responsible for grandchildrenTwo or more races 27 100.0% Not responsible for grandchildrenWhite alone, not Hispanic / Latino 108 100.0% Not responsible for grandchildrenHispanic or Latino 85 100.0% Not responsible for grandchildren