Races in Pearl, Mississippi (MS) Detailed Stats
Data:
Races - White alone (%)
Races - White alone (% change since 2000)
Races - Black alone (%)
Races - Black alone (% change since 2000)
Races - American Indian alone (%)
Races - American Indian alone (% change since 2000)
Races - Asian alone (%)
Races - Asian alone (% change since 2000)
Races - Hispanic (%)
Races - Hispanic (% change since 2000)
Races - Native Hawaiian and Other Pacific Islander alone (%)
Races - Native Hawaiian and Other Pacific Islander alone (% change since 2000)
Races - Two or more races(%)
Races - Two or more races(% change since 2000)
Races - Other race alone (%)
Races - Other race alone (% change since 2000)
Racial diversity
Place of birth - Born in state of residence (%)
Place of birth - Born in state of residence (%) - White
Place of birth - Born in state of residence (%) - Black or African American
Place of birth - Born in state of residence (%) - Asian
Place of birth - Born in state of residence (%) - Hispanic or Latino
Place of birth - Born in state of residence (%) - American Indian and Alaska Native
Place of birth - Born in state of residence (%) - Multirace
Place of birth - Born in state of residence (%) - Other Race
Place of birth - Born in other state (%)
Place of birth - Born in other state (%) - White
Place of birth - Born in other state (%) - Black or African American
Place of birth - Born in other state (%) - Asian
Place of birth - Born in other state (%) - Hispanic or Latino
Place of birth - Born in other state (%) - American Indian and Alaska Native
Place of birth - Born in other state (%) - Multirace
Place of birth - Born in other state (%) - Other Race
Place of birth - Native, outside of US (%)
Place of birth - Native, outside of US (%) - White
Place of birth - Native, outside of US (%) - Black or African American
Place of birth - Native, outside of US (%) - Asian
Place of birth - Native, outside of US (%) - Hispanic or Latino
Place of birth - Native, outside of US (%) - American Indian and Alaska Native
Place of birth - Native, outside of US (%) - Multirace
Place of birth - Native, outside of US (%) - Other Race
Place of birth - Foreign born (%)
Place of birth - Foreign born (%) - White
Place of birth - Foreign born (%) - Black or African American
Place of birth - Foreign born (%) - Asian
Place of birth - Foreign born (%) - Hispanic or Latino
Place of birth - Foreign born (%) - American Indian and Alaska Native
Place of birth - Foreign born (%) - Multirace
Place of birth - Foreign born (%) - Other Race
Residents speaking English at home (%)
Residents speaking English at home - Born in the United States (%)
Residents speaking English at home - Native, born elsewhere (%)
Residents speaking English at home - Foreign born (%)
Residents speaking Spanish at home (%)
Residents speaking Spanish at home - Born in the United States (%)
Residents speaking Spanish at home - Native, born elsewhere (%)
Residents speaking Spanish at home - Foreign born (%)
Residents speaking other language at home (%)
Residents speaking other language at home - Born in the United States (%)
Residents speaking other language at home - Native, born elsewhere (%)
Residents speaking other language at home - Foreign born (%)
Marital status - Never married (%)
Marital status - Now married (%)
Marital status - Separated (%)
Marital status - Widowed (%)
Marital status - Divorced (%)
Ancestries Reported - Arab (%)
Ancestries Reported - Czech (%)
Ancestries Reported - Danish (%)
Ancestries Reported - Dutch (%)
Ancestries Reported - English (%)
Ancestries Reported - French (%)
Ancestries Reported - French Canadian (%)
Ancestries Reported - German (%)
Ancestries Reported - Greek (%)
Ancestries Reported - Hungarian (%)
Ancestries Reported - Irish (%)
Ancestries Reported - Italian (%)
Ancestries Reported - Lithuanian (%)
Ancestries Reported - Norwegian (%)
Ancestries Reported - Polish (%)
Ancestries Reported - Portuguese (%)
Ancestries Reported - Russian (%)
Ancestries Reported - Scotch-Irish (%)
Ancestries Reported - Scottish (%)
Ancestries Reported - Slovak (%)
Ancestries Reported - Subsaharan African (%)
Ancestries Reported - Swedish (%)
Ancestries Reported - Swiss (%)
Ancestries Reported - Ukrainian (%)
Ancestries Reported - United States (%)
Ancestries Reported - Welsh (%)
Ancestries Reported - West Indian (%)
Ancestries Reported - Other (%)
Geographical mobility - Same house 1 year ago (%)
Geographical mobility - Same house 1 year ago (%) - White
Geographical mobility - Same house 1 year ago (%) - Black or African American
Geographical mobility - Same house 1 year ago (%) - Asian
Geographical mobility - Same house 1 year ago (%) - Hispanic or Latino
Geographical mobility - Same house 1 year ago (%) - American Indian and Alaska Native
Geographical mobility - Same house 1 year ago (%) - Multirace
Geographical mobility - Same house 1 year ago (%) - Other Race
Geographical mobility - Moved within same county (%)
Geographical mobility - Moved within same county (%) - White
Geographical mobility - Moved within same county (%) - Black or African American
Geographical mobility - Moved within same county (%) - Asian
Geographical mobility - Moved within same county (%) - Hispanic or Latino
Geographical mobility - Moved within same county (%) - American Indian and Alaska Native
Geographical mobility - Moved within same county (%) - Multirace
Geographical mobility - Moved within same county (%) - Other Race
Geographical mobility - Moved from different county within same state (%)
Geographical mobility - Moved from different county within same state (%) - White
Geographical mobility - Moved from different county within same state (%) - Black or African American
Geographical mobility - Moved from different county within same state (%) - Asian
Geographical mobility - Moved from different county within same state (%) - Hispanic or Latino
Geographical mobility - Moved from different county within same state (%) - American Indian and Alaska Native
Geographical mobility - Moved from different county within same state (%) - Multirace
Geographical mobility - Moved from different county within same state (%) - Other Race
Geographical mobility - Moved from different state (%)
Geographical mobility - Moved from different state (%) - White
Geographical mobility - Moved from different state (%) - Black or African American
Geographical mobility - Moved from different state (%) - Asian
Geographical mobility - Moved from different state (%) - Hispanic or Latino
Geographical mobility - Moved from different state (%) - American Indian and Alaska Native
Geographical mobility - Moved from different state (%) - Multirace
Geographical mobility - Moved from different state (%) - Other Race
Geographical mobility - Moved from abroad (%)
Geographical mobility - Moved from abroad (%) - White
Geographical mobility - Moved from abroad (%) - Black or African American
Geographical mobility - Moved from abroad (%) - Asian
Geographical mobility - Moved from abroad (%) - Hispanic or Latino
Geographical mobility - Moved from abroad (%) - American Indian and Alaska Native
Geographical mobility - Moved from abroad (%) - Multirace
Geographical mobility - Moved from abroad (%) - Other Race
Place of birth for the foreign-born population - Ireland (%)
Place of birth for the foreign-born population - Denmark (%)
Place of birth for the foreign-born population - Norway (%)
Place of birth for the foreign-born population - Sweden (%)
Place of birth for the foreign-born population - United Kingdom (%)
Place of birth for the foreign-born population - England (%)
Place of birth for the foreign-born population - Scotland (%)
Place of birth for the foreign-born population - Other Northern Europe (%)
Place of birth for the foreign-born population - Austria (%)
Place of birth for the foreign-born population - Belgium (%)
Place of birth for the foreign-born population - France (%)
Place of birth for the foreign-born population - Germany (%)
Place of birth for the foreign-born population - Netherlands (%)
Place of birth for the foreign-born population - Switzerland (%)
Place of birth for the foreign-born population - Other Western Europe (%)
Place of birth for the foreign-born population - Greece (%)
Place of birth for the foreign-born population - Italy (%)
Place of birth for the foreign-born population - Portugal (%)
Place of birth for the foreign-born population - Spain (%)
Place of birth for the foreign-born population - Other Southern Europe (%)
Place of birth for the foreign-born population - Albania (%)
Place of birth for the foreign-born population - Belarus (%)
Place of birth for the foreign-born population - Bosnia and Herzegovina (%)
Place of birth for the foreign-born population - Bulgaria (%)
Place of birth for the foreign-born population - Croatia (%)
Place of birth for the foreign-born population - Czechoslovakia (%)
Place of birth for the foreign-born population - Hungary (%)
Place of birth for the foreign-born population - Latvia (%)
Place of birth for the foreign-born population - Lithuania (%)
Place of birth for the foreign-born population - North Macedonia (Macedonia) (%)
Place of birth for the foreign-born population - Moldova (%)
Place of birth for the foreign-born population - Poland (%)
Place of birth for the foreign-born population - Romania (%)
Place of birth for the foreign-born population - Russia (%)
Place of birth for the foreign-born population - Serbia (%)
Place of birth for the foreign-born population - Ukraine (%)
Place of birth for the foreign-born population - Other Eastern Europe (%)
Place of birth for the foreign-born population - China (%)
Place of birth for the foreign-born population - Hong Kong (%)
Place of birth for the foreign-born population - Taiwan (%)
Place of birth for the foreign-born population - Japan (%)
Place of birth for the foreign-born population - Korea (%)
Place of birth for the foreign-born population - Other Eastern Asia (%)
Place of birth for the foreign-born population - Afghanistan (%)
Place of birth for the foreign-born population - Bangladesh (%)
Place of birth for the foreign-born population - India (%)
Place of birth for the foreign-born population - Iran (%)
Place of birth for the foreign-born population - Kazakhstan (%)
Place of birth for the foreign-born population - Nepal (%)
Place of birth for the foreign-born population - Pakistan (%)
Place of birth for the foreign-born population - Sri Lanka (%)
Place of birth for the foreign-born population - Uzbekistan (%)
Place of birth for the foreign-born population - Other South Central Asia (%)
Place of birth for the foreign-born population - Burma (%)
Place of birth for the foreign-born population - Cambodia (%)
Place of birth for the foreign-born population - Indonesia (%)
Place of birth for the foreign-born population - Laos (%)
Place of birth for the foreign-born population - Malaysia (%)
Place of birth for the foreign-born population - Philippines (%)
Place of birth for the foreign-born population - Singapore (%)
Place of birth for the foreign-born population - Thailand (%)
Place of birth for the foreign-born population - Vietnam (%)
Place of birth for the foreign-born population - Other South Eastern Asia (%)
Place of birth for the foreign-born population - Armenia (%)
Place of birth for the foreign-born population - Iraq (%)
Place of birth for the foreign-born population - Israel (%)
Place of birth for the foreign-born population - Jordan (%)
Place of birth for the foreign-born population - Kuwait (%)
Place of birth for the foreign-born population - Lebanon (%)
Place of birth for the foreign-born population - Saudi Arabia (%)
Place of birth for the foreign-born population - Syria (%)
Place of birth for the foreign-born population - Turkey (%)
Place of birth for the foreign-born population - Yemen (%)
Place of birth for the foreign-born population - Other Western Asia (%)
Place of birth for the foreign-born population - Eritrea (%)
Place of birth for the foreign-born population - Ethiopia (%)
Place of birth for the foreign-born population - Kenya (%)
Place of birth for the foreign-born population - Somalia (%)
Place of birth for the foreign-born population - Uganda (%)
Place of birth for the foreign-born population - Zimbabwe (%)
Place of birth for the foreign-born population - Other Eastern Africa (%)
Place of birth for the foreign-born population - Cameroon (%)
Place of birth for the foreign-born population - Congo (%)
Place of birth for the foreign-born population - Democratic Republic of Congo (Zaire) (%)
Place of birth for the foreign-born population - Other Middle Africa (%)
Place of birth for the foreign-born population - Egypt (%)
Place of birth for the foreign-born population - Morocco (%)
Place of birth for the foreign-born population - Sudan (%)
Place of birth for the foreign-born population - Other Northern Africa (%)
Place of birth for the foreign-born population - South Africa (%)
Place of birth for the foreign-born population - Other Southern Africa (%)
Place of birth for the foreign-born population - Cabo Verde (%)
Place of birth for the foreign-born population - Ghana (%)
Place of birth for the foreign-born population - Liberia (%)
Place of birth for the foreign-born population - Nigeria (%)
Place of birth for the foreign-born population - Senegal (%)
Place of birth for the foreign-born population - Sierra Leone (%)
Place of birth for the foreign-born population - Other Western Africa (%)
Place of birth for the foreign-born population - Australia (%)
Place of birth for the foreign-born population - New Zealand (%)
Place of birth for the foreign-born population - Fiji (%)
Place of birth for the foreign-born population - Micronesia (%)
Place of birth for the foreign-born population - Bahamas (%)
Place of birth for the foreign-born population - Barbados (%)
Place of birth for the foreign-born population - Cuba (%)
Place of birth for the foreign-born population - Dominica (%)
Place of birth for the foreign-born population - Dominican Republic (%)
Place of birth for the foreign-born population - Grenada (%)
Place of birth for the foreign-born population - Haiti (%)
Place of birth for the foreign-born population - Jamaica (%)
Place of birth for the foreign-born population - St. Vincent and the Grenadines (%)
Place of birth for the foreign-born population - Trinidad and Tobago (%)
Place of birth for the foreign-born population - West Indies (%)
Place of birth for the foreign-born population - Other Caribbean (%)
Place of birth for the foreign-born population - Belize (%)
Place of birth for the foreign-born population - Costa Rica (%)
Place of birth for the foreign-born population - El Salvador (%)
Place of birth for the foreign-born population - Guatemala (%)
Place of birth for the foreign-born population - Honduras (%)
Place of birth for the foreign-born population - Mexico (%)
Place of birth for the foreign-born population - Nicaragua (%)
Place of birth for the foreign-born population - Panama (%)
Place of birth for the foreign-born population - Other Central America (%)
Place of birth for the foreign-born population - Argentina (%)
Place of birth for the foreign-born population - Bolivia (%)
Place of birth for the foreign-born population - Brazil (%)
Place of birth for the foreign-born population - Chile (%)
Place of birth for the foreign-born population - Colombia (%)
Place of birth for the foreign-born population - Ecuador (%)
Place of birth for the foreign-born population - Guyana (%)
Place of birth for the foreign-born population - Peru (%)
Place of birth for the foreign-born population - Uruguay (%)
Place of birth for the foreign-born population - Venezuela (%)
Place of birth for the foreign-born population - Other South America (%)
Place of birth for the foreign-born population - Canada (%)
Place of birth for the foreign-born population - Other Northern America (%)
Place of birth for the foreign-born population - Other (%)
Latest news about races in Pearl, MS collected exclusively by city-data.com from local newspapers, TV, and radio stations
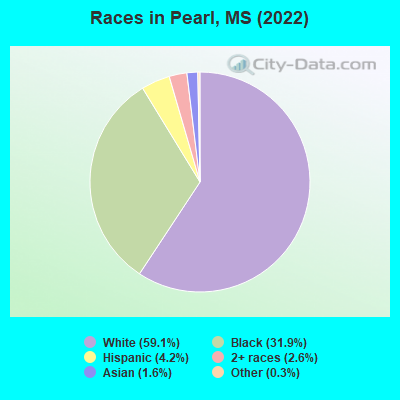
According to 2022 data, the most numerous races in Pearl, MS are White alone (15,996 residents), Black alone (8,644 residents), and Hispanic (1,146 residents). 94.0% of Pearl residents speak English at home. 2.8% of Pearl, MS residents are foreign-born (1.2% born in Latin America, 1.0% born in Asia, 0.4% born in Africa), which is 29.6% greater than the foreign-born rate of 2.0% across the entire state of Mississippi.
Race distribution in Pearl
2000 2022
1,727,908 60.7% White alone 1,028,473 36.2% Black alone 39,569 1.4% Hispanic 17,272 0.6% Two or more races 18,349 0.6% Asian alone 11,224 0.4% American Indian alone 1,294 0.05% Other race alone 569 0.02% Native Hawaiian and Other
1,625,979 55.3% White alone 1,072,962 36.5% Black alone 97,177 3.3% Hispanic 96,367 3.3% Two or more races 25,217 0.9% Asian alone 12,457 0.4% American Indian alone 9,501 0.3% Other race alone 397 0.01% Native Hawaiian and Other
Income and house value in Pearl Median household income in 2022 $57,609 White non-Hispanic householders$43,922 Black householders$76,906 Some other race householders$103,087 Hispanic or Latino race householdersMedian 2022 house value $181,940 White Non-Hispanic householders$145,303 Black or African American householders$112,155 American Indian or Alaska Native householders $407,248 Asian householders$280,388 Two or more races householders$467,314 Hispanic or Latino householders
Median age by race in Pearl
40.8 Median age for White residents41.2 40.6 35.2 Median age for Black or African American residents28.2 38.2 -1,336,553,943.9 Median age for American Indian / Alaska Native residents-751,111,110.4 -710,601,718.5 30.3 Median age for Asian residents20.1 42.6 -666,666,666.0 Median age for Native Hawaiian / Pacific Islander residents-666,666,666.0 -666,666,666.0 19.8 Median age for Other race residents22.9 24.6 11.9 Median age for Two or more races residents10.0 10.9 40.7 Median age for White alone residents41.3 40.6 18.8 Median age for Hispanic or Latino residents24.9 20.1
Owner/renter occupied households by race in Pearl
House owners and renters - White residents 4,851 70.8% Owner occupied2,000 29.2% Renter occupiedHouse owners and renters - Black or African American residents 1,548 42.8% Owner occupied2,067 57.2% Renter occupiedHouse owners and renters - Asian residents 81 60.2% Owner occupied53 39.8% Renter occupiedHouse owners and renters - Other race residents 55 47.1% Owner occupied61 52.9% Renter occupiedHouse owners and renters - Two or more races residents 137 46.0% Owner occupied161 54.0% Renter occupiedHouse owners and renters - White alone residents 4,866 70.6% Owner occupied2,028 29.4% Renter occupiedHouse owners and renters - Hispanic or Latino residents 47 19.1% Owner occupied197 80.9% Renter occupied
Language usage in Pearl
English speakers - Total 94.0% of residents of Pearl speak English at home.
3.4% of residents speak Spanish at home 687 76.8% Speak English very well207 23.2% Speak English less than very well2.7% of residents speak other language at home 338 48.7% Speak English very well356 51.3% Speak English less than very well
English speakers - Born in the United States 91.7% of residents of Pearl speak English at home.
6.3% of residents speak Spanish at home 262 75.5% Speak English very well85 24.5% Speak English less than very well4.1% of residents speak other language at home 173 76.2% Speak English very well54 23.8% Speak English less than very well
English speakers - Native, born elsewhere 47.1% of residents of Pearl speak English at home.
86.5% of residents speak Spanish at home 90 100.0% Speak English very well
English speakers - Foreign-born 13.9% of residents of Pearl speak English at home.
45.9% of residents speak Spanish at home 57 17.1% Speak English very well277 82.9% Speak English less than very well65.2% of residents speak other language at home 239 50.4% Speak English very well235 49.6% Speak English less than very well
White (Caucasian) - Speak only English Native:
98.6% (15,027)Foreign-born:
85.5% (40)
White (Caucasian) - Speak another language Native:
1.4% (206)Foreign-born:
27.2% (13)
Black or African American - Speak only English Native:
98.5% (8,031)Foreign-born:
41.3% (26)
Black or African American - Speak another language Native:
1.5% (125)Foreign-born:
58.6% (37)
Asian - Speak only English Native:
49.5% (61)Foreign-born:
12.9% (50)
Asian - Speak another language Native:
48.4% (60)Foreign-born:
88.6% (341)
Other race - Speak another language Native:
77.7% (578)Foreign-born:
100.0% (184)
Two or more races - Speak only English Native:
95.4% (894)Foreign-born:
10.6% (21)
Two or more races - Speak another language Native:
6.7% (62)Foreign-born:
100.0% (194)
White alone - Speak only English Native:
98.4% (15,018)Foreign-born:
64.8% (42)
White alone - Speak another language Native:
1.7% (259)Foreign-born:
32.6% (21)
Hispanic or Latino - Speak only English Native:
58.4% (439)Foreign-born:
7.2% (19)
Hispanic or Latino - Speak another language Native:
44.9% (338)Foreign-born:
96.1% (252)
Foreign-born residents in Pearl 783 residents are foreign born (1.2% Latin America , 1.0% Asia , 0.4% Africa ).
This city:
2.8%Mississippi:
2.3%
Marital status for residents in Pearl Marital status - White (Caucasian) population 15 years and over
Males 25.9% Never married51.1% Now married1.3% Separated6.8% Widowed14.8% DivorcedFemales 17.9% Never married45.9% Now married1.9% Separated10.7% Widowed23.7% DivorcedWomen who gave birth in the past 12 months Now married:
65.3% (123)Unmarried:
34.7% (65)
Women who did not give birth in the past 12 months Now married:
50.7% (1,868)Unmarried:
49.3% (1,813)
Marital status - Black or African American population 15 years and over
Males 50.0% Never married40.9% Now married2.0% Separated0.9% Widowed6.2% DivorcedFemales 44.2% Never married33.8% Now married4.5% Separated5.2% Widowed12.3% DivorcedWomen who gave birth in the past 12 months Now married:
100.0% (149)Unmarried:
0.0% (0)
Women who did not give birth in the past 12 months Now married:
29.2% (793)Unmarried:
70.8% (1,921)
Marital status - Asian population 15 years and over
Males 47.6% Never married41.8% Now married0.0% Separated0.0% Widowed10.6% DivorcedFemales 20.1% Never married61.0% Now married0.0% Separated18.9% Widowed0.0% DivorcedWomen who did not give birth in the past 12 months Now married:
62.4% (45)Unmarried:
37.6% (27)
Marital status - Other race population 15 years and over
Males 15.3% Never married84.2% Now married0.0% Separated0.5% Widowed0.0% DivorcedFemales 50.5% Never married49.5% Now married0.0% Separated0.0% Widowed0.0% DivorcedWomen who did not give birth in the past 12 months Now married:
25.3% (105)Unmarried:
74.7% (310)
Marital status - Two or more races population 15 years and over
Males 43.9% Never married36.6% Now married0.0% Separated0.0% Widowed19.5% DivorcedFemales 52.5% Never married39.6% Now married0.0% Separated0.0% Widowed7.8% DivorcedWomen who gave birth in the past 12 months Now married:
100.0% (25)Unmarried:
0.0% (0)
Women who did not give birth in the past 12 months Now married:
38.6% (137)Unmarried:
61.4% (219)
Marital status - White alone, not Hispanic / Latino population 15 years and over
Males 26.0% Never married51.0% Now married1.3% Separated6.9% Widowed14.8% DivorcedFemales 17.8% Never married46.0% Now married1.9% Separated10.7% Widowed23.6% DivorcedWomen who gave birth in the past 12 months Now married:
65.3% (124)Unmarried:
34.7% (66)
Women who did not give birth in the past 12 months Now married:
50.9% (1,885)Unmarried:
49.1% (1,821)
Marital status - Hispanic or Latino population 15 years and over
Males 17.9% Never married72.2% Now married0.0% Separated0.4% Widowed9.5% DivorcedFemales 45.8% Never married52.7% Now married0.0% Separated0.0% Widowed1.5% DivorcedWomen who gave birth in the past 12 months Now married:
100.0% (16)Unmarried:
0.0% (0)
Women who did not give birth in the past 12 months Now married:
34.5% (141)Unmarried:
65.5% (268)
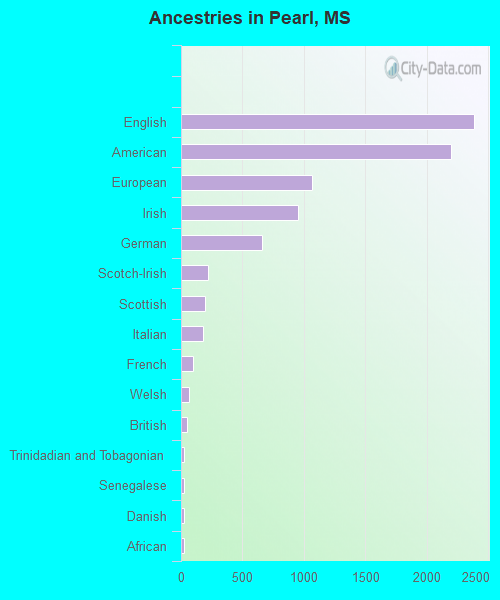
Ancestries in Pearl
2,387 13.4% English2,197 12.3% American1,068 6.0% European950 5.3% Irish662 3.7% German219 1.2% Scotch-Irish196 1.1% Scottish175 1.0% Italian101 0.6% French68 0.4% Welsh50 0.3% British28 0.2% Trinidadian and Tobagonian27 0.2% Senegalese24 0.1% Danish23 0.1% African18 0.1% Norwegian9 0.05% Lebanese
Geographical mobility in Pearl Same house 1 year ago 14,405 90.0% White (Caucasian)7,254 81.4% Black or African American380 88.8% Asian980 100.0% Other race1,000 76.6% Two or more races14,444 89.9% White alone, not Hispanic / Latino1,078 98.5% Hispanic or LatinoMoved within same county 804 5.0% White / Caucasian586 6.6% Black or African American27 6.2% Asian3 0.3% Other race85 6.5% Two or more races806 5.0% White alone, not Hispanic / Latino2 0.2% Hispanic or LatinoMoved within same state 372 2.3% White / Caucasian1,179 13.2% Black or African American373 2.3% White alone, not Hispanic / LatinoMoved from different state 222 1.4% White / Caucasian51 0.6% Black or African American1 0.2% Asian226 1.4% White alone, not Hispanic / LatinoMoved from abroad 225 1.4% White124 0.8% White alone, not Hispanic / Latino
Children Nativity (place of birth) in Pearl
Children under 6 years - Living with two parents Both parents native 992 100.0% NativeBoth parents foreign-born 80 100.0% NativeOne native, one foreign-born parent 39 100.0% NativeChildren under 6 years - Living with one parent Native parent 624 100.0% NativeForeign-born parent 74 100.0% NativeChildren 6 to 17 years - Living with two parents Both parents native 2,074 100.0% NativeBoth parents foreign-born 49 87.3% Native7 12.7% Foreign-bornOne native, one foreign-born parent 136 100.0% NativeChildren 6 to 17 years - Living with one parent Native parent 1,572 100.0% NativeForeign-born parent 17 46.3% Native20 53.7% Foreign-born
Grandparents responsible for own grandchildren in Pearl
Grandparents (30 to 59 years) White / Caucasian 85 45.2% Responsible for grandchildren104 54.8% Not responsible for grandchildrenBlack or African American 77 89.7% Responsible for grandchildren9 10.3% Not responsible for grandchildrenOther race 117 100.0% Not responsible for grandchildrenTwo or more races 18 100.0% Not responsible for grandchildrenWhite alone, not Hispanic / Latino 86 45.4% Responsible for grandchildren104 54.6% Not responsible for grandchildrenHispanic or Latino 116 100.0% Not responsible for grandchildrenGrandparents (60 years and over) White / Caucasian 45 20.4% Responsible for grandchildren175 79.6% Not responsible for grandchildrenBlack or African American 26 70.3% Responsible for grandchildren11 29.7% Not responsible for grandchildrenOther race 79 100.0% Not responsible for grandchildrenWhite alone, not Hispanic / Latino 45 20.4% Responsible for grandchildren176 79.6% Not responsible for grandchildrenHispanic or Latino 91 100.0% Not responsible for grandchildren