Races in Pasadena, Maryland (MD) Detailed Stats
Data:
Races - White alone (%)
Races - White alone (% change since 2000)
Races - Black alone (%)
Races - Black alone (% change since 2000)
Races - American Indian alone (%)
Races - American Indian alone (% change since 2000)
Races - Asian alone (%)
Races - Asian alone (% change since 2000)
Races - Hispanic (%)
Races - Hispanic (% change since 2000)
Races - Native Hawaiian and Other Pacific Islander alone (%)
Races - Native Hawaiian and Other Pacific Islander alone (% change since 2000)
Races - Two or more races(%)
Races - Two or more races(% change since 2000)
Races - Other race alone (%)
Races - Other race alone (% change since 2000)
Racial diversity
Place of birth - Born in state of residence (%)
Place of birth - Born in state of residence (%) - White
Place of birth - Born in state of residence (%) - Black or African American
Place of birth - Born in state of residence (%) - Asian
Place of birth - Born in state of residence (%) - Hispanic or Latino
Place of birth - Born in state of residence (%) - American Indian and Alaska Native
Place of birth - Born in state of residence (%) - Multirace
Place of birth - Born in state of residence (%) - Other Race
Place of birth - Born in other state (%)
Place of birth - Born in other state (%) - White
Place of birth - Born in other state (%) - Black or African American
Place of birth - Born in other state (%) - Asian
Place of birth - Born in other state (%) - Hispanic or Latino
Place of birth - Born in other state (%) - American Indian and Alaska Native
Place of birth - Born in other state (%) - Multirace
Place of birth - Born in other state (%) - Other Race
Place of birth - Native, outside of US (%)
Place of birth - Native, outside of US (%) - White
Place of birth - Native, outside of US (%) - Black or African American
Place of birth - Native, outside of US (%) - Asian
Place of birth - Native, outside of US (%) - Hispanic or Latino
Place of birth - Native, outside of US (%) - American Indian and Alaska Native
Place of birth - Native, outside of US (%) - Multirace
Place of birth - Native, outside of US (%) - Other Race
Place of birth - Foreign born (%)
Place of birth - Foreign born (%) - White
Place of birth - Foreign born (%) - Black or African American
Place of birth - Foreign born (%) - Asian
Place of birth - Foreign born (%) - Hispanic or Latino
Place of birth - Foreign born (%) - American Indian and Alaska Native
Place of birth - Foreign born (%) - Multirace
Place of birth - Foreign born (%) - Other Race
Residents speaking English at home (%)
Residents speaking English at home - Born in the United States (%)
Residents speaking English at home - Native, born elsewhere (%)
Residents speaking English at home - Foreign born (%)
Residents speaking Spanish at home (%)
Residents speaking Spanish at home - Born in the United States (%)
Residents speaking Spanish at home - Native, born elsewhere (%)
Residents speaking Spanish at home - Foreign born (%)
Residents speaking other language at home (%)
Residents speaking other language at home - Born in the United States (%)
Residents speaking other language at home - Native, born elsewhere (%)
Residents speaking other language at home - Foreign born (%)
Marital status - Never married (%)
Marital status - Now married (%)
Marital status - Separated (%)
Marital status - Widowed (%)
Marital status - Divorced (%)
Ancestries Reported - Arab (%)
Ancestries Reported - Czech (%)
Ancestries Reported - Danish (%)
Ancestries Reported - Dutch (%)
Ancestries Reported - English (%)
Ancestries Reported - French (%)
Ancestries Reported - French Canadian (%)
Ancestries Reported - German (%)
Ancestries Reported - Greek (%)
Ancestries Reported - Hungarian (%)
Ancestries Reported - Irish (%)
Ancestries Reported - Italian (%)
Ancestries Reported - Lithuanian (%)
Ancestries Reported - Norwegian (%)
Ancestries Reported - Polish (%)
Ancestries Reported - Portuguese (%)
Ancestries Reported - Russian (%)
Ancestries Reported - Scotch-Irish (%)
Ancestries Reported - Scottish (%)
Ancestries Reported - Slovak (%)
Ancestries Reported - Subsaharan African (%)
Ancestries Reported - Swedish (%)
Ancestries Reported - Swiss (%)
Ancestries Reported - Ukrainian (%)
Ancestries Reported - United States (%)
Ancestries Reported - Welsh (%)
Ancestries Reported - West Indian (%)
Ancestries Reported - Other (%)
Geographical mobility - Same house 1 year ago (%)
Geographical mobility - Same house 1 year ago (%) - White
Geographical mobility - Same house 1 year ago (%) - Black or African American
Geographical mobility - Same house 1 year ago (%) - Asian
Geographical mobility - Same house 1 year ago (%) - Hispanic or Latino
Geographical mobility - Same house 1 year ago (%) - American Indian and Alaska Native
Geographical mobility - Same house 1 year ago (%) - Multirace
Geographical mobility - Same house 1 year ago (%) - Other Race
Geographical mobility - Moved within same county (%)
Geographical mobility - Moved within same county (%) - White
Geographical mobility - Moved within same county (%) - Black or African American
Geographical mobility - Moved within same county (%) - Asian
Geographical mobility - Moved within same county (%) - Hispanic or Latino
Geographical mobility - Moved within same county (%) - American Indian and Alaska Native
Geographical mobility - Moved within same county (%) - Multirace
Geographical mobility - Moved within same county (%) - Other Race
Geographical mobility - Moved from different county within same state (%)
Geographical mobility - Moved from different county within same state (%) - White
Geographical mobility - Moved from different county within same state (%) - Black or African American
Geographical mobility - Moved from different county within same state (%) - Asian
Geographical mobility - Moved from different county within same state (%) - Hispanic or Latino
Geographical mobility - Moved from different county within same state (%) - American Indian and Alaska Native
Geographical mobility - Moved from different county within same state (%) - Multirace
Geographical mobility - Moved from different county within same state (%) - Other Race
Geographical mobility - Moved from different state (%)
Geographical mobility - Moved from different state (%) - White
Geographical mobility - Moved from different state (%) - Black or African American
Geographical mobility - Moved from different state (%) - Asian
Geographical mobility - Moved from different state (%) - Hispanic or Latino
Geographical mobility - Moved from different state (%) - American Indian and Alaska Native
Geographical mobility - Moved from different state (%) - Multirace
Geographical mobility - Moved from different state (%) - Other Race
Geographical mobility - Moved from abroad (%)
Geographical mobility - Moved from abroad (%) - White
Geographical mobility - Moved from abroad (%) - Black or African American
Geographical mobility - Moved from abroad (%) - Asian
Geographical mobility - Moved from abroad (%) - Hispanic or Latino
Geographical mobility - Moved from abroad (%) - American Indian and Alaska Native
Geographical mobility - Moved from abroad (%) - Multirace
Geographical mobility - Moved from abroad (%) - Other Race
Place of birth for the foreign-born population - Ireland (%)
Place of birth for the foreign-born population - Denmark (%)
Place of birth for the foreign-born population - Norway (%)
Place of birth for the foreign-born population - Sweden (%)
Place of birth for the foreign-born population - United Kingdom (%)
Place of birth for the foreign-born population - England (%)
Place of birth for the foreign-born population - Scotland (%)
Place of birth for the foreign-born population - Other Northern Europe (%)
Place of birth for the foreign-born population - Austria (%)
Place of birth for the foreign-born population - Belgium (%)
Place of birth for the foreign-born population - France (%)
Place of birth for the foreign-born population - Germany (%)
Place of birth for the foreign-born population - Netherlands (%)
Place of birth for the foreign-born population - Switzerland (%)
Place of birth for the foreign-born population - Other Western Europe (%)
Place of birth for the foreign-born population - Greece (%)
Place of birth for the foreign-born population - Italy (%)
Place of birth for the foreign-born population - Portugal (%)
Place of birth for the foreign-born population - Spain (%)
Place of birth for the foreign-born population - Other Southern Europe (%)
Place of birth for the foreign-born population - Albania (%)
Place of birth for the foreign-born population - Belarus (%)
Place of birth for the foreign-born population - Bosnia and Herzegovina (%)
Place of birth for the foreign-born population - Bulgaria (%)
Place of birth for the foreign-born population - Croatia (%)
Place of birth for the foreign-born population - Czechoslovakia (%)
Place of birth for the foreign-born population - Hungary (%)
Place of birth for the foreign-born population - Latvia (%)
Place of birth for the foreign-born population - Lithuania (%)
Place of birth for the foreign-born population - North Macedonia (Macedonia) (%)
Place of birth for the foreign-born population - Moldova (%)
Place of birth for the foreign-born population - Poland (%)
Place of birth for the foreign-born population - Romania (%)
Place of birth for the foreign-born population - Russia (%)
Place of birth for the foreign-born population - Serbia (%)
Place of birth for the foreign-born population - Ukraine (%)
Place of birth for the foreign-born population - Other Eastern Europe (%)
Place of birth for the foreign-born population - China (%)
Place of birth for the foreign-born population - Hong Kong (%)
Place of birth for the foreign-born population - Taiwan (%)
Place of birth for the foreign-born population - Japan (%)
Place of birth for the foreign-born population - Korea (%)
Place of birth for the foreign-born population - Other Eastern Asia (%)
Place of birth for the foreign-born population - Afghanistan (%)
Place of birth for the foreign-born population - Bangladesh (%)
Place of birth for the foreign-born population - India (%)
Place of birth for the foreign-born population - Iran (%)
Place of birth for the foreign-born population - Kazakhstan (%)
Place of birth for the foreign-born population - Nepal (%)
Place of birth for the foreign-born population - Pakistan (%)
Place of birth for the foreign-born population - Sri Lanka (%)
Place of birth for the foreign-born population - Uzbekistan (%)
Place of birth for the foreign-born population - Other South Central Asia (%)
Place of birth for the foreign-born population - Burma (%)
Place of birth for the foreign-born population - Cambodia (%)
Place of birth for the foreign-born population - Indonesia (%)
Place of birth for the foreign-born population - Laos (%)
Place of birth for the foreign-born population - Malaysia (%)
Place of birth for the foreign-born population - Philippines (%)
Place of birth for the foreign-born population - Singapore (%)
Place of birth for the foreign-born population - Thailand (%)
Place of birth for the foreign-born population - Vietnam (%)
Place of birth for the foreign-born population - Other South Eastern Asia (%)
Place of birth for the foreign-born population - Armenia (%)
Place of birth for the foreign-born population - Iraq (%)
Place of birth for the foreign-born population - Israel (%)
Place of birth for the foreign-born population - Jordan (%)
Place of birth for the foreign-born population - Kuwait (%)
Place of birth for the foreign-born population - Lebanon (%)
Place of birth for the foreign-born population - Saudi Arabia (%)
Place of birth for the foreign-born population - Syria (%)
Place of birth for the foreign-born population - Turkey (%)
Place of birth for the foreign-born population - Yemen (%)
Place of birth for the foreign-born population - Other Western Asia (%)
Place of birth for the foreign-born population - Eritrea (%)
Place of birth for the foreign-born population - Ethiopia (%)
Place of birth for the foreign-born population - Kenya (%)
Place of birth for the foreign-born population - Somalia (%)
Place of birth for the foreign-born population - Uganda (%)
Place of birth for the foreign-born population - Zimbabwe (%)
Place of birth for the foreign-born population - Other Eastern Africa (%)
Place of birth for the foreign-born population - Cameroon (%)
Place of birth for the foreign-born population - Congo (%)
Place of birth for the foreign-born population - Democratic Republic of Congo (Zaire) (%)
Place of birth for the foreign-born population - Other Middle Africa (%)
Place of birth for the foreign-born population - Egypt (%)
Place of birth for the foreign-born population - Morocco (%)
Place of birth for the foreign-born population - Sudan (%)
Place of birth for the foreign-born population - Other Northern Africa (%)
Place of birth for the foreign-born population - South Africa (%)
Place of birth for the foreign-born population - Other Southern Africa (%)
Place of birth for the foreign-born population - Cabo Verde (%)
Place of birth for the foreign-born population - Ghana (%)
Place of birth for the foreign-born population - Liberia (%)
Place of birth for the foreign-born population - Nigeria (%)
Place of birth for the foreign-born population - Senegal (%)
Place of birth for the foreign-born population - Sierra Leone (%)
Place of birth for the foreign-born population - Other Western Africa (%)
Place of birth for the foreign-born population - Australia (%)
Place of birth for the foreign-born population - New Zealand (%)
Place of birth for the foreign-born population - Fiji (%)
Place of birth for the foreign-born population - Micronesia (%)
Place of birth for the foreign-born population - Bahamas (%)
Place of birth for the foreign-born population - Barbados (%)
Place of birth for the foreign-born population - Cuba (%)
Place of birth for the foreign-born population - Dominica (%)
Place of birth for the foreign-born population - Dominican Republic (%)
Place of birth for the foreign-born population - Grenada (%)
Place of birth for the foreign-born population - Haiti (%)
Place of birth for the foreign-born population - Jamaica (%)
Place of birth for the foreign-born population - St. Vincent and the Grenadines (%)
Place of birth for the foreign-born population - Trinidad and Tobago (%)
Place of birth for the foreign-born population - West Indies (%)
Place of birth for the foreign-born population - Other Caribbean (%)
Place of birth for the foreign-born population - Belize (%)
Place of birth for the foreign-born population - Costa Rica (%)
Place of birth for the foreign-born population - El Salvador (%)
Place of birth for the foreign-born population - Guatemala (%)
Place of birth for the foreign-born population - Honduras (%)
Place of birth for the foreign-born population - Mexico (%)
Place of birth for the foreign-born population - Nicaragua (%)
Place of birth for the foreign-born population - Panama (%)
Place of birth for the foreign-born population - Other Central America (%)
Place of birth for the foreign-born population - Argentina (%)
Place of birth for the foreign-born population - Bolivia (%)
Place of birth for the foreign-born population - Brazil (%)
Place of birth for the foreign-born population - Chile (%)
Place of birth for the foreign-born population - Colombia (%)
Place of birth for the foreign-born population - Ecuador (%)
Place of birth for the foreign-born population - Guyana (%)
Place of birth for the foreign-born population - Peru (%)
Place of birth for the foreign-born population - Uruguay (%)
Place of birth for the foreign-born population - Venezuela (%)
Place of birth for the foreign-born population - Other South America (%)
Place of birth for the foreign-born population - Canada (%)
Place of birth for the foreign-born population - Other Northern America (%)
Place of birth for the foreign-born population - Other (%)
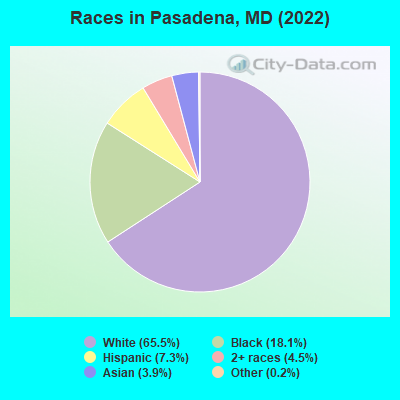
According to 2022 data, the most numerous races in Pasadena, MD are White alone (21,258 residents), Black alone (5,876 residents), and Hispanic (2,370 residents). 89.8% of Pasadena residents speak English at home. 6.5% of Pasadena, MD residents are foreign-born (2.9% born in Asia, 1.9% born in Latin America, 0.8% born in Europe), which is 145.8% less than the foreign-born rate of 16.0% across the entire state of Maryland.
Race distribution in Pasadena
2000 2022
3,286,547 62.1% White alone 1,464,735 27.7% Black alone 227,916 4.3% Hispanic 209,738 4.0% Asian alone 82,946 1.6% Two or more races 13,312 0.3% American Indian alone 9,379 0.2% Other race alone 1,913 0.04% Native Hawaiian and Other
2,906,492 47.1% White alone 1,800,914 29.2% Black alone 705,842 11.4% Hispanic 401,818 6.5% Asian alone 291,317 4.7% Two or more races 46,930 0.8% Other race alone 8,930 0.1% American Indian alone 2,417 0.04% Native Hawaiian and Other
Income and house value in Pasadena Median household income in 2022 $116,581 White non-Hispanic householders$97,090 Black householders$148,152 Asian householders$122,253 Some other race householders$106,027 Two or more races householders$101,377 Hispanic or Latino race householdersMedian 2022 house value $404,691 White Non-Hispanic householders$396,181 Black or African American householders $396,417 Asian householders$340,867 Two or more races householders$325,029 Hispanic or Latino householders
Median age by race in Pasadena
37.2 Median age for White residents36.6 38.1 33.1 Median age for Black or African American residents32.9 33.5 -836,842,104.4 Median age for American Indian / Alaska Native residents-674,418,604.0 -1,072,276,158.6 39.7 Median age for Asian residents38.8 38.8 -534,101,824.6 Median age for Native Hawaiian / Pacific Islander residents-720,061,021.4 -760,942,760.2 39.6 Median age for Other race residents38.2 38.9 22.9 Median age for Two or more races residents20.5 32.0 37.3 Median age for White alone residents36.6 38.9 30.8 Median age for Hispanic or Latino residents26.8 35.8
Owner/renter occupied households by race in Pasadena
House owners and renters - White residents 7,603 83.0% Owner occupied1,553 17.0% Renter occupiedHouse owners and renters - Black or African American residents 1,417 71.5% Owner occupied564 28.5% Renter occupiedHouse owners and renters - American Indian / Alaska Native residents 4 24.1% Owner occupied13 75.9% Renter occupiedHouse owners and renters - Asian residents 427 100.0% Owner occupiedHouse owners and renters - Other race residents 261 78.3% Owner occupied72 21.7% Renter occupiedHouse owners and renters - Two or more races residents 346 71.7% Owner occupied136 28.3% Renter occupiedHouse owners and renters - White alone residents 7,476 83.8% Owner occupied1,440 16.2% Renter occupiedHouse owners and renters - Hispanic or Latino residents 554 71.0% Owner occupied227 29.0% Renter occupied
Language usage in Pasadena
English speakers - Total 89.8% of residents of Pasadena speak English at home.
4.4% of residents speak Spanish at home 857 65.0% Speak English very well462 35.0% Speak English less than very well5.6% of residents speak other language at home 1,152 68.0% Speak English very well542 32.0% Speak English less than very well
English speakers - Born in the United States 95.6% of residents of Pasadena speak English at home.
2.4% of residents speak Spanish at home 136 63.8% Speak English very well77 36.2% Speak English less than very well1.9% of residents speak other language at home 143 82.7% Speak English very well30 17.3% Speak English less than very well
English speakers - Native, born elsewhere 50.5% of residents of Pasadena speak English at home.
50.9% of residents speak Spanish at home 375 100.0% Speak English very well3.4% of residents speak other language at home 25 100.0% Speak English very well
English speakers - Foreign-born 14.5% of residents of Pasadena speak English at home.
24.2% of residents speak Spanish at home 133 26.8% Speak English very well363 73.2% Speak English less than very well62.5% of residents speak other language at home 813 63.5% Speak English very well468 36.5% Speak English less than very well
White (Caucasian) - Speak only English Native:
98.3% (20,285)Foreign-born:
29.5% (82)
White (Caucasian) - Speak another language Native:
1.9% (390)Foreign-born:
67.0% (186)
Black or African American - Speak only English Native:
96.5% (4,627)Foreign-born:
53.4% (189)
Black or African American - Speak another language Native:
3.2% (154)Foreign-born:
43.5% (154)
Asian - Speak only English Native:
80.3% (250)Foreign-born:
1.4% (12)
Asian - Speak another language Native:
16.4% (51)Foreign-born:
99.5% (846)
Other race - Speak another language Native:
62.2% (372)Foreign-born:
100.0% (181)
Two or more races - Speak only English Native:
84.0% (1,465)Foreign-born:
5.3% (19)
Two or more races - Speak another language Native:
14.0% (244)Foreign-born:
85.7% (314)
White alone - Speak only English Native:
98.9% (19,833)Foreign-born:
42.2% (88)
White alone - Speak another language Native:
1.2% (231)Foreign-born:
57.8% (121)
Hispanic or Latino - Speak another language Native:
40.4% (746)Foreign-born:
100.0% (474)
Foreign-born residents in Pasadena 2,112 residents are foreign born (2.9% Asia , 1.9% Latin America , 0.8% Europe ).
This city:
6.5%Maryland:
15.7%
Marital status for residents in Pasadena Marital status - White (Caucasian) population 15 years and over
Males 32.4% Never married54.9% Now married1.3% Separated3.0% Widowed8.4% DivorcedFemales 25.1% Never married52.4% Now married1.3% Separated6.5% Widowed14.8% DivorcedWomen who gave birth in the past 12 months Now married:
62.8% (211)Unmarried:
37.2% (125)
Women who did not give birth in the past 12 months Now married:
47.5% (2,494)Unmarried:
52.5% (2,755)
Marital status - Black or African American population 15 years and over
Males 40.5% Never married52.5% Now married0.9% Separated0.0% Widowed6.1% DivorcedFemales 47.2% Never married36.3% Now married0.0% Separated3.0% Widowed13.5% DivorcedWomen who gave birth in the past 12 months Now married:
48.9% (94)Unmarried:
51.1% (98)
Women who did not give birth in the past 12 months Now married:
28.2% (455)Unmarried:
71.8% (1,158)
Marital status - Asian population 15 years and over
Males 20.3% Never married67.3% Now married0.0% Separated0.0% Widowed12.4% DivorcedFemales 20.0% Never married59.2% Now married0.0% Separated11.9% Widowed8.8% DivorcedWomen who gave birth in the past 12 months Now married:
71.4% (34)Unmarried:
28.6% (14)
Women who did not give birth in the past 12 months Now married:
58.2% (286)Unmarried:
41.8% (205)
Marital status - Other race population 15 years and over
Males 35.5% Never married49.4% Now married0.0% Separated15.0% Widowed0.0% DivorcedFemales 11.6% Never married63.2% Now married25.3% Separated0.0% Widowed0.0% DivorcedWomen who gave birth in the past 12 months Now married:
0.0% (0)Unmarried:
100.0% (26)
Women who did not give birth in the past 12 months Now married:
100.0% (130)Unmarried:
0.0% (0)
Marital status - Two or more races population 15 years and over
Males 58.4% Never married28.9% Now married0.0% Separated0.0% Widowed12.7% DivorcedFemales 25.4% Never married53.7% Now married12.3% Separated6.2% Widowed2.4% DivorcedWomen who gave birth in the past 12 months Now married:
100.0% (34)Unmarried:
0.0% (0)
Women who did not give birth in the past 12 months Now married:
46.0% (186)Unmarried:
54.0% (218)
Marital status - White alone, not Hispanic / Latino population 15 years and over
Males 32.1% Never married55.1% Now married1.3% Separated3.1% Widowed8.4% DivorcedFemales 24.0% Never married53.1% Now married1.3% Separated6.8% Widowed14.8% DivorcedWomen who gave birth in the past 12 months Now married:
70.6% (216)Unmarried:
29.4% (90)
Women who did not give birth in the past 12 months Now married:
47.9% (2,367)Unmarried:
52.1% (2,569)
Marital status - Hispanic or Latino population 15 years and over
Males 40.2% Never married47.0% Now married0.0% Separated6.2% Widowed6.6% DivorcedFemales 37.4% Never married43.7% Now married5.8% Separated3.5% Widowed9.5% DivorcedWomen who gave birth in the past 12 months Now married:
0.0% (0)Unmarried:
100.0% (68)
Women who did not give birth in the past 12 months Now married:
51.8% (389)Unmarried:
48.2% (362)
Ancestries in Pasadena
1,748 12.3% German1,262 8.9% American1,064 7.5% English923 6.5% Irish791 5.6% Polish406 2.9% Italian245 1.7% Jamaican194 1.4% Nigerian161 1.1% Ghanaian147 1.0% European138 1.0% French118 0.8% Scandinavian106 0.7% Scottish103 0.7% Eastern European103 0.7% Swedish88 0.6% Barbadian68 0.5% Slovak67 0.5% Scotch-Irish58 0.4% African49 0.3% Greek48 0.3% French Canadian33 0.2% Russian30 0.2% Lithuanian28 0.2% Canadian21 0.1% British21 0.1% Norwegian19 0.1% Czech16 0.1% Welsh14 0.10% Syrian13 0.09% Swiss11 0.08% Dutch10 0.07% Croatian10 0.07% Estonian9 0.06% Czechoslovakian9 0.06% Hungarian7 0.05% Lebanese4 0.03% Jordanian
Geographical mobility in Pasadena Same house 1 year ago 18,558 85.6% White (Caucasian)4,582 80.9% Black or African American19 98.9% American Indian / Alaska Native1,049 87.3% Asian713 86.6% Other race2,028 85.0% Two or more races18,034 85.6% White alone, not Hispanic / Latino2,055 86.6% Hispanic or LatinoMoved within same county 2,208 10.2% White / Caucasian679 12.0% Black or African American24 2.0% Asian92 11.2% Other race208 8.7% Two or more races2,076 9.9% White alone, not Hispanic / Latino208 8.8% Hispanic or LatinoMoved within same state 444 2.0% White / Caucasian297 5.3% Black or African American31 2.5% Asian96 4.0% Two or more races457 2.2% White alone, not Hispanic / Latino60 2.5% Hispanic or LatinoMoved from different state 570 2.6% White / Caucasian16 0.3% Black or African American10 1.2% Other race19 0.8% Two or more races582 2.8% White alone, not Hispanic / Latino16 0.7% Hispanic or LatinoMoved from abroad 33 0.2% White8 0.1% Black or African American52 2.2% Two or more races18 0.1% White alone, not Hispanic / Latino55 2.3% Hispanic or Latino
Children Nativity (place of birth) in Pasadena
Children under 6 years - Living with two parents Both parents native 1,439 100.0% NativeBoth parents foreign-born 93 100.0% NativeOne native, one foreign-born parent 108 100.0% NativeChildren under 6 years - Living with one parent Native parent 723 100.0% NativeForeign-born parent 65 100.0% NativeChildren 6 to 17 years - Living with two parents Both parents native 1,391 100.0% NativeBoth parents foreign-born 350 100.0% NativeOne native, one foreign-born parent 74 100.0% NativeChildren 6 to 17 years - Living with one parent Native parent 1,369 100.0% NativeForeign-born parent 103 58.0% Native74 42.0% Foreign-born
Grandparents responsible for own grandchildren in Pasadena
Grandparents (30 to 59 years) White / Caucasian 90 82.0% Responsible for grandchildren20 18.0% Not responsible for grandchildrenBlack or African American 86 26.6% Responsible for grandchildren238 73.4% Not responsible for grandchildrenAsian 9 100.0% Not responsible for grandchildrenWhite alone, not Hispanic / Latino 90 81.6% Responsible for grandchildren20 18.4% Not responsible for grandchildrenGrandparents (60 years and over) White / Caucasian 158 33.1% Responsible for grandchildren319 66.9% Not responsible for grandchildrenBlack or African American 10 100.0% Not responsible for grandchildrenAsian 12 100.0% Not responsible for grandchildrenWhite alone, not Hispanic / Latino 164 33.3% Responsible for grandchildren328 66.7% Not responsible for grandchildren