Races in Parkville, Maryland (MD) Detailed Stats
Data:
Races - White alone (%)
Races - White alone (% change since 2000)
Races - Black alone (%)
Races - Black alone (% change since 2000)
Races - American Indian alone (%)
Races - American Indian alone (% change since 2000)
Races - Asian alone (%)
Races - Asian alone (% change since 2000)
Races - Hispanic (%)
Races - Hispanic (% change since 2000)
Races - Native Hawaiian and Other Pacific Islander alone (%)
Races - Native Hawaiian and Other Pacific Islander alone (% change since 2000)
Races - Two or more races(%)
Races - Two or more races(% change since 2000)
Races - Other race alone (%)
Races - Other race alone (% change since 2000)
Racial diversity
Place of birth - Born in state of residence (%)
Place of birth - Born in state of residence (%) - White
Place of birth - Born in state of residence (%) - Black or African American
Place of birth - Born in state of residence (%) - Asian
Place of birth - Born in state of residence (%) - Hispanic or Latino
Place of birth - Born in state of residence (%) - American Indian and Alaska Native
Place of birth - Born in state of residence (%) - Multirace
Place of birth - Born in state of residence (%) - Other Race
Place of birth - Born in other state (%)
Place of birth - Born in other state (%) - White
Place of birth - Born in other state (%) - Black or African American
Place of birth - Born in other state (%) - Asian
Place of birth - Born in other state (%) - Hispanic or Latino
Place of birth - Born in other state (%) - American Indian and Alaska Native
Place of birth - Born in other state (%) - Multirace
Place of birth - Born in other state (%) - Other Race
Place of birth - Native, outside of US (%)
Place of birth - Native, outside of US (%) - White
Place of birth - Native, outside of US (%) - Black or African American
Place of birth - Native, outside of US (%) - Asian
Place of birth - Native, outside of US (%) - Hispanic or Latino
Place of birth - Native, outside of US (%) - American Indian and Alaska Native
Place of birth - Native, outside of US (%) - Multirace
Place of birth - Native, outside of US (%) - Other Race
Place of birth - Foreign born (%)
Place of birth - Foreign born (%) - White
Place of birth - Foreign born (%) - Black or African American
Place of birth - Foreign born (%) - Asian
Place of birth - Foreign born (%) - Hispanic or Latino
Place of birth - Foreign born (%) - American Indian and Alaska Native
Place of birth - Foreign born (%) - Multirace
Place of birth - Foreign born (%) - Other Race
Residents speaking English at home (%)
Residents speaking English at home - Born in the United States (%)
Residents speaking English at home - Native, born elsewhere (%)
Residents speaking English at home - Foreign born (%)
Residents speaking Spanish at home (%)
Residents speaking Spanish at home - Born in the United States (%)
Residents speaking Spanish at home - Native, born elsewhere (%)
Residents speaking Spanish at home - Foreign born (%)
Residents speaking other language at home (%)
Residents speaking other language at home - Born in the United States (%)
Residents speaking other language at home - Native, born elsewhere (%)
Residents speaking other language at home - Foreign born (%)
Marital status - Never married (%)
Marital status - Now married (%)
Marital status - Separated (%)
Marital status - Widowed (%)
Marital status - Divorced (%)
Ancestries Reported - Arab (%)
Ancestries Reported - Czech (%)
Ancestries Reported - Danish (%)
Ancestries Reported - Dutch (%)
Ancestries Reported - English (%)
Ancestries Reported - French (%)
Ancestries Reported - French Canadian (%)
Ancestries Reported - German (%)
Ancestries Reported - Greek (%)
Ancestries Reported - Hungarian (%)
Ancestries Reported - Irish (%)
Ancestries Reported - Italian (%)
Ancestries Reported - Lithuanian (%)
Ancestries Reported - Norwegian (%)
Ancestries Reported - Polish (%)
Ancestries Reported - Portuguese (%)
Ancestries Reported - Russian (%)
Ancestries Reported - Scotch-Irish (%)
Ancestries Reported - Scottish (%)
Ancestries Reported - Slovak (%)
Ancestries Reported - Subsaharan African (%)
Ancestries Reported - Swedish (%)
Ancestries Reported - Swiss (%)
Ancestries Reported - Ukrainian (%)
Ancestries Reported - United States (%)
Ancestries Reported - Welsh (%)
Ancestries Reported - West Indian (%)
Ancestries Reported - Other (%)
Geographical mobility - Same house 1 year ago (%)
Geographical mobility - Same house 1 year ago (%) - White
Geographical mobility - Same house 1 year ago (%) - Black or African American
Geographical mobility - Same house 1 year ago (%) - Asian
Geographical mobility - Same house 1 year ago (%) - Hispanic or Latino
Geographical mobility - Same house 1 year ago (%) - American Indian and Alaska Native
Geographical mobility - Same house 1 year ago (%) - Multirace
Geographical mobility - Same house 1 year ago (%) - Other Race
Geographical mobility - Moved within same county (%)
Geographical mobility - Moved within same county (%) - White
Geographical mobility - Moved within same county (%) - Black or African American
Geographical mobility - Moved within same county (%) - Asian
Geographical mobility - Moved within same county (%) - Hispanic or Latino
Geographical mobility - Moved within same county (%) - American Indian and Alaska Native
Geographical mobility - Moved within same county (%) - Multirace
Geographical mobility - Moved within same county (%) - Other Race
Geographical mobility - Moved from different county within same state (%)
Geographical mobility - Moved from different county within same state (%) - White
Geographical mobility - Moved from different county within same state (%) - Black or African American
Geographical mobility - Moved from different county within same state (%) - Asian
Geographical mobility - Moved from different county within same state (%) - Hispanic or Latino
Geographical mobility - Moved from different county within same state (%) - American Indian and Alaska Native
Geographical mobility - Moved from different county within same state (%) - Multirace
Geographical mobility - Moved from different county within same state (%) - Other Race
Geographical mobility - Moved from different state (%)
Geographical mobility - Moved from different state (%) - White
Geographical mobility - Moved from different state (%) - Black or African American
Geographical mobility - Moved from different state (%) - Asian
Geographical mobility - Moved from different state (%) - Hispanic or Latino
Geographical mobility - Moved from different state (%) - American Indian and Alaska Native
Geographical mobility - Moved from different state (%) - Multirace
Geographical mobility - Moved from different state (%) - Other Race
Geographical mobility - Moved from abroad (%)
Geographical mobility - Moved from abroad (%) - White
Geographical mobility - Moved from abroad (%) - Black or African American
Geographical mobility - Moved from abroad (%) - Asian
Geographical mobility - Moved from abroad (%) - Hispanic or Latino
Geographical mobility - Moved from abroad (%) - American Indian and Alaska Native
Geographical mobility - Moved from abroad (%) - Multirace
Geographical mobility - Moved from abroad (%) - Other Race
Place of birth for the foreign-born population - Ireland (%)
Place of birth for the foreign-born population - Denmark (%)
Place of birth for the foreign-born population - Norway (%)
Place of birth for the foreign-born population - Sweden (%)
Place of birth for the foreign-born population - United Kingdom (%)
Place of birth for the foreign-born population - England (%)
Place of birth for the foreign-born population - Scotland (%)
Place of birth for the foreign-born population - Other Northern Europe (%)
Place of birth for the foreign-born population - Austria (%)
Place of birth for the foreign-born population - Belgium (%)
Place of birth for the foreign-born population - France (%)
Place of birth for the foreign-born population - Germany (%)
Place of birth for the foreign-born population - Netherlands (%)
Place of birth for the foreign-born population - Switzerland (%)
Place of birth for the foreign-born population - Other Western Europe (%)
Place of birth for the foreign-born population - Greece (%)
Place of birth for the foreign-born population - Italy (%)
Place of birth for the foreign-born population - Portugal (%)
Place of birth for the foreign-born population - Spain (%)
Place of birth for the foreign-born population - Other Southern Europe (%)
Place of birth for the foreign-born population - Albania (%)
Place of birth for the foreign-born population - Belarus (%)
Place of birth for the foreign-born population - Bosnia and Herzegovina (%)
Place of birth for the foreign-born population - Bulgaria (%)
Place of birth for the foreign-born population - Croatia (%)
Place of birth for the foreign-born population - Czechoslovakia (%)
Place of birth for the foreign-born population - Hungary (%)
Place of birth for the foreign-born population - Latvia (%)
Place of birth for the foreign-born population - Lithuania (%)
Place of birth for the foreign-born population - North Macedonia (Macedonia) (%)
Place of birth for the foreign-born population - Moldova (%)
Place of birth for the foreign-born population - Poland (%)
Place of birth for the foreign-born population - Romania (%)
Place of birth for the foreign-born population - Russia (%)
Place of birth for the foreign-born population - Serbia (%)
Place of birth for the foreign-born population - Ukraine (%)
Place of birth for the foreign-born population - Other Eastern Europe (%)
Place of birth for the foreign-born population - China (%)
Place of birth for the foreign-born population - Hong Kong (%)
Place of birth for the foreign-born population - Taiwan (%)
Place of birth for the foreign-born population - Japan (%)
Place of birth for the foreign-born population - Korea (%)
Place of birth for the foreign-born population - Other Eastern Asia (%)
Place of birth for the foreign-born population - Afghanistan (%)
Place of birth for the foreign-born population - Bangladesh (%)
Place of birth for the foreign-born population - India (%)
Place of birth for the foreign-born population - Iran (%)
Place of birth for the foreign-born population - Kazakhstan (%)
Place of birth for the foreign-born population - Nepal (%)
Place of birth for the foreign-born population - Pakistan (%)
Place of birth for the foreign-born population - Sri Lanka (%)
Place of birth for the foreign-born population - Uzbekistan (%)
Place of birth for the foreign-born population - Other South Central Asia (%)
Place of birth for the foreign-born population - Burma (%)
Place of birth for the foreign-born population - Cambodia (%)
Place of birth for the foreign-born population - Indonesia (%)
Place of birth for the foreign-born population - Laos (%)
Place of birth for the foreign-born population - Malaysia (%)
Place of birth for the foreign-born population - Philippines (%)
Place of birth for the foreign-born population - Singapore (%)
Place of birth for the foreign-born population - Thailand (%)
Place of birth for the foreign-born population - Vietnam (%)
Place of birth for the foreign-born population - Other South Eastern Asia (%)
Place of birth for the foreign-born population - Armenia (%)
Place of birth for the foreign-born population - Iraq (%)
Place of birth for the foreign-born population - Israel (%)
Place of birth for the foreign-born population - Jordan (%)
Place of birth for the foreign-born population - Kuwait (%)
Place of birth for the foreign-born population - Lebanon (%)
Place of birth for the foreign-born population - Saudi Arabia (%)
Place of birth for the foreign-born population - Syria (%)
Place of birth for the foreign-born population - Turkey (%)
Place of birth for the foreign-born population - Yemen (%)
Place of birth for the foreign-born population - Other Western Asia (%)
Place of birth for the foreign-born population - Eritrea (%)
Place of birth for the foreign-born population - Ethiopia (%)
Place of birth for the foreign-born population - Kenya (%)
Place of birth for the foreign-born population - Somalia (%)
Place of birth for the foreign-born population - Uganda (%)
Place of birth for the foreign-born population - Zimbabwe (%)
Place of birth for the foreign-born population - Other Eastern Africa (%)
Place of birth for the foreign-born population - Cameroon (%)
Place of birth for the foreign-born population - Congo (%)
Place of birth for the foreign-born population - Democratic Republic of Congo (Zaire) (%)
Place of birth for the foreign-born population - Other Middle Africa (%)
Place of birth for the foreign-born population - Egypt (%)
Place of birth for the foreign-born population - Morocco (%)
Place of birth for the foreign-born population - Sudan (%)
Place of birth for the foreign-born population - Other Northern Africa (%)
Place of birth for the foreign-born population - South Africa (%)
Place of birth for the foreign-born population - Other Southern Africa (%)
Place of birth for the foreign-born population - Cabo Verde (%)
Place of birth for the foreign-born population - Ghana (%)
Place of birth for the foreign-born population - Liberia (%)
Place of birth for the foreign-born population - Nigeria (%)
Place of birth for the foreign-born population - Senegal (%)
Place of birth for the foreign-born population - Sierra Leone (%)
Place of birth for the foreign-born population - Other Western Africa (%)
Place of birth for the foreign-born population - Australia (%)
Place of birth for the foreign-born population - New Zealand (%)
Place of birth for the foreign-born population - Fiji (%)
Place of birth for the foreign-born population - Micronesia (%)
Place of birth for the foreign-born population - Bahamas (%)
Place of birth for the foreign-born population - Barbados (%)
Place of birth for the foreign-born population - Cuba (%)
Place of birth for the foreign-born population - Dominica (%)
Place of birth for the foreign-born population - Dominican Republic (%)
Place of birth for the foreign-born population - Grenada (%)
Place of birth for the foreign-born population - Haiti (%)
Place of birth for the foreign-born population - Jamaica (%)
Place of birth for the foreign-born population - St. Vincent and the Grenadines (%)
Place of birth for the foreign-born population - Trinidad and Tobago (%)
Place of birth for the foreign-born population - West Indies (%)
Place of birth for the foreign-born population - Other Caribbean (%)
Place of birth for the foreign-born population - Belize (%)
Place of birth for the foreign-born population - Costa Rica (%)
Place of birth for the foreign-born population - El Salvador (%)
Place of birth for the foreign-born population - Guatemala (%)
Place of birth for the foreign-born population - Honduras (%)
Place of birth for the foreign-born population - Mexico (%)
Place of birth for the foreign-born population - Nicaragua (%)
Place of birth for the foreign-born population - Panama (%)
Place of birth for the foreign-born population - Other Central America (%)
Place of birth for the foreign-born population - Argentina (%)
Place of birth for the foreign-born population - Bolivia (%)
Place of birth for the foreign-born population - Brazil (%)
Place of birth for the foreign-born population - Chile (%)
Place of birth for the foreign-born population - Colombia (%)
Place of birth for the foreign-born population - Ecuador (%)
Place of birth for the foreign-born population - Guyana (%)
Place of birth for the foreign-born population - Peru (%)
Place of birth for the foreign-born population - Uruguay (%)
Place of birth for the foreign-born population - Venezuela (%)
Place of birth for the foreign-born population - Other South America (%)
Place of birth for the foreign-born population - Canada (%)
Place of birth for the foreign-born population - Other Northern America (%)
Place of birth for the foreign-born population - Other (%)
Latest news about races in Parkville, MD collected exclusively by city-data.com from local newspapers, TV, and radio stations
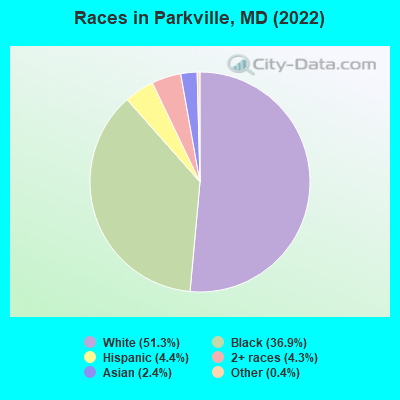
According to 2022 data, the most numerous races in Parkville, MD are White alone (15,580 residents), Black alone (11,198 residents), and Hispanic (1,322 residents). 93.1% of Parkville residents speak English at home. 7.4% of Parkville, MD residents are foreign-born (2.3% born in Africa, 2.0% born in Asia, 1.8% born in Latin America), which is 116.3% less than the foreign-born rate of 16.0% across the entire state of Maryland.
Race distribution in Parkville
2000 2022
3,286,547 62.1% White alone 1,464,735 27.7% Black alone 227,916 4.3% Hispanic 209,738 4.0% Asian alone 82,946 1.6% Two or more races 13,312 0.3% American Indian alone 9,379 0.2% Other race alone 1,913 0.04% Native Hawaiian and Other
2,906,492 47.1% White alone 1,800,914 29.2% Black alone 705,842 11.4% Hispanic 401,818 6.5% Asian alone 291,317 4.7% Two or more races 46,930 0.8% Other race alone 8,930 0.1% American Indian alone 2,417 0.04% Native Hawaiian and Other
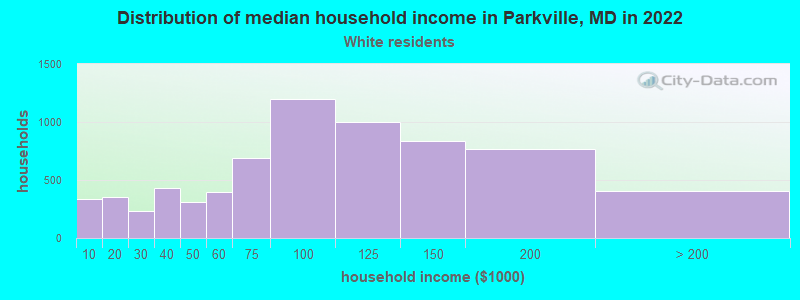
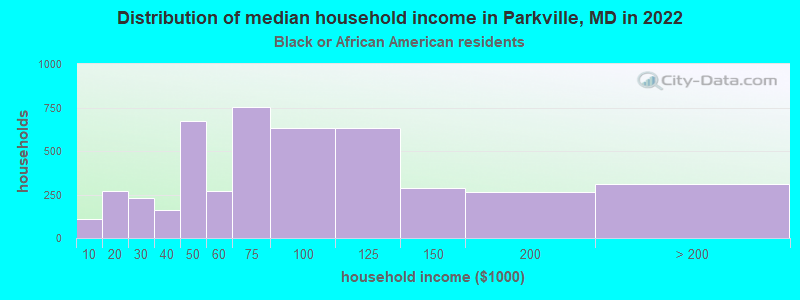
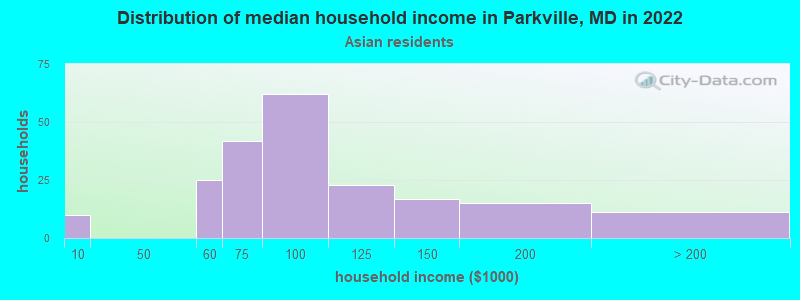
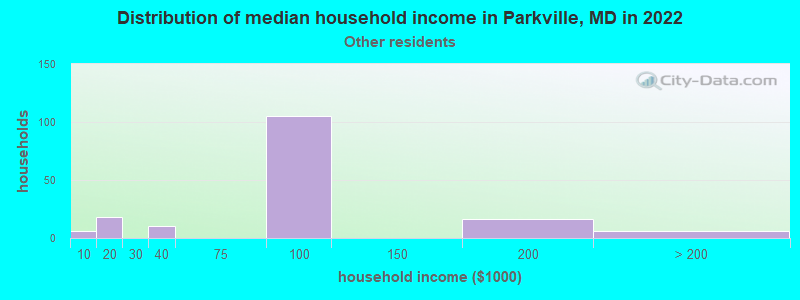
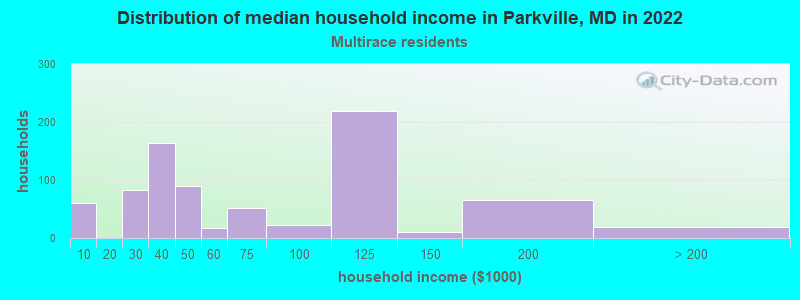
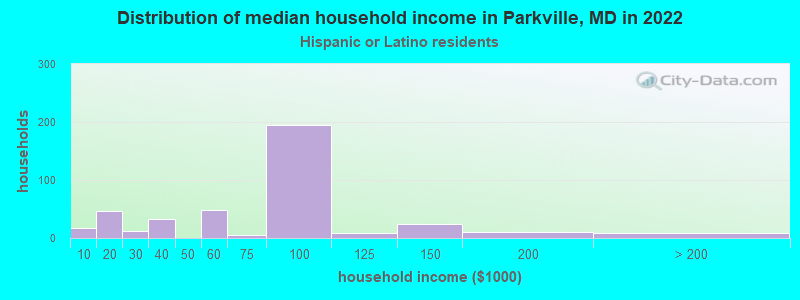
Income and house value in Parkville Median household income in 2022 $86,196 White non-Hispanic householders$68,324 Black householders$78,414 Asian householders$87,897 Some other race householders$51,579 Two or more races householders$71,187 Hispanic or Latino race householdersMedian 2022 house value $261,133 White Non-Hispanic householders$222,285 Black or African American householders$307,700 American Indian or Alaska Native householders $221,513 Asian householders$418,071 Native Hawaiian and other Pacific Islander householders$281,458 Some other race householders$302,297 Two or more races householders$278,113 Hispanic or Latino householders
Median age by race in Parkville
44.0 Median age for White residents43.7 44.3 34.9 Median age for Black or African American residents35.1 34.2 57.6 Median age for American Indian / Alaska Native residents-867,632,849.4 24.8 47.9 Median age for Asian residents44.8 50.0 -1,541,125,539.6 Median age for Native Hawaiian / Pacific Islander residents-790,901,136.6 -760,942,760.2 19.3 Median age for Other race residents20.8 20.0 26.2 Median age for Two or more races residents13.2 27.4 43.9 Median age for White alone residents43.7 44.4 21.1 Median age for Hispanic or Latino residents14.3 21.8
Owner/renter occupied households by race in Parkville
House owners and renters - White residents 5,869 84.7% Owner occupied1,063 15.3% Renter occupiedHouse owners and renters - Black or African American residents 1,858 40.7% Owner occupied2,710 59.3% Renter occupiedHouse owners and renters - American Indian / Alaska Native residents 34 65.3% Owner occupied18 34.7% Renter occupiedHouse owners and renters - Asian residents 86 37.7% Owner occupied142 62.3% Renter occupiedHouse owners and renters - Other race residents 78 46.4% Owner occupied90 53.6% Renter occupiedHouse owners and renters - Two or more races residents 434 55.1% Owner occupied354 44.9% Renter occupiedHouse owners and renters - White alone residents 5,862 84.6% Owner occupied1,067 15.4% Renter occupiedHouse owners and renters - Hispanic or Latino residents 148 45.3% Owner occupied178 54.7% Renter occupied
Language usage in Parkville
English speakers - Total 93.1% of residents of Parkville speak English at home.
1.7% of residents speak Spanish at home 356 71.8% Speak English very well140 28.2% Speak English less than very well5.4% of residents speak other language at home 1,084 70.3% Speak English very well459 29.7% Speak English less than very well
English speakers - Born in the United States 95.9% of residents of Parkville speak English at home.
2.2% of residents speak Spanish at home 114 100.0% Speak English very well2.4% of residents speak other language at home 93 75.6% Speak English very well30 24.4% Speak English less than very well
All residents speak only English at home
English speakers - Foreign-born 36.9% of residents of Parkville speak English at home.
8.4% of residents speak Spanish at home 118 63.1% Speak English very well69 36.9% Speak English less than very well55.2% of residents speak other language at home 827 67.2% Speak English very well403 32.8% Speak English less than very well
White (Caucasian) - Speak only English Native:
98.9% (14,453)Foreign-born:
47.4% (136)
White (Caucasian) - Speak another language Native:
1.5% (214)Foreign-born:
54.5% (156)
Black or African American - Speak only English Native:
99.1% (9,295)Foreign-born:
52.5% (543)
Black or African American - Speak another language Native:
1.2% (115)Foreign-born:
49.6% (512)
Asian - Speak only English Native:
50.1% (60)Foreign-born:
19.0% (111)
Asian - Speak another language Native:
50.0% (60)Foreign-born:
81.8% (476)
Other race - Speak another language Native:
24.5% (175)Foreign-born:
100.0% (199)
Two or more races - Speak only English Native:
98.5% (1,283)Foreign-born:
52.1% (33)
Two or more races - Speak another language Native:
4.4% (57)Foreign-born:
52.5% (33)
White alone - Speak only English Native:
98.7% (14,402)Foreign-born:
43.3% (134)
White alone - Speak another language Native:
1.4% (207)Foreign-born:
55.8% (173)
Hispanic or Latino - Speak only English Native:
88.8% (794)Foreign-born:
8.4% (20)
Hispanic or Latino - Speak another language Native:
19.7% (176)Foreign-born:
91.6% (220)
Foreign-born residents in Parkville 2,245 residents are foreign born (2.3% Africa , 2.0% Asia , 1.8% Latin America ).
This city:
7.4%Maryland:
15.7%
Marital status for residents in Parkville Marital status - White (Caucasian) population 15 years and over
Males 34.3% Never married48.3% Now married0.7% Separated2.8% Widowed13.9% DivorcedFemales 29.7% Never married45.2% Now married0.8% Separated12.0% Widowed12.3% DivorcedWomen who gave birth in the past 12 months Now married:
88.0% (171)Unmarried:
12.0% (23)
Women who did not give birth in the past 12 months Now married:
41.4% (1,429)Unmarried:
58.6% (2,022)
Marital status - Black or African American population 15 years and over
Males 49.2% Never married35.4% Now married3.3% Separated0.8% Widowed11.4% DivorcedFemales 56.3% Never married24.1% Now married2.8% Separated3.9% Widowed12.9% DivorcedWomen who gave birth in the past 12 months Now married:
50.8% (66)Unmarried:
49.2% (64)
Women who did not give birth in the past 12 months Now married:
25.1% (869)Unmarried:
74.9% (2,594)
Marital status - American Indian / Alaska Native population 15 years and over
Males 0.0% Never married51.4% Now married48.6% Separated0.0% Widowed0.0% DivorcedFemales 100.0% Never married0.0% Now married0.0% Separated0.0% Widowed0.0% DivorcedWomen who did not give birth in the past 12 months Now married:
0.0% (0)Unmarried:
100.0% (52)
Marital status - Asian population 15 years and over
Males 11.5% Never married54.9% Now married0.0% Separated33.6% Widowed0.0% DivorcedFemales 20.4% Never married60.3% Now married0.0% Separated14.9% Widowed4.4% DivorcedWomen who gave birth in the past 12 months Now married:
100.0% (5)Unmarried:
0.0% (0)
Women who did not give birth in the past 12 months Now married:
73.4% (146)Unmarried:
26.6% (53)
Marital status - Other race population 15 years and over
Males 52.9% Never married37.7% Now married0.0% Separated0.0% Widowed9.4% DivorcedFemales 63.6% Never married29.5% Now married0.0% Separated0.0% Widowed6.9% DivorcedWomen who gave birth in the past 12 months Now married:
0.0% (0)Unmarried:
100.0% (28)
Women who did not give birth in the past 12 months Now married:
31.0% (103)Unmarried:
69.0% (229)
Marital status - Two or more races population 15 years and over
Males 52.4% Never married23.8% Now married0.0% Separated19.0% Widowed4.8% DivorcedFemales 62.2% Never married20.2% Now married4.8% Separated4.8% Widowed7.9% DivorcedWomen who gave birth in the past 12 months Now married:
45.8% (14)Unmarried:
54.2% (17)
Women who did not give birth in the past 12 months Now married:
19.6% (120)Unmarried:
80.4% (490)
Marital status - White alone, not Hispanic / Latino population 15 years and over
Males 34.5% Never married48.1% Now married0.7% Separated2.8% Widowed13.9% DivorcedFemales 30.0% Never married45.4% Now married0.8% Separated11.9% Widowed11.9% DivorcedWomen who gave birth in the past 12 months Now married:
88.0% (172)Unmarried:
12.0% (24)
Women who did not give birth in the past 12 months Now married:
41.0% (1,413)Unmarried:
59.0% (2,031)
Marital status - Hispanic or Latino population 15 years and over
Males 26.1% Never married55.1% Now married6.2% Separated0.0% Widowed12.7% DivorcedFemales 48.8% Never married28.8% Now married0.0% Separated2.9% Widowed19.6% DivorcedWomen who gave birth in the past 12 months Now married:
0.0% (0)Unmarried:
100.0% (20)
Women who did not give birth in the past 12 months Now married:
34.7% (116)Unmarried:
65.3% (218)
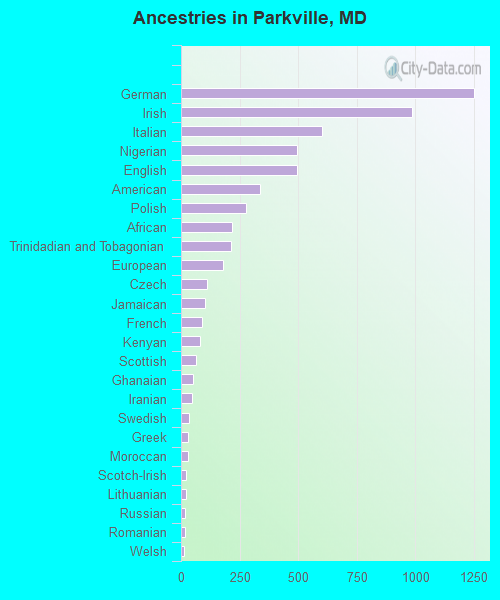
Ancestries in Parkville
1,253 7.9% German988 6.2% Irish604 3.8% Italian496 3.1% Nigerian494 3.1% English336 2.1% American276 1.7% Polish217 1.4% African215 1.4% Trinidadian and Tobagonian178 1.1% European110 0.7% Czech103 0.7% Jamaican89 0.6% French83 0.5% Kenyan65 0.4% Scottish53 0.3% Ghanaian45 0.3% Iranian36 0.2% Swedish31 0.2% Greek28 0.2% Moroccan22 0.1% Scotch-Irish22 0.1% Lithuanian18 0.1% Russian17 0.1% Romanian13 0.08% Welsh12 0.08% Ethiopian11 0.07% Senegalese9 0.06% Dutch8 0.05% Scandinavian7 0.04% British7 0.04% Eastern European6 0.04% Norwegian5 0.03% Yugoslavian3 0.02% Jordanian2 0.01% Serbian1 0.01% Belizean
Geographical mobility in Parkville Same house 1 year ago 14,296 92.8% White (Caucasian)10,149 90.2% Black or African American90 89.0% American Indian / Alaska Native667 92.2% Asian808 95.1% Other race1,478 97.4% Two or more races14,280 92.6% White alone, not Hispanic / Latino1,241 98.9% Hispanic or LatinoMoved within same county 462 3.0% White / Caucasian619 5.5% Black or African American39 5.4% Asian36 4.2% Other race34 2.2% Two or more races486 3.2% White alone, not Hispanic / Latino45 3.6% Hispanic or LatinoMoved within same state 419 2.7% White / Caucasian436 3.9% Black or African American12 1.5% Other race39 2.6% Two or more races419 2.7% White alone, not Hispanic / Latino16 1.2% Hispanic or LatinoMoved from different state 229 1.5% White / Caucasian60 0.5% Black or African American7 7.0% American Indian / Alaska Native1 0.1% Two or more races230 1.5% White alone, not Hispanic / LatinoMoved from abroad 13 0.1% White17 0.1% Black or African American10 1.4% Asian1 0.0% Two or more races6 0.0% White alone, not Hispanic / Latino10 0.8% Hispanic or Latino
Children Nativity (place of birth) in Parkville
Children under 6 years - Living with two parents Both parents native 1,443 100.0% NativeBoth parents foreign-born 85 100.0% NativeOne native, one foreign-born parent 94 100.0% NativeChildren under 6 years - Living with one parent Native parent 707 100.0% NativeForeign-born parent 50 100.0% NativeChildren 6 to 17 years - Living with two parents Both parents native 1,497 100.0% NativeBoth parents foreign-born 83 100.0% NativeOne native, one foreign-born parent 301 100.0% NativeChildren 6 to 17 years - Living with one parent Native parent 1,893 100.0% NativeForeign-born parent 337 50.5% Native330 49.5% Foreign-born
Grandparents responsible for own grandchildren in Parkville
Grandparents (30 to 59 years) White / Caucasian 39 49.6% Responsible for grandchildren40 50.4% Not responsible for grandchildrenBlack or African American 27 41.6% Responsible for grandchildren38 58.4% Not responsible for grandchildrenWhite alone, not Hispanic / Latino 39 73.0% Responsible for grandchildren15 27.0% Not responsible for grandchildrenHispanic or Latino 35 100.0% Not responsible for grandchildrenGrandparents (60 years and over) White / Caucasian 61 29.2% Responsible for grandchildren149 70.8% Not responsible for grandchildrenBlack or African American 173 100.0% Not responsible for grandchildrenWhite alone, not Hispanic / Latino 63 28.6% Responsible for grandchildren156 71.4% Not responsible for grandchildren