Races in Park Ridge, New Jersey (NJ) Detailed Stats
Data:
Races - White alone (%)
Races - White alone (% change since 2000)
Races - Black alone (%)
Races - Black alone (% change since 2000)
Races - American Indian alone (%)
Races - American Indian alone (% change since 2000)
Races - Asian alone (%)
Races - Asian alone (% change since 2000)
Races - Hispanic (%)
Races - Hispanic (% change since 2000)
Races - Native Hawaiian and Other Pacific Islander alone (%)
Races - Native Hawaiian and Other Pacific Islander alone (% change since 2000)
Races - Two or more races(%)
Races - Two or more races(% change since 2000)
Races - Other race alone (%)
Races - Other race alone (% change since 2000)
Racial diversity
Place of birth - Born in state of residence (%)
Place of birth - Born in state of residence (%) - White
Place of birth - Born in state of residence (%) - Black or African American
Place of birth - Born in state of residence (%) - Asian
Place of birth - Born in state of residence (%) - Hispanic or Latino
Place of birth - Born in state of residence (%) - American Indian and Alaska Native
Place of birth - Born in state of residence (%) - Multirace
Place of birth - Born in state of residence (%) - Other Race
Place of birth - Born in other state (%)
Place of birth - Born in other state (%) - White
Place of birth - Born in other state (%) - Black or African American
Place of birth - Born in other state (%) - Asian
Place of birth - Born in other state (%) - Hispanic or Latino
Place of birth - Born in other state (%) - American Indian and Alaska Native
Place of birth - Born in other state (%) - Multirace
Place of birth - Born in other state (%) - Other Race
Place of birth - Native, outside of US (%)
Place of birth - Native, outside of US (%) - White
Place of birth - Native, outside of US (%) - Black or African American
Place of birth - Native, outside of US (%) - Asian
Place of birth - Native, outside of US (%) - Hispanic or Latino
Place of birth - Native, outside of US (%) - American Indian and Alaska Native
Place of birth - Native, outside of US (%) - Multirace
Place of birth - Native, outside of US (%) - Other Race
Place of birth - Foreign born (%)
Place of birth - Foreign born (%) - White
Place of birth - Foreign born (%) - Black or African American
Place of birth - Foreign born (%) - Asian
Place of birth - Foreign born (%) - Hispanic or Latino
Place of birth - Foreign born (%) - American Indian and Alaska Native
Place of birth - Foreign born (%) - Multirace
Place of birth - Foreign born (%) - Other Race
Residents speaking English at home (%)
Residents speaking English at home - Born in the United States (%)
Residents speaking English at home - Native, born elsewhere (%)
Residents speaking English at home - Foreign born (%)
Residents speaking Spanish at home (%)
Residents speaking Spanish at home - Born in the United States (%)
Residents speaking Spanish at home - Native, born elsewhere (%)
Residents speaking Spanish at home - Foreign born (%)
Residents speaking other language at home (%)
Residents speaking other language at home - Born in the United States (%)
Residents speaking other language at home - Native, born elsewhere (%)
Residents speaking other language at home - Foreign born (%)
Marital status - Never married (%)
Marital status - Now married (%)
Marital status - Separated (%)
Marital status - Widowed (%)
Marital status - Divorced (%)
Ancestries Reported - Arab (%)
Ancestries Reported - Czech (%)
Ancestries Reported - Danish (%)
Ancestries Reported - Dutch (%)
Ancestries Reported - English (%)
Ancestries Reported - French (%)
Ancestries Reported - French Canadian (%)
Ancestries Reported - German (%)
Ancestries Reported - Greek (%)
Ancestries Reported - Hungarian (%)
Ancestries Reported - Irish (%)
Ancestries Reported - Italian (%)
Ancestries Reported - Lithuanian (%)
Ancestries Reported - Norwegian (%)
Ancestries Reported - Polish (%)
Ancestries Reported - Portuguese (%)
Ancestries Reported - Russian (%)
Ancestries Reported - Scotch-Irish (%)
Ancestries Reported - Scottish (%)
Ancestries Reported - Slovak (%)
Ancestries Reported - Subsaharan African (%)
Ancestries Reported - Swedish (%)
Ancestries Reported - Swiss (%)
Ancestries Reported - Ukrainian (%)
Ancestries Reported - United States (%)
Ancestries Reported - Welsh (%)
Ancestries Reported - West Indian (%)
Ancestries Reported - Other (%)
Geographical mobility - Same house 1 year ago (%)
Geographical mobility - Same house 1 year ago (%) - White
Geographical mobility - Same house 1 year ago (%) - Black or African American
Geographical mobility - Same house 1 year ago (%) - Asian
Geographical mobility - Same house 1 year ago (%) - Hispanic or Latino
Geographical mobility - Same house 1 year ago (%) - American Indian and Alaska Native
Geographical mobility - Same house 1 year ago (%) - Multirace
Geographical mobility - Same house 1 year ago (%) - Other Race
Geographical mobility - Moved within same county (%)
Geographical mobility - Moved within same county (%) - White
Geographical mobility - Moved within same county (%) - Black or African American
Geographical mobility - Moved within same county (%) - Asian
Geographical mobility - Moved within same county (%) - Hispanic or Latino
Geographical mobility - Moved within same county (%) - American Indian and Alaska Native
Geographical mobility - Moved within same county (%) - Multirace
Geographical mobility - Moved within same county (%) - Other Race
Geographical mobility - Moved from different county within same state (%)
Geographical mobility - Moved from different county within same state (%) - White
Geographical mobility - Moved from different county within same state (%) - Black or African American
Geographical mobility - Moved from different county within same state (%) - Asian
Geographical mobility - Moved from different county within same state (%) - Hispanic or Latino
Geographical mobility - Moved from different county within same state (%) - American Indian and Alaska Native
Geographical mobility - Moved from different county within same state (%) - Multirace
Geographical mobility - Moved from different county within same state (%) - Other Race
Geographical mobility - Moved from different state (%)
Geographical mobility - Moved from different state (%) - White
Geographical mobility - Moved from different state (%) - Black or African American
Geographical mobility - Moved from different state (%) - Asian
Geographical mobility - Moved from different state (%) - Hispanic or Latino
Geographical mobility - Moved from different state (%) - American Indian and Alaska Native
Geographical mobility - Moved from different state (%) - Multirace
Geographical mobility - Moved from different state (%) - Other Race
Geographical mobility - Moved from abroad (%)
Geographical mobility - Moved from abroad (%) - White
Geographical mobility - Moved from abroad (%) - Black or African American
Geographical mobility - Moved from abroad (%) - Asian
Geographical mobility - Moved from abroad (%) - Hispanic or Latino
Geographical mobility - Moved from abroad (%) - American Indian and Alaska Native
Geographical mobility - Moved from abroad (%) - Multirace
Geographical mobility - Moved from abroad (%) - Other Race
Place of birth for the foreign-born population - Ireland (%)
Place of birth for the foreign-born population - Denmark (%)
Place of birth for the foreign-born population - Norway (%)
Place of birth for the foreign-born population - Sweden (%)
Place of birth for the foreign-born population - United Kingdom (%)
Place of birth for the foreign-born population - England (%)
Place of birth for the foreign-born population - Scotland (%)
Place of birth for the foreign-born population - Other Northern Europe (%)
Place of birth for the foreign-born population - Austria (%)
Place of birth for the foreign-born population - Belgium (%)
Place of birth for the foreign-born population - France (%)
Place of birth for the foreign-born population - Germany (%)
Place of birth for the foreign-born population - Netherlands (%)
Place of birth for the foreign-born population - Switzerland (%)
Place of birth for the foreign-born population - Other Western Europe (%)
Place of birth for the foreign-born population - Greece (%)
Place of birth for the foreign-born population - Italy (%)
Place of birth for the foreign-born population - Portugal (%)
Place of birth for the foreign-born population - Spain (%)
Place of birth for the foreign-born population - Other Southern Europe (%)
Place of birth for the foreign-born population - Albania (%)
Place of birth for the foreign-born population - Belarus (%)
Place of birth for the foreign-born population - Bosnia and Herzegovina (%)
Place of birth for the foreign-born population - Bulgaria (%)
Place of birth for the foreign-born population - Croatia (%)
Place of birth for the foreign-born population - Czechoslovakia (%)
Place of birth for the foreign-born population - Hungary (%)
Place of birth for the foreign-born population - Latvia (%)
Place of birth for the foreign-born population - Lithuania (%)
Place of birth for the foreign-born population - North Macedonia (Macedonia) (%)
Place of birth for the foreign-born population - Moldova (%)
Place of birth for the foreign-born population - Poland (%)
Place of birth for the foreign-born population - Romania (%)
Place of birth for the foreign-born population - Russia (%)
Place of birth for the foreign-born population - Serbia (%)
Place of birth for the foreign-born population - Ukraine (%)
Place of birth for the foreign-born population - Other Eastern Europe (%)
Place of birth for the foreign-born population - China (%)
Place of birth for the foreign-born population - Hong Kong (%)
Place of birth for the foreign-born population - Taiwan (%)
Place of birth for the foreign-born population - Japan (%)
Place of birth for the foreign-born population - Korea (%)
Place of birth for the foreign-born population - Other Eastern Asia (%)
Place of birth for the foreign-born population - Afghanistan (%)
Place of birth for the foreign-born population - Bangladesh (%)
Place of birth for the foreign-born population - India (%)
Place of birth for the foreign-born population - Iran (%)
Place of birth for the foreign-born population - Kazakhstan (%)
Place of birth for the foreign-born population - Nepal (%)
Place of birth for the foreign-born population - Pakistan (%)
Place of birth for the foreign-born population - Sri Lanka (%)
Place of birth for the foreign-born population - Uzbekistan (%)
Place of birth for the foreign-born population - Other South Central Asia (%)
Place of birth for the foreign-born population - Burma (%)
Place of birth for the foreign-born population - Cambodia (%)
Place of birth for the foreign-born population - Indonesia (%)
Place of birth for the foreign-born population - Laos (%)
Place of birth for the foreign-born population - Malaysia (%)
Place of birth for the foreign-born population - Philippines (%)
Place of birth for the foreign-born population - Singapore (%)
Place of birth for the foreign-born population - Thailand (%)
Place of birth for the foreign-born population - Vietnam (%)
Place of birth for the foreign-born population - Other South Eastern Asia (%)
Place of birth for the foreign-born population - Armenia (%)
Place of birth for the foreign-born population - Iraq (%)
Place of birth for the foreign-born population - Israel (%)
Place of birth for the foreign-born population - Jordan (%)
Place of birth for the foreign-born population - Kuwait (%)
Place of birth for the foreign-born population - Lebanon (%)
Place of birth for the foreign-born population - Saudi Arabia (%)
Place of birth for the foreign-born population - Syria (%)
Place of birth for the foreign-born population - Turkey (%)
Place of birth for the foreign-born population - Yemen (%)
Place of birth for the foreign-born population - Other Western Asia (%)
Place of birth for the foreign-born population - Eritrea (%)
Place of birth for the foreign-born population - Ethiopia (%)
Place of birth for the foreign-born population - Kenya (%)
Place of birth for the foreign-born population - Somalia (%)
Place of birth for the foreign-born population - Uganda (%)
Place of birth for the foreign-born population - Zimbabwe (%)
Place of birth for the foreign-born population - Other Eastern Africa (%)
Place of birth for the foreign-born population - Cameroon (%)
Place of birth for the foreign-born population - Congo (%)
Place of birth for the foreign-born population - Democratic Republic of Congo (Zaire) (%)
Place of birth for the foreign-born population - Other Middle Africa (%)
Place of birth for the foreign-born population - Egypt (%)
Place of birth for the foreign-born population - Morocco (%)
Place of birth for the foreign-born population - Sudan (%)
Place of birth for the foreign-born population - Other Northern Africa (%)
Place of birth for the foreign-born population - South Africa (%)
Place of birth for the foreign-born population - Other Southern Africa (%)
Place of birth for the foreign-born population - Cabo Verde (%)
Place of birth for the foreign-born population - Ghana (%)
Place of birth for the foreign-born population - Liberia (%)
Place of birth for the foreign-born population - Nigeria (%)
Place of birth for the foreign-born population - Senegal (%)
Place of birth for the foreign-born population - Sierra Leone (%)
Place of birth for the foreign-born population - Other Western Africa (%)
Place of birth for the foreign-born population - Australia (%)
Place of birth for the foreign-born population - New Zealand (%)
Place of birth for the foreign-born population - Fiji (%)
Place of birth for the foreign-born population - Micronesia (%)
Place of birth for the foreign-born population - Bahamas (%)
Place of birth for the foreign-born population - Barbados (%)
Place of birth for the foreign-born population - Cuba (%)
Place of birth for the foreign-born population - Dominica (%)
Place of birth for the foreign-born population - Dominican Republic (%)
Place of birth for the foreign-born population - Grenada (%)
Place of birth for the foreign-born population - Haiti (%)
Place of birth for the foreign-born population - Jamaica (%)
Place of birth for the foreign-born population - St. Vincent and the Grenadines (%)
Place of birth for the foreign-born population - Trinidad and Tobago (%)
Place of birth for the foreign-born population - West Indies (%)
Place of birth for the foreign-born population - Other Caribbean (%)
Place of birth for the foreign-born population - Belize (%)
Place of birth for the foreign-born population - Costa Rica (%)
Place of birth for the foreign-born population - El Salvador (%)
Place of birth for the foreign-born population - Guatemala (%)
Place of birth for the foreign-born population - Honduras (%)
Place of birth for the foreign-born population - Mexico (%)
Place of birth for the foreign-born population - Nicaragua (%)
Place of birth for the foreign-born population - Panama (%)
Place of birth for the foreign-born population - Other Central America (%)
Place of birth for the foreign-born population - Argentina (%)
Place of birth for the foreign-born population - Bolivia (%)
Place of birth for the foreign-born population - Brazil (%)
Place of birth for the foreign-born population - Chile (%)
Place of birth for the foreign-born population - Colombia (%)
Place of birth for the foreign-born population - Ecuador (%)
Place of birth for the foreign-born population - Guyana (%)
Place of birth for the foreign-born population - Peru (%)
Place of birth for the foreign-born population - Uruguay (%)
Place of birth for the foreign-born population - Venezuela (%)
Place of birth for the foreign-born population - Other South America (%)
Place of birth for the foreign-born population - Canada (%)
Place of birth for the foreign-born population - Other Northern America (%)
Place of birth for the foreign-born population - Other (%)
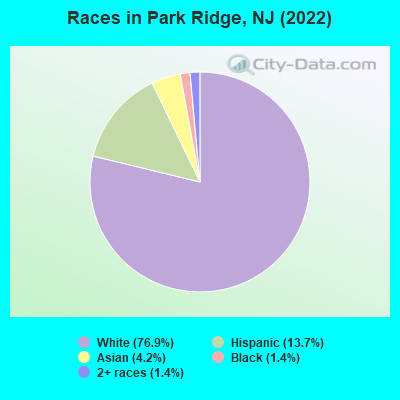
According to 2022 data, the most numerous races in Park Ridge, NJ are White alone (6,995 residents), Hispanic (1,244 residents), and Black alone (131 residents). 83.0% of Park Ridge residents speak English at home. 12.0% of Park Ridge, NJ residents are foreign-born (4.5% born in Latin America, 3.4% born in Europe, 3.3% born in Asia), which is 91.4% less than the foreign-born rate of 23.0% across the entire state of New Jersey.
Race distribution in Park Ridge
2000 2022
5,557,209 66.0% White alone 1,117,191 13.3% Hispanic 1,096,171 13.0% Black alone 477,012 5.7% Asian alone 133,689 1.6% Two or more races 19,565 0.2% Other race alone 11,338 0.1% American Indian alone 2,175 0.03% Native Hawaiian and Other
4,766,476 51.5% White alone 2,028,470 21.9% Hispanic 1,111,632 12.0% Black alone 923,546 10.0% Asian alone 332,237 3.6% Two or more races 89,847 1.0% Other race alone 8,557 0.09% American Indian alone 934 0.01% Native Hawaiian and Other
Income and house value in Park Ridge Median household income in 2022 $159,858 White non-Hispanic householders$180,160 Asian householders$146,844 Some other race householdersover $200,000 Two or more races householders$170,683 Hispanic or Latino race householdersMedian 2022 house value $707,596 White Non-Hispanic householders $627,533 Asian householders$721,925 Two or more races householders$555,204 Hispanic or Latino householders
Median age by race in Park Ridge
50.5 Median age for White residents49.5 51.6 52.9 Median age for Black or African American residents77.0 51.1 -766,197,182.3 Median age for American Indian / Alaska Native residents-686,322,685.6 -753,722,794.2 46.6 Median age for Asian residents36.9 52.2 -510,460,250.5 Median age for Native Hawaiian / Pacific Islander residents-514,767,932.0 -713,070,378.3 48.2 Median age for Other race residents49.7 46.1 39.0 Median age for Two or more races residents39.8 32.3 50.1 Median age for White alone residents49.8 50.3 36.5 Median age for Hispanic or Latino residents35.8 47.6
Owner/renter occupied households by race in Park Ridge
House owners and renters - White residents 2,290 85.2% Owner occupied399 14.8% Renter occupiedHouse owners and renters - Black or African American residents 22 100.0% Renter occupiedHouse owners and renters - Asian residents 72 67.5% Owner occupied35 32.5% Renter occupiedHouse owners and renters - Other race residents 51 49.2% Owner occupied53 50.8% Renter occupiedHouse owners and renters - Two or more races residents 177 100.0% Owner occupiedHouse owners and renters - White alone residents 2,354 85.5% Owner occupied399 14.5% Renter occupiedHouse owners and renters - Hispanic or Latino residents 214 67.8% Owner occupied101 32.2% Renter occupied
Language usage in Park Ridge
English speakers - Total 83.0% of residents of Park Ridge speak English at home.
8.8% of residents speak Spanish at home 411 52.9% Speak English very well366 47.1% Speak English less than very well7.0% of residents speak other language at home 392 63.8% Speak English very well222 36.2% Speak English less than very well
English speakers - Born in the United States 92.9% of residents of Park Ridge speak English at home.
2.3% of residents speak Spanish at home 65 100.0% Speak English very well2.2% of residents speak other language at home 45 72.6% Speak English very well17 27.4% Speak English less than very well
English speakers - Native, born elsewhere 17.1% of residents of Park Ridge speak English at home.
81.1% of residents speak Spanish at home 99 69.7% Speak English very well43 30.3% Speak English less than very well8.6% of residents speak other language at home 6 40.0% Speak English very well9 60.0% Speak English less than very well
English speakers - Foreign-born 24.8% of residents of Park Ridge speak English at home.
37.4% of residents speak Spanish at home 115 28.4% Speak English very well290 71.6% Speak English less than very well38.2% of residents speak other language at home 288 69.6% Speak English very well126 30.4% Speak English less than very well
White (Caucasian) - Speak only English Native:
98.4% (6,283)Foreign-born:
43.7% (150)
White (Caucasian) - Speak another language Native:
3.7% (236)Foreign-born:
61.4% (211)
Black or African American - Speak another language Native:
32.5% (29)Foreign-born:
85.9% (35)
Asian - Speak only English Native:
72.8% (140)Foreign-born:
38.8% (75)
Asian - Speak another language Native:
28.5% (55)Foreign-born:
60.2% (116)
Other race - Speak another language Native:
90.5% (136)Foreign-born:
100.0% (455)
Two or more races - Speak only English Native:
81.4% (388)Foreign-born:
39.4% (50)
Two or more races - Speak another language Native:
15.6% (74)Foreign-born:
56.0% (71)
White alone - Speak only English Native:
97.7% (6,161)Foreign-born:
33.6% (144)
White alone - Speak another language Native:
2.7% (169)Foreign-born:
66.0% (284)
Hispanic or Latino - Speak only English Native:
60.9% (519)Foreign-born:
3.5% (13)
Hispanic or Latino - Speak another language Native:
34.5% (294)Foreign-born:
95.7% (352)
Foreign-born residents in Park Ridge 1,093 residents are foreign born (4.5% Latin America , 3.4% Europe , 3.3% Asia ).
This city:
12.0%New Jersey:
23.2%
Marital status for residents in Park Ridge Marital status - White (Caucasian) population 15 years and over
Males 29.4% Never married64.5% Now married0.5% Separated1.7% Widowed4.0% DivorcedFemales 23.8% Never married57.8% Now married1.0% Separated10.5% Widowed6.9% DivorcedWomen who gave birth in the past 12 months Now married:
100.0% (42)Unmarried:
0.0% (0)
Women who did not give birth in the past 12 months Now married:
46.1% (586)Unmarried:
53.9% (687)
Marital status - Black or African American population 15 years and over
Males 21.1% Never married63.2% Now married0.0% Separated15.8% Widowed0.0% DivorcedFemales 40.0% Never married0.0% Now married28.4% Separated31.6% Widowed0.0% DivorcedWomen who did not give birth in the past 12 months Now married:
0.0% (0)Unmarried:
100.0% (39)
Marital status - Asian population 15 years and over
Males 25.0% Never married74.3% Now married0.0% Separated0.0% Widowed0.7% DivorcedFemales 14.2% Never married72.3% Now married2.6% Separated11.0% Widowed0.0% DivorcedWomen who did not give birth in the past 12 months Now married:
75.7% (55)Unmarried:
24.3% (18)
Marital status - Other race population 15 years and over
Males 33.3% Never married62.4% Now married0.0% Separated0.0% Widowed4.3% DivorcedFemales 48.9% Never married46.8% Now married0.0% Separated0.0% Widowed4.3% DivorcedWomen who did not give birth in the past 12 months Now married:
26.3% (46)Unmarried:
73.7% (129)
Marital status - Two or more races population 15 years and over
Males 73.8% Never married23.8% Now married2.5% Separated0.0% Widowed0.0% DivorcedFemales 35.7% Never married61.7% Now married0.0% Separated2.6% Widowed0.0% DivorcedWomen who did not give birth in the past 12 months Now married:
24.3% (38)Unmarried:
75.7% (118)
Marital status - White alone, not Hispanic / Latino population 15 years and over
Males 26.8% Never married66.8% Now married0.5% Separated1.8% Widowed4.2% DivorcedFemales 22.9% Never married57.9% Now married0.9% Separated11.0% Widowed7.3% DivorcedWomen who gave birth in the past 12 months Now married:
100.0% (48)Unmarried:
0.0% (0)
Women who did not give birth in the past 12 months Now married:
46.9% (630)Unmarried:
53.1% (713)
Marital status - Hispanic or Latino population 15 years and over
Males 62.9% Never married34.9% Now married0.9% Separated0.0% Widowed1.3% DivorcedFemales 38.7% Never married57.1% Now married1.4% Separated1.4% Widowed1.4% DivorcedWomen who did not give birth in the past 12 months Now married:
26.8% (77)Unmarried:
73.2% (211)
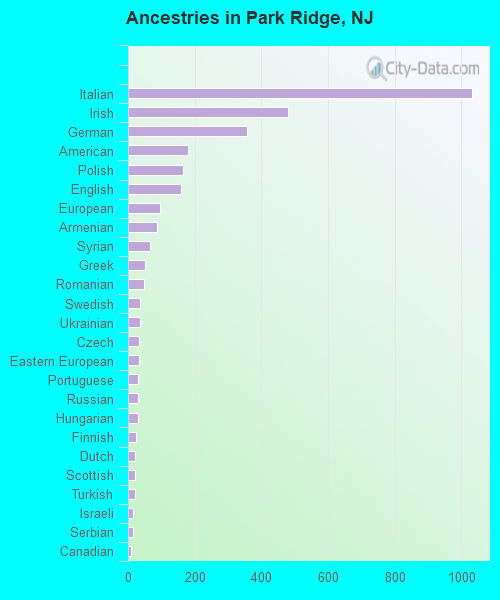
Ancestries in Park Ridge
1,031 25.9% Italian480 12.1% Irish357 9.0% German180 4.5% American164 4.1% Polish159 4.0% English95 2.4% European87 2.2% Armenian66 1.7% Syrian50 1.3% Greek49 1.2% Romanian37 0.9% Swedish36 0.9% Ukrainian34 0.9% Czech32 0.8% Eastern European31 0.8% Portuguese31 0.8% Russian29 0.7% Hungarian24 0.6% Finnish21 0.5% Dutch21 0.5% Scottish21 0.5% Turkish15 0.4% Israeli15 0.4% Serbian10 0.3% Canadian5 0.1% Arab5 0.1% Austrian2 0.05% French Canadian
Children Nativity (place of birth) in Park Ridge
Children under 6 years - Living with two parents Both parents native 295 100.0% NativeBoth parents foreign-born 18 65.5% Native9 34.5% Foreign-bornOne native, one foreign-born parent 22 100.0% NativeChildren under 6 years - Living with one parent Native parent 15 100.0% NativeChildren 6 to 17 years - Living with two parents Both parents native 833 100.0% NativeBoth parents foreign-born 84 100.0% NativeOne native, one foreign-born parent 147 100.0% NativeChildren 6 to 17 years - Living with one parent Native parent 130 100.0% NativeForeign-born parent 33 49.5% Native34 50.5% Foreign-born