Races in Park Forest Village, Pennsylvania (PA) Detailed Stats
Data:
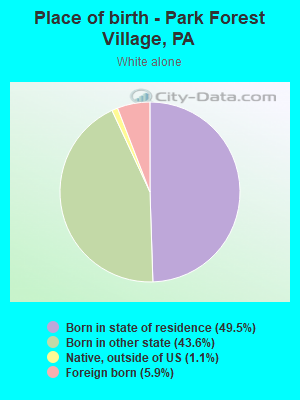
Races - White alone (%)
Races - White alone (% change since 2000)
Races - Black alone (%)
Races - Black alone (% change since 2000)
Races - American Indian alone (%)
Races - American Indian alone (% change since 2000)
Races - Asian alone (%)
Races - Asian alone (% change since 2000)
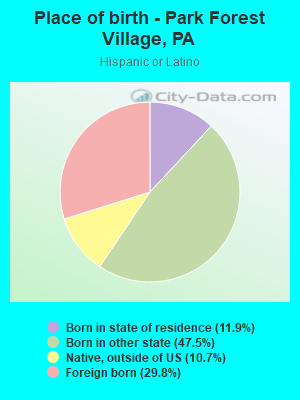
Races - Hispanic (%)
Races - Hispanic (% change since 2000)
Races - Native Hawaiian and Other Pacific Islander alone (%)
Races - Native Hawaiian and Other Pacific Islander alone (% change since 2000)
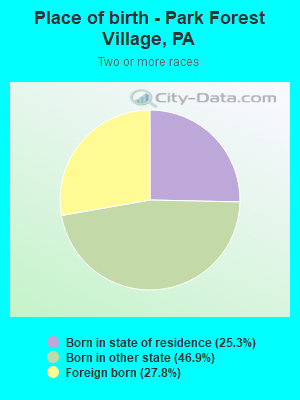
Races - Two or more races(%)
Races - Two or more races(% change since 2000)
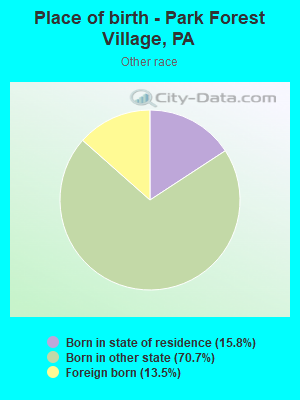
Races - Other race alone (%)
Races - Other race alone (% change since 2000)
Racial diversity
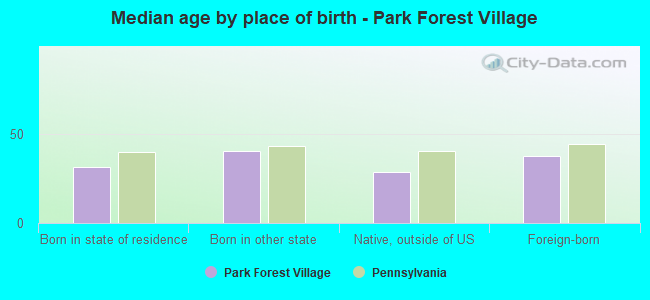
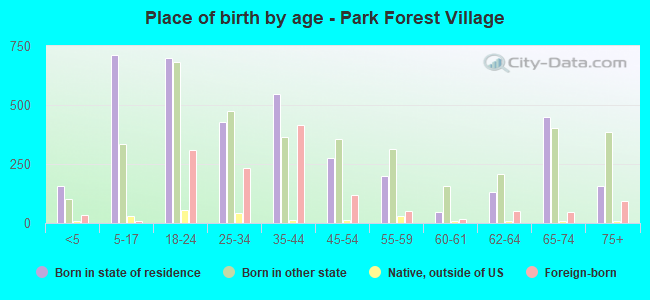
Place of birth - Born in state of residence (%)
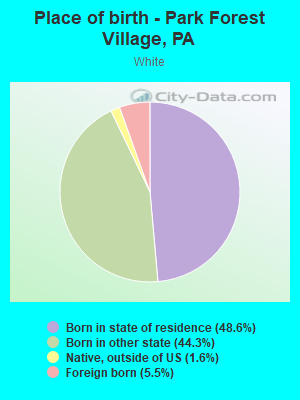
Place of birth - Born in state of residence (%) - White
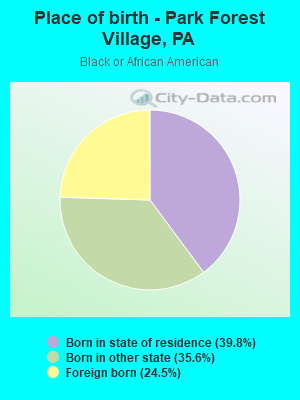
Place of birth - Born in state of residence (%) - Black or African American
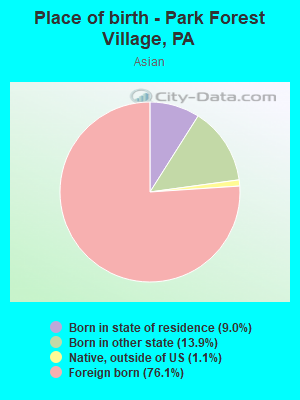
Place of birth - Born in state of residence (%) - Asian
Place of birth - Born in state of residence (%) - Hispanic or Latino
Place of birth - Born in state of residence (%) - American Indian and Alaska Native
Place of birth - Born in state of residence (%) - Multirace
Place of birth - Born in state of residence (%) - Other Race
Place of birth - Born in other state (%)
Place of birth - Born in other state (%) - White
Place of birth - Born in other state (%) - Black or African American
Place of birth - Born in other state (%) - Asian
Place of birth - Born in other state (%) - Hispanic or Latino
Place of birth - Born in other state (%) - American Indian and Alaska Native
Place of birth - Born in other state (%) - Multirace
Place of birth - Born in other state (%) - Other Race
Place of birth - Native, outside of US (%)
Place of birth - Native, outside of US (%) - White
Place of birth - Native, outside of US (%) - Black or African American
Place of birth - Native, outside of US (%) - Asian
Place of birth - Native, outside of US (%) - Hispanic or Latino
Place of birth - Native, outside of US (%) - American Indian and Alaska Native
Place of birth - Native, outside of US (%) - Multirace
Place of birth - Native, outside of US (%) - Other Race
Place of birth - Foreign born (%)
Place of birth - Foreign born (%) - White
Place of birth - Foreign born (%) - Black or African American
Place of birth - Foreign born (%) - Asian
Place of birth - Foreign born (%) - Hispanic or Latino
Place of birth - Foreign born (%) - American Indian and Alaska Native
Place of birth - Foreign born (%) - Multirace
Place of birth - Foreign born (%) - Other Race
Residents speaking English at home (%)
Residents speaking English at home - Born in the United States (%)
Residents speaking English at home - Native, born elsewhere (%)
Residents speaking English at home - Foreign born (%)
Residents speaking Spanish at home (%)
Residents speaking Spanish at home - Born in the United States (%)
Residents speaking Spanish at home - Native, born elsewhere (%)
Residents speaking Spanish at home - Foreign born (%)
Residents speaking other language at home (%)
Residents speaking other language at home - Born in the United States (%)
Residents speaking other language at home - Native, born elsewhere (%)
Residents speaking other language at home - Foreign born (%)
Marital status - Never married (%)
Marital status - Now married (%)
Marital status - Separated (%)
Marital status - Widowed (%)
Marital status - Divorced (%)
Ancestries Reported - Arab (%)
Ancestries Reported - Czech (%)
Ancestries Reported - Danish (%)
Ancestries Reported - Dutch (%)
Ancestries Reported - English (%)
Ancestries Reported - French (%)
Ancestries Reported - French Canadian (%)
Ancestries Reported - German (%)
Ancestries Reported - Greek (%)
Ancestries Reported - Hungarian (%)
Ancestries Reported - Irish (%)
Ancestries Reported - Italian (%)
Ancestries Reported - Lithuanian (%)
Ancestries Reported - Norwegian (%)
Ancestries Reported - Polish (%)
Ancestries Reported - Portuguese (%)
Ancestries Reported - Russian (%)
Ancestries Reported - Scotch-Irish (%)
Ancestries Reported - Scottish (%)
Ancestries Reported - Slovak (%)
Ancestries Reported - Subsaharan African (%)
Ancestries Reported - Swedish (%)
Ancestries Reported - Swiss (%)
Ancestries Reported - Ukrainian (%)
Ancestries Reported - United States (%)
Ancestries Reported - Welsh (%)
Ancestries Reported - West Indian (%)
Ancestries Reported - Other (%)
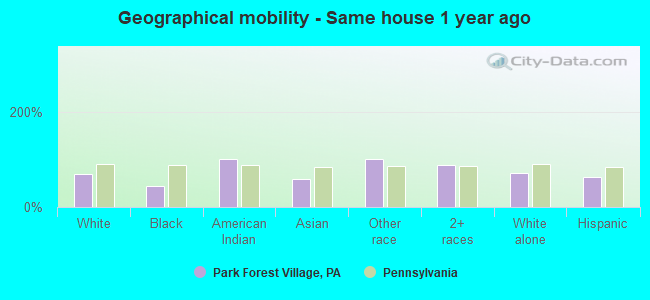
Geographical mobility - Same house 1 year ago (%)
Geographical mobility - Same house 1 year ago (%) - White
Geographical mobility - Same house 1 year ago (%) - Black or African American
Geographical mobility - Same house 1 year ago (%) - Asian
Geographical mobility - Same house 1 year ago (%) - Hispanic or Latino
Geographical mobility - Same house 1 year ago (%) - American Indian and Alaska Native
Geographical mobility - Same house 1 year ago (%) - Multirace
Geographical mobility - Same house 1 year ago (%) - Other Race
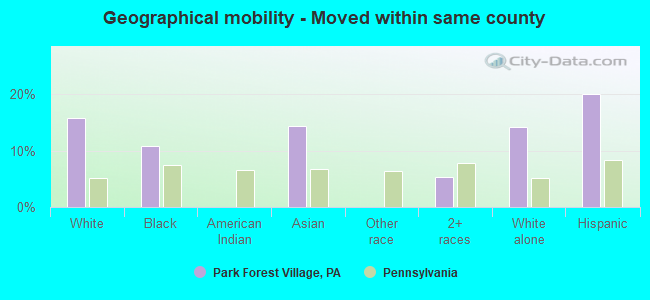
Geographical mobility - Moved within same county (%)
Geographical mobility - Moved within same county (%) - White
Geographical mobility - Moved within same county (%) - Black or African American
Geographical mobility - Moved within same county (%) - Asian
Geographical mobility - Moved within same county (%) - Hispanic or Latino
Geographical mobility - Moved within same county (%) - American Indian and Alaska Native
Geographical mobility - Moved within same county (%) - Multirace
Geographical mobility - Moved within same county (%) - Other Race
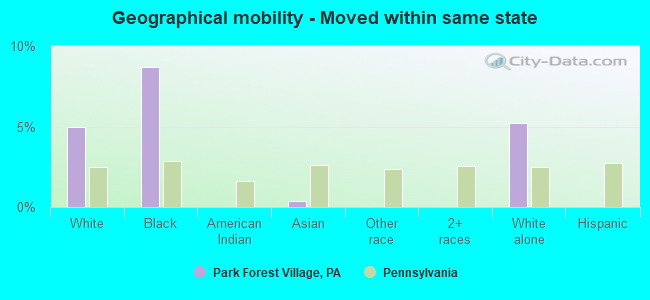
Geographical mobility - Moved from different county within same state (%)
Geographical mobility - Moved from different county within same state (%) - White
Geographical mobility - Moved from different county within same state (%) - Black or African American
Geographical mobility - Moved from different county within same state (%) - Asian
Geographical mobility - Moved from different county within same state (%) - Hispanic or Latino
Geographical mobility - Moved from different county within same state (%) - American Indian and Alaska Native
Geographical mobility - Moved from different county within same state (%) - Multirace
Geographical mobility - Moved from different county within same state (%) - Other Race
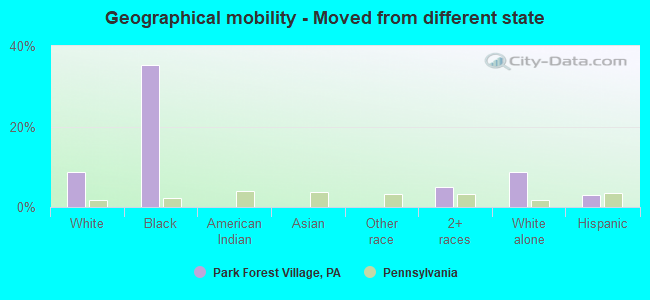
Geographical mobility - Moved from different state (%)
Geographical mobility - Moved from different state (%) - White
Geographical mobility - Moved from different state (%) - Black or African American
Geographical mobility - Moved from different state (%) - Asian
Geographical mobility - Moved from different state (%) - Hispanic or Latino
Geographical mobility - Moved from different state (%) - American Indian and Alaska Native
Geographical mobility - Moved from different state (%) - Multirace
Geographical mobility - Moved from different state (%) - Other Race
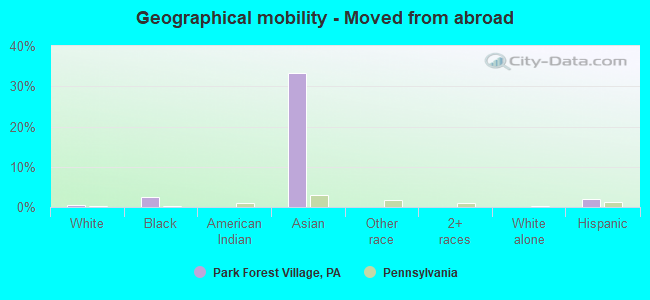
Geographical mobility - Moved from abroad (%)
Geographical mobility - Moved from abroad (%) - White
Geographical mobility - Moved from abroad (%) - Black or African American
Geographical mobility - Moved from abroad (%) - Asian
Geographical mobility - Moved from abroad (%) - Hispanic or Latino
Geographical mobility - Moved from abroad (%) - American Indian and Alaska Native
Geographical mobility - Moved from abroad (%) - Multirace
Geographical mobility - Moved from abroad (%) - Other Race
Place of birth for the foreign-born population - Ireland (%)
Place of birth for the foreign-born population - Denmark (%)
Place of birth for the foreign-born population - Norway (%)
Place of birth for the foreign-born population - Sweden (%)
Place of birth for the foreign-born population - United Kingdom (%)
Place of birth for the foreign-born population - England (%)
Place of birth for the foreign-born population - Scotland (%)
Place of birth for the foreign-born population - Other Northern Europe (%)
Place of birth for the foreign-born population - Austria (%)
Place of birth for the foreign-born population - Belgium (%)
Place of birth for the foreign-born population - France (%)
Place of birth for the foreign-born population - Germany (%)
Place of birth for the foreign-born population - Netherlands (%)
Place of birth for the foreign-born population - Switzerland (%)
Place of birth for the foreign-born population - Other Western Europe (%)
Place of birth for the foreign-born population - Greece (%)
Place of birth for the foreign-born population - Italy (%)
Place of birth for the foreign-born population - Portugal (%)
Place of birth for the foreign-born population - Spain (%)
Place of birth for the foreign-born population - Other Southern Europe (%)
Place of birth for the foreign-born population - Albania (%)
Place of birth for the foreign-born population - Belarus (%)
Place of birth for the foreign-born population - Bosnia and Herzegovina (%)
Place of birth for the foreign-born population - Bulgaria (%)
Place of birth for the foreign-born population - Croatia (%)
Place of birth for the foreign-born population - Czechoslovakia (%)
Place of birth for the foreign-born population - Hungary (%)
Place of birth for the foreign-born population - Latvia (%)
Place of birth for the foreign-born population - Lithuania (%)
Place of birth for the foreign-born population - North Macedonia (Macedonia) (%)
Place of birth for the foreign-born population - Moldova (%)
Place of birth for the foreign-born population - Poland (%)
Place of birth for the foreign-born population - Romania (%)
Place of birth for the foreign-born population - Russia (%)
Place of birth for the foreign-born population - Serbia (%)
Place of birth for the foreign-born population - Ukraine (%)
Place of birth for the foreign-born population - Other Eastern Europe (%)
Place of birth for the foreign-born population - China (%)
Place of birth for the foreign-born population - Hong Kong (%)
Place of birth for the foreign-born population - Taiwan (%)
Place of birth for the foreign-born population - Japan (%)
Place of birth for the foreign-born population - Korea (%)
Place of birth for the foreign-born population - Other Eastern Asia (%)
Place of birth for the foreign-born population - Afghanistan (%)
Place of birth for the foreign-born population - Bangladesh (%)
Place of birth for the foreign-born population - India (%)
Place of birth for the foreign-born population - Iran (%)
Place of birth for the foreign-born population - Kazakhstan (%)
Place of birth for the foreign-born population - Nepal (%)
Place of birth for the foreign-born population - Pakistan (%)
Place of birth for the foreign-born population - Sri Lanka (%)
Place of birth for the foreign-born population - Uzbekistan (%)
Place of birth for the foreign-born population - Other South Central Asia (%)
Place of birth for the foreign-born population - Burma (%)
Place of birth for the foreign-born population - Cambodia (%)
Place of birth for the foreign-born population - Indonesia (%)
Place of birth for the foreign-born population - Laos (%)
Place of birth for the foreign-born population - Malaysia (%)
Place of birth for the foreign-born population - Philippines (%)
Place of birth for the foreign-born population - Singapore (%)
Place of birth for the foreign-born population - Thailand (%)
Place of birth for the foreign-born population - Vietnam (%)
Place of birth for the foreign-born population - Other South Eastern Asia (%)
Place of birth for the foreign-born population - Armenia (%)
Place of birth for the foreign-born population - Iraq (%)
Place of birth for the foreign-born population - Israel (%)
Place of birth for the foreign-born population - Jordan (%)
Place of birth for the foreign-born population - Kuwait (%)
Place of birth for the foreign-born population - Lebanon (%)
Place of birth for the foreign-born population - Saudi Arabia (%)
Place of birth for the foreign-born population - Syria (%)
Place of birth for the foreign-born population - Turkey (%)
Place of birth for the foreign-born population - Yemen (%)
Place of birth for the foreign-born population - Other Western Asia (%)
Place of birth for the foreign-born population - Eritrea (%)
Place of birth for the foreign-born population - Ethiopia (%)
Place of birth for the foreign-born population - Kenya (%)
Place of birth for the foreign-born population - Somalia (%)
Place of birth for the foreign-born population - Uganda (%)
Place of birth for the foreign-born population - Zimbabwe (%)
Place of birth for the foreign-born population - Other Eastern Africa (%)
Place of birth for the foreign-born population - Cameroon (%)
Place of birth for the foreign-born population - Congo (%)
Place of birth for the foreign-born population - Democratic Republic of Congo (Zaire) (%)
Place of birth for the foreign-born population - Other Middle Africa (%)
Place of birth for the foreign-born population - Egypt (%)
Place of birth for the foreign-born population - Morocco (%)
Place of birth for the foreign-born population - Sudan (%)
Place of birth for the foreign-born population - Other Northern Africa (%)
Place of birth for the foreign-born population - South Africa (%)
Place of birth for the foreign-born population - Other Southern Africa (%)
Place of birth for the foreign-born population - Cabo Verde (%)
Place of birth for the foreign-born population - Ghana (%)
Place of birth for the foreign-born population - Liberia (%)
Place of birth for the foreign-born population - Nigeria (%)
Place of birth for the foreign-born population - Senegal (%)
Place of birth for the foreign-born population - Sierra Leone (%)
Place of birth for the foreign-born population - Other Western Africa (%)
Place of birth for the foreign-born population - Australia (%)
Place of birth for the foreign-born population - New Zealand (%)
Place of birth for the foreign-born population - Fiji (%)
Place of birth for the foreign-born population - Micronesia (%)
Place of birth for the foreign-born population - Bahamas (%)
Place of birth for the foreign-born population - Barbados (%)
Place of birth for the foreign-born population - Cuba (%)
Place of birth for the foreign-born population - Dominica (%)
Place of birth for the foreign-born population - Dominican Republic (%)
Place of birth for the foreign-born population - Grenada (%)
Place of birth for the foreign-born population - Haiti (%)
Place of birth for the foreign-born population - Jamaica (%)
Place of birth for the foreign-born population - St. Vincent and the Grenadines (%)
Place of birth for the foreign-born population - Trinidad and Tobago (%)
Place of birth for the foreign-born population - West Indies (%)
Place of birth for the foreign-born population - Other Caribbean (%)
Place of birth for the foreign-born population - Belize (%)
Place of birth for the foreign-born population - Costa Rica (%)
Place of birth for the foreign-born population - El Salvador (%)
Place of birth for the foreign-born population - Guatemala (%)
Place of birth for the foreign-born population - Honduras (%)
Place of birth for the foreign-born population - Mexico (%)
Place of birth for the foreign-born population - Nicaragua (%)
Place of birth for the foreign-born population - Panama (%)
Place of birth for the foreign-born population - Other Central America (%)
Place of birth for the foreign-born population - Argentina (%)
Place of birth for the foreign-born population - Bolivia (%)
Place of birth for the foreign-born population - Brazil (%)
Place of birth for the foreign-born population - Chile (%)
Place of birth for the foreign-born population - Colombia (%)
Place of birth for the foreign-born population - Ecuador (%)
Place of birth for the foreign-born population - Guyana (%)
Place of birth for the foreign-born population - Peru (%)
Place of birth for the foreign-born population - Uruguay (%)
Place of birth for the foreign-born population - Venezuela (%)
Place of birth for the foreign-born population - Other South America (%)
Place of birth for the foreign-born population - Canada (%)
Place of birth for the foreign-born population - Other Northern America (%)
Place of birth for the foreign-born population - Other (%)
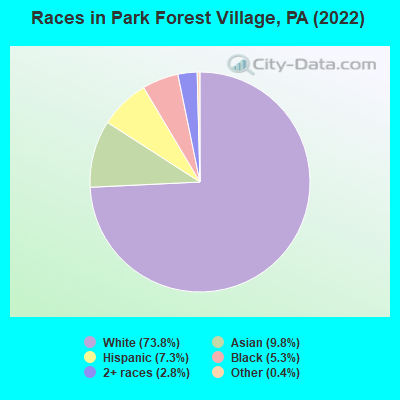
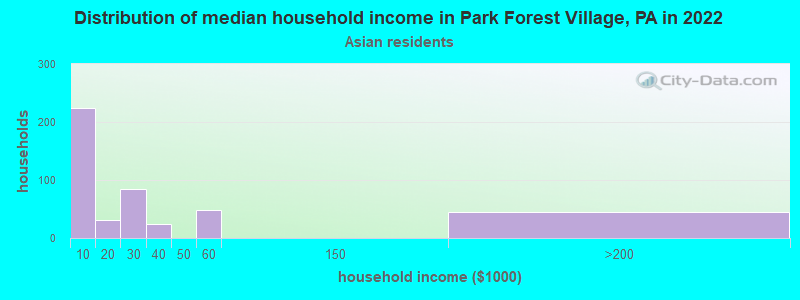
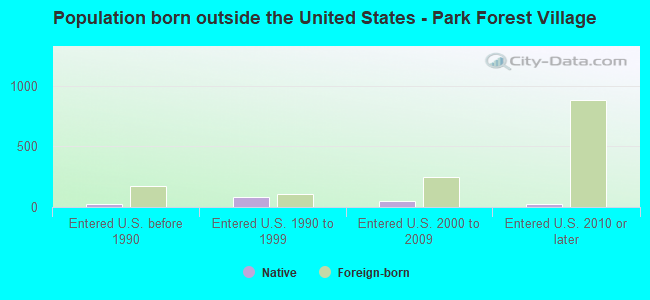
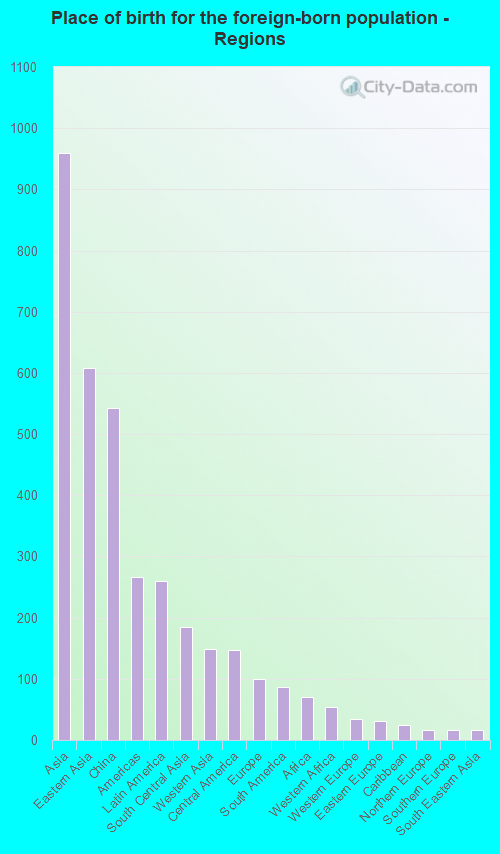
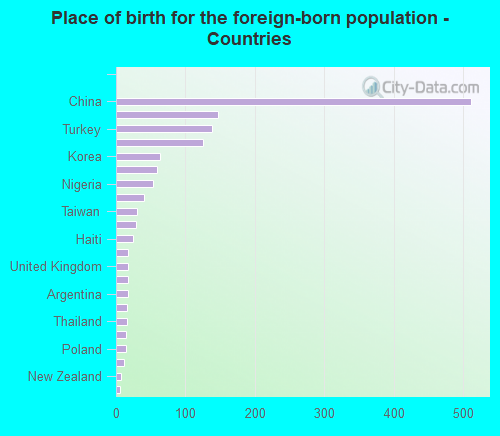
According to 2022 data, the most numerous races in Park Forest Village, PA are White alone (6,608 residents), Black alone (472 residents), and Hispanic (656 residents). 77.4% of Park Forest Village residents speak English at home. 15.7% of Park Forest Village, PA residents are foreign-born (10.3% born in Asia, 2.8% born in Latin America), which is 55.5% greater than the foreign-born rate of 7.0% across the entire state of Pennsylvania.
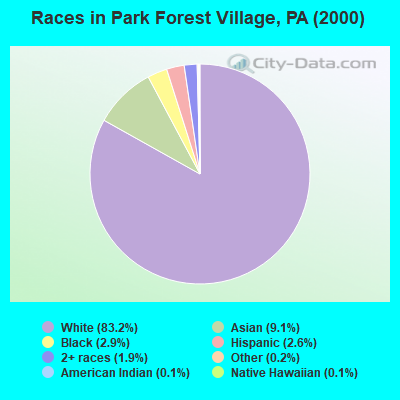
Race distribution in Park Forest Village
2000 2022
10,322,455 84.1% White alone 1,202,437 9.8% Black alone 394,088 3.2% Hispanic 218,296 1.8% Asian alone 113,097 0.9% Two or more races 13,086 0.1% Other race alone 14,904 0.1% American Indian alone 2,691 0.02% Native Hawaiian and Other
9,487,228 73.1% White alone 1,311,581 10.1% Black alone 1,115,997 8.6% Hispanic 493,942 3.8% Two or more races 487,124 3.8% Asian alone 63,582 0.5% Other race alone 10,130 0.08% American Indian alone 2,424 0.02% Native Hawaiian and Other
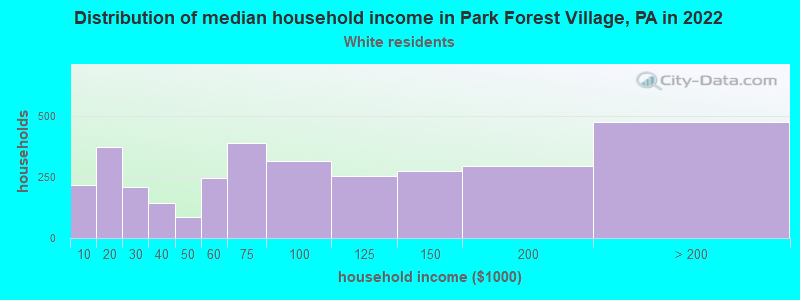
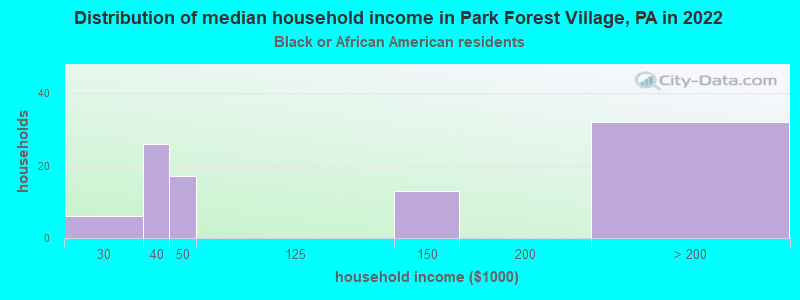
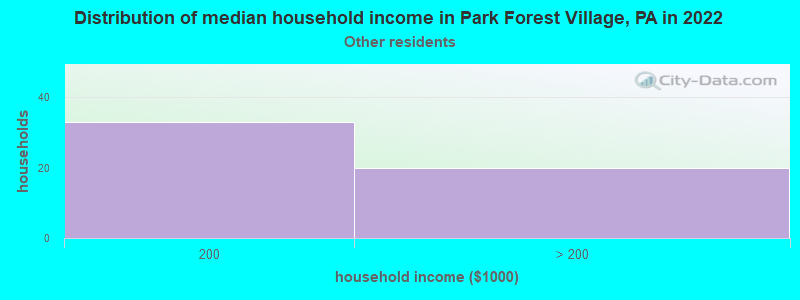
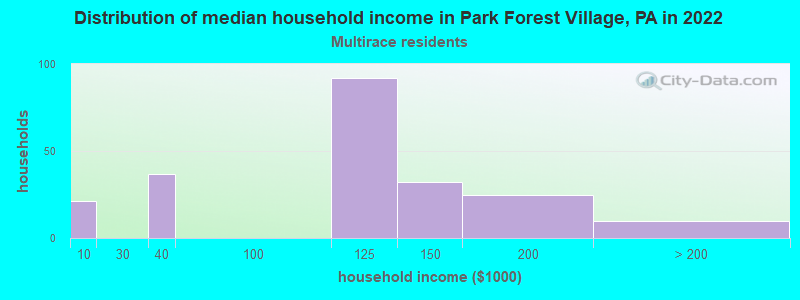
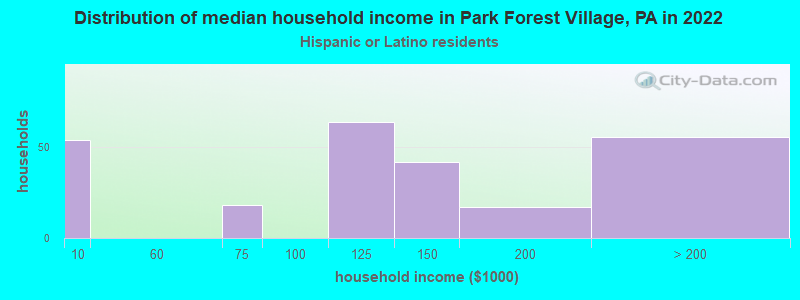
Income and house value in Park Forest Village Median household income in 2022 $71,571 White non-Hispanic householders$120,221 Two or more races householders$195,837 Hispanic or Latino race householdersMedian 2022 house value $406,567 White Non-Hispanic householders$309,904 Black or African American householders $450,384 Asian householders$431,529 Two or more races householders
Median age by race in Park Forest Village
42.3 Median age for White residents38.6 43.4 21.8 Median age for Black or African American residents22.2 19.3 -642,857,142.2 Median age for American Indian / Alaska Native residents-714,583,332.6 -577,519,379.3 32.8 Median age for Asian residents28.9 35.5 -680,432,644.4 Median age for Native Hawaiian / Pacific Islander residents-649,523,808.9 -666,666,666.0 54.4 Median age for Other race residents-533,333,332.8 55.0 24.2 Median age for Two or more races residents24.0 26.9 43.1 Median age for White alone residents39.1 43.5 27.9 Median age for Hispanic or Latino residents38.1 27.4
Owner/renter occupied households by race in Park Forest Village
House owners and renters - White residents 1,893 57.4% Owner occupied1,406 42.6% Renter occupiedHouse owners and renters - Black or African American residents 12 15.7% Owner occupied62 84.3% Renter occupiedHouse owners and renters - American Indian / Alaska Native residents 2 100.0% Renter occupiedHouse owners and renters - Asian residents 73 18.5% Owner occupied322 81.5% Renter occupiedHouse owners and renters - Other race residents 45 100.0% Owner occupiedHouse owners and renters - Two or more races residents 120 66.1% Owner occupied61 33.9% Renter occupiedHouse owners and renters - White alone residents 1,855 58.1% Owner occupied1,335 41.9% Renter occupiedHouse owners and renters - Hispanic or Latino residents 194 81.2% Owner occupied45 18.8% Renter occupied
Language usage in Park Forest Village
English speakers - Total 77.4% of residents of Park Forest Village speak English at home.
3.8% of residents speak Spanish at home 315 96.9% Speak English very well10 3.1% Speak English less than very well19.3% of residents speak other language at home 1,278 76.6% Speak English very well391 23.4% Speak English less than very well
English speakers - Born in the United States 82.9% of residents of Park Forest Village speak English at home.
3.4% of residents speak Spanish at home 121 100.0% Speak English very well16.2% of residents speak other language at home 584 100.0% Speak English very well
English speakers - Native, born elsewhere 46.1% of residents of Park Forest Village speak English at home.
18.6% of residents speak Spanish at home 31 100.0% Speak English very well22.8% of residents speak other language at home 22 57.9% Speak English very well16 42.1% Speak English less than very well
English speakers - Foreign-born 10.1% of residents of Park Forest Village speak English at home.
10.6% of residents speak Spanish at home 137 95.1% Speak English very well7 4.9% Speak English less than very well77.4% of residents speak other language at home 717 68.2% Speak English very well335 31.8% Speak English less than very well
White (Caucasian) - Speak only English Native:
92.5% (5,832)Foreign-born:
21.2% (79)
White (Caucasian) - Speak another language Native:
7.7% (486)Foreign-born:
79.5% (297)
Black or African American - Speak only English Native:
94.8% (259)Foreign-born:
18.9% (16)
Black or African American - Speak another language Native:
5.1% (14)Foreign-born:
76.1% (64)
Asian - Speak only English Native:
48.9% (85)Foreign-born:
4.6% (28)
Asian - Speak another language Native:
51.3% (89)Foreign-born:
97.5% (603)
Other race - Speak another language Native:
49.1% (23)Foreign-born:
100.0% (8)
Two or more races - Speak only English Native:
69.7% (338)Foreign-born:
10.7% (19)
Two or more races - Speak another language Native:
34.8% (169)Foreign-born:
89.0% (158)
White alone - Speak only English Native:
93.8% (5,762)Foreign-born:
21.0% (81)
White alone - Speak another language Native:
6.4% (396)Foreign-born:
80.0% (311)
Hispanic or Latino - Speak only English Native:
47.5% (202)Foreign-born:
8.7% (17)
Hispanic or Latino - Speak another language Native:
51.5% (219)Foreign-born:
91.6% (181)
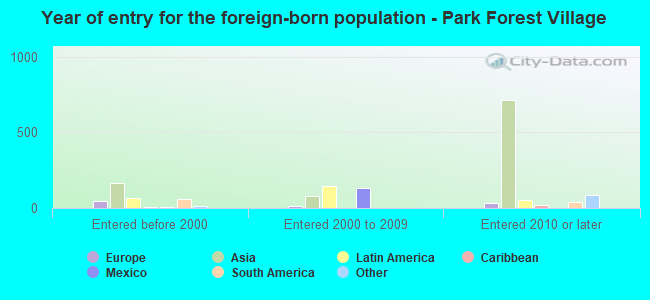
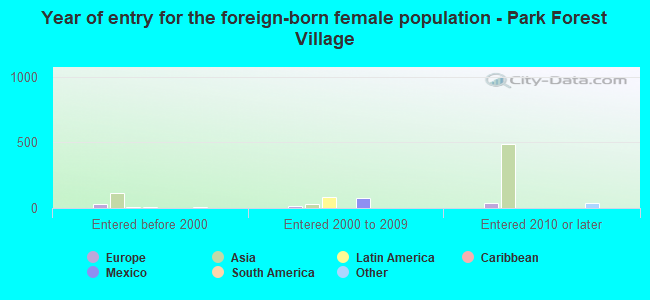
Foreign-born residents in Park Forest Village 1,406 residents are foreign born (10.3% Asia , 2.8% Latin America ).
This city:
15.7%Pennsylvania:
7.3%
Marital status for residents in Park Forest Village Marital status - White (Caucasian) population 15 years and over
Males 43.7% Never married46.9% Now married0.0% Separated0.6% Widowed8.8% DivorcedFemales 32.1% Never married52.7% Now married2.1% Separated2.4% Widowed10.7% DivorcedWomen who did not give birth in the past 12 months Now married:
45.7% (788)Unmarried:
54.3% (936)
Marital status - Black or African American population 15 years and over
Males 73.7% Never married26.3% Now married0.0% Separated0.0% Widowed0.0% DivorcedFemales 70.3% Never married29.7% Now married0.0% Separated0.0% Widowed0.0% DivorcedWomen who did not give birth in the past 12 months Now married:
23.6% (29)Unmarried:
76.4% (93)
Marital status - Asian population 15 years and over
Males 34.6% Never married65.4% Now married0.0% Separated0.0% Widowed0.0% DivorcedFemales 34.3% Never married25.5% Now married0.0% Separated5.6% Widowed34.6% DivorcedWomen who gave birth in the past 12 months Now married:
100.0% (44)Unmarried:
0.0% (0)
Women who did not give birth in the past 12 months Now married:
14.0% (55)Unmarried:
86.0% (336)
Marital status - Other race population 15 years and over
Males 0.0% Never married100.0% Now married0.0% Separated0.0% Widowed0.0% DivorcedFemales 0.0% Never married100.0% Now married0.0% Separated0.0% Widowed0.0% DivorcedWomen who did not give birth in the past 12 months Now married:
100.0% (26)Unmarried:
0.0% (0)
Marital status - Two or more races population 15 years and over
Males 45.0% Never married46.6% Now married8.4% Separated0.0% Widowed0.0% DivorcedFemales 50.7% Never married49.3% Now married0.0% Separated0.0% Widowed0.0% DivorcedWomen who did not give birth in the past 12 months Now married:
49.3% (140)Unmarried:
50.7% (145)
Marital status - White alone, not Hispanic / Latino population 15 years and over
Males 43.1% Never married47.2% Now married0.0% Separated0.6% Widowed9.1% DivorcedFemales 31.8% Never married52.7% Now married2.2% Separated2.4% Widowed10.9% DivorcedWomen who did not give birth in the past 12 months Now married:
45.4% (769)Unmarried:
54.6% (925)
Marital status - Hispanic or Latino population 15 years and over
Males 29.5% Never married70.5% Now married0.0% Separated0.0% Widowed0.0% DivorcedFemales 48.5% Never married51.5% Now married0.0% Separated0.0% Widowed0.0% DivorcedWomen who did not give birth in the past 12 months Now married:
51.5% (109)Unmarried:
48.5% (103)
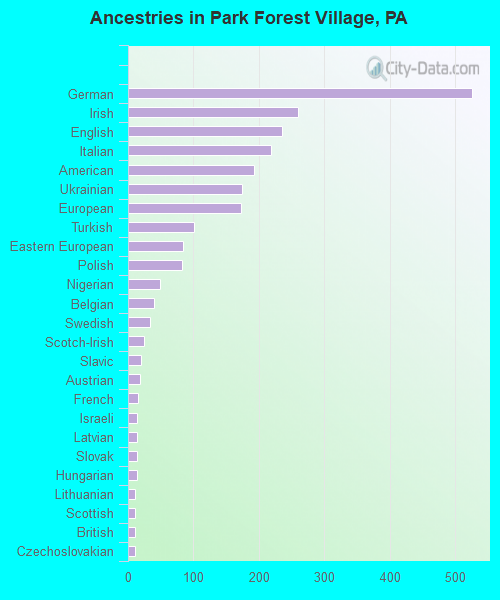
Ancestries in Park Forest Village
525 13.5% German259 6.6% Irish235 6.0% English219 5.6% Italian192 4.9% American174 4.5% Ukrainian173 4.4% European101 2.6% Turkish84 2.2% Eastern European82 2.1% Polish49 1.3% Nigerian39 1.0% Belgian34 0.9% Swedish24 0.6% Scotch-Irish20 0.5% Slavic18 0.5% Austrian16 0.4% French14 0.4% Israeli14 0.4% Latvian14 0.4% Slovak13 0.3% Hungarian11 0.3% Lithuanian11 0.3% Scottish10 0.3% British10 0.3% Czechoslovakian10 0.3% Pennsylvania German9 0.2% Haitian5 0.1% Russian4 0.1% Welsh
Children Nativity (place of birth) in Park Forest Village
Children under 6 years - Living with two parents Both parents native 97 98.7% Native1 1.3% Foreign-bornBoth parents foreign-born 150 83.1% Native30 16.9% Foreign-bornOne native, one foreign-born parent 12 100.0% NativeChildren under 6 years - Living with one parent Native parent 46 100.0% Native
Children 6 to 17 years - Living with two parents Both parents native 689 99.2% Native6 0.8% Foreign-bornBoth parents foreign-born 74 100.0% NativeOne native, one foreign-born parent 44 100.0% NativeChildren 6 to 17 years - Living with one parent Native parent 222 100.0% Native