Races in Park Forest, Illinois (IL) Detailed Stats
Data:
Races - White alone (%)
Races - White alone (% change since 2000)
Races - Black alone (%)
Races - Black alone (% change since 2000)
Races - American Indian alone (%)
Races - American Indian alone (% change since 2000)
Races - Asian alone (%)
Races - Asian alone (% change since 2000)
Races - Hispanic (%)
Races - Hispanic (% change since 2000)
Races - Native Hawaiian and Other Pacific Islander alone (%)
Races - Native Hawaiian and Other Pacific Islander alone (% change since 2000)
Races - Two or more races(%)
Races - Two or more races(% change since 2000)
Races - Other race alone (%)
Races - Other race alone (% change since 2000)
Racial diversity
Place of birth - Born in state of residence (%)
Place of birth - Born in state of residence (%) - White
Place of birth - Born in state of residence (%) - Black or African American
Place of birth - Born in state of residence (%) - Asian
Place of birth - Born in state of residence (%) - Hispanic or Latino
Place of birth - Born in state of residence (%) - American Indian and Alaska Native
Place of birth - Born in state of residence (%) - Multirace
Place of birth - Born in state of residence (%) - Other Race
Place of birth - Born in other state (%)
Place of birth - Born in other state (%) - White
Place of birth - Born in other state (%) - Black or African American
Place of birth - Born in other state (%) - Asian
Place of birth - Born in other state (%) - Hispanic or Latino
Place of birth - Born in other state (%) - American Indian and Alaska Native
Place of birth - Born in other state (%) - Multirace
Place of birth - Born in other state (%) - Other Race
Place of birth - Native, outside of US (%)
Place of birth - Native, outside of US (%) - White
Place of birth - Native, outside of US (%) - Black or African American
Place of birth - Native, outside of US (%) - Asian
Place of birth - Native, outside of US (%) - Hispanic or Latino
Place of birth - Native, outside of US (%) - American Indian and Alaska Native
Place of birth - Native, outside of US (%) - Multirace
Place of birth - Native, outside of US (%) - Other Race
Place of birth - Foreign born (%)
Place of birth - Foreign born (%) - White
Place of birth - Foreign born (%) - Black or African American
Place of birth - Foreign born (%) - Asian
Place of birth - Foreign born (%) - Hispanic or Latino
Place of birth - Foreign born (%) - American Indian and Alaska Native
Place of birth - Foreign born (%) - Multirace
Place of birth - Foreign born (%) - Other Race
Residents speaking English at home (%)
Residents speaking English at home - Born in the United States (%)
Residents speaking English at home - Native, born elsewhere (%)
Residents speaking English at home - Foreign born (%)
Residents speaking Spanish at home (%)
Residents speaking Spanish at home - Born in the United States (%)
Residents speaking Spanish at home - Native, born elsewhere (%)
Residents speaking Spanish at home - Foreign born (%)
Residents speaking other language at home (%)
Residents speaking other language at home - Born in the United States (%)
Residents speaking other language at home - Native, born elsewhere (%)
Residents speaking other language at home - Foreign born (%)
Marital status - Never married (%)
Marital status - Now married (%)
Marital status - Separated (%)
Marital status - Widowed (%)
Marital status - Divorced (%)
Ancestries Reported - Arab (%)
Ancestries Reported - Czech (%)
Ancestries Reported - Danish (%)
Ancestries Reported - Dutch (%)
Ancestries Reported - English (%)
Ancestries Reported - French (%)
Ancestries Reported - French Canadian (%)
Ancestries Reported - German (%)
Ancestries Reported - Greek (%)
Ancestries Reported - Hungarian (%)
Ancestries Reported - Irish (%)
Ancestries Reported - Italian (%)
Ancestries Reported - Lithuanian (%)
Ancestries Reported - Norwegian (%)
Ancestries Reported - Polish (%)
Ancestries Reported - Portuguese (%)
Ancestries Reported - Russian (%)
Ancestries Reported - Scotch-Irish (%)
Ancestries Reported - Scottish (%)
Ancestries Reported - Slovak (%)
Ancestries Reported - Subsaharan African (%)
Ancestries Reported - Swedish (%)
Ancestries Reported - Swiss (%)
Ancestries Reported - Ukrainian (%)
Ancestries Reported - United States (%)
Ancestries Reported - Welsh (%)
Ancestries Reported - West Indian (%)
Ancestries Reported - Other (%)
Geographical mobility - Same house 1 year ago (%)
Geographical mobility - Same house 1 year ago (%) - White
Geographical mobility - Same house 1 year ago (%) - Black or African American
Geographical mobility - Same house 1 year ago (%) - Asian
Geographical mobility - Same house 1 year ago (%) - Hispanic or Latino
Geographical mobility - Same house 1 year ago (%) - American Indian and Alaska Native
Geographical mobility - Same house 1 year ago (%) - Multirace
Geographical mobility - Same house 1 year ago (%) - Other Race
Geographical mobility - Moved within same county (%)
Geographical mobility - Moved within same county (%) - White
Geographical mobility - Moved within same county (%) - Black or African American
Geographical mobility - Moved within same county (%) - Asian
Geographical mobility - Moved within same county (%) - Hispanic or Latino
Geographical mobility - Moved within same county (%) - American Indian and Alaska Native
Geographical mobility - Moved within same county (%) - Multirace
Geographical mobility - Moved within same county (%) - Other Race
Geographical mobility - Moved from different county within same state (%)
Geographical mobility - Moved from different county within same state (%) - White
Geographical mobility - Moved from different county within same state (%) - Black or African American
Geographical mobility - Moved from different county within same state (%) - Asian
Geographical mobility - Moved from different county within same state (%) - Hispanic or Latino
Geographical mobility - Moved from different county within same state (%) - American Indian and Alaska Native
Geographical mobility - Moved from different county within same state (%) - Multirace
Geographical mobility - Moved from different county within same state (%) - Other Race
Geographical mobility - Moved from different state (%)
Geographical mobility - Moved from different state (%) - White
Geographical mobility - Moved from different state (%) - Black or African American
Geographical mobility - Moved from different state (%) - Asian
Geographical mobility - Moved from different state (%) - Hispanic or Latino
Geographical mobility - Moved from different state (%) - American Indian and Alaska Native
Geographical mobility - Moved from different state (%) - Multirace
Geographical mobility - Moved from different state (%) - Other Race
Geographical mobility - Moved from abroad (%)
Geographical mobility - Moved from abroad (%) - White
Geographical mobility - Moved from abroad (%) - Black or African American
Geographical mobility - Moved from abroad (%) - Asian
Geographical mobility - Moved from abroad (%) - Hispanic or Latino
Geographical mobility - Moved from abroad (%) - American Indian and Alaska Native
Geographical mobility - Moved from abroad (%) - Multirace
Geographical mobility - Moved from abroad (%) - Other Race
Place of birth for the foreign-born population - Ireland (%)
Place of birth for the foreign-born population - Denmark (%)
Place of birth for the foreign-born population - Norway (%)
Place of birth for the foreign-born population - Sweden (%)
Place of birth for the foreign-born population - United Kingdom (%)
Place of birth for the foreign-born population - England (%)
Place of birth for the foreign-born population - Scotland (%)
Place of birth for the foreign-born population - Other Northern Europe (%)
Place of birth for the foreign-born population - Austria (%)
Place of birth for the foreign-born population - Belgium (%)
Place of birth for the foreign-born population - France (%)
Place of birth for the foreign-born population - Germany (%)
Place of birth for the foreign-born population - Netherlands (%)
Place of birth for the foreign-born population - Switzerland (%)
Place of birth for the foreign-born population - Other Western Europe (%)
Place of birth for the foreign-born population - Greece (%)
Place of birth for the foreign-born population - Italy (%)
Place of birth for the foreign-born population - Portugal (%)
Place of birth for the foreign-born population - Spain (%)
Place of birth for the foreign-born population - Other Southern Europe (%)
Place of birth for the foreign-born population - Albania (%)
Place of birth for the foreign-born population - Belarus (%)
Place of birth for the foreign-born population - Bosnia and Herzegovina (%)
Place of birth for the foreign-born population - Bulgaria (%)
Place of birth for the foreign-born population - Croatia (%)
Place of birth for the foreign-born population - Czechoslovakia (%)
Place of birth for the foreign-born population - Hungary (%)
Place of birth for the foreign-born population - Latvia (%)
Place of birth for the foreign-born population - Lithuania (%)
Place of birth for the foreign-born population - North Macedonia (Macedonia) (%)
Place of birth for the foreign-born population - Moldova (%)
Place of birth for the foreign-born population - Poland (%)
Place of birth for the foreign-born population - Romania (%)
Place of birth for the foreign-born population - Russia (%)
Place of birth for the foreign-born population - Serbia (%)
Place of birth for the foreign-born population - Ukraine (%)
Place of birth for the foreign-born population - Other Eastern Europe (%)
Place of birth for the foreign-born population - China (%)
Place of birth for the foreign-born population - Hong Kong (%)
Place of birth for the foreign-born population - Taiwan (%)
Place of birth for the foreign-born population - Japan (%)
Place of birth for the foreign-born population - Korea (%)
Place of birth for the foreign-born population - Other Eastern Asia (%)
Place of birth for the foreign-born population - Afghanistan (%)
Place of birth for the foreign-born population - Bangladesh (%)
Place of birth for the foreign-born population - India (%)
Place of birth for the foreign-born population - Iran (%)
Place of birth for the foreign-born population - Kazakhstan (%)
Place of birth for the foreign-born population - Nepal (%)
Place of birth for the foreign-born population - Pakistan (%)
Place of birth for the foreign-born population - Sri Lanka (%)
Place of birth for the foreign-born population - Uzbekistan (%)
Place of birth for the foreign-born population - Other South Central Asia (%)
Place of birth for the foreign-born population - Burma (%)
Place of birth for the foreign-born population - Cambodia (%)
Place of birth for the foreign-born population - Indonesia (%)
Place of birth for the foreign-born population - Laos (%)
Place of birth for the foreign-born population - Malaysia (%)
Place of birth for the foreign-born population - Philippines (%)
Place of birth for the foreign-born population - Singapore (%)
Place of birth for the foreign-born population - Thailand (%)
Place of birth for the foreign-born population - Vietnam (%)
Place of birth for the foreign-born population - Other South Eastern Asia (%)
Place of birth for the foreign-born population - Armenia (%)
Place of birth for the foreign-born population - Iraq (%)
Place of birth for the foreign-born population - Israel (%)
Place of birth for the foreign-born population - Jordan (%)
Place of birth for the foreign-born population - Kuwait (%)
Place of birth for the foreign-born population - Lebanon (%)
Place of birth for the foreign-born population - Saudi Arabia (%)
Place of birth for the foreign-born population - Syria (%)
Place of birth for the foreign-born population - Turkey (%)
Place of birth for the foreign-born population - Yemen (%)
Place of birth for the foreign-born population - Other Western Asia (%)
Place of birth for the foreign-born population - Eritrea (%)
Place of birth for the foreign-born population - Ethiopia (%)
Place of birth for the foreign-born population - Kenya (%)
Place of birth for the foreign-born population - Somalia (%)
Place of birth for the foreign-born population - Uganda (%)
Place of birth for the foreign-born population - Zimbabwe (%)
Place of birth for the foreign-born population - Other Eastern Africa (%)
Place of birth for the foreign-born population - Cameroon (%)
Place of birth for the foreign-born population - Congo (%)
Place of birth for the foreign-born population - Democratic Republic of Congo (Zaire) (%)
Place of birth for the foreign-born population - Other Middle Africa (%)
Place of birth for the foreign-born population - Egypt (%)
Place of birth for the foreign-born population - Morocco (%)
Place of birth for the foreign-born population - Sudan (%)
Place of birth for the foreign-born population - Other Northern Africa (%)
Place of birth for the foreign-born population - South Africa (%)
Place of birth for the foreign-born population - Other Southern Africa (%)
Place of birth for the foreign-born population - Cabo Verde (%)
Place of birth for the foreign-born population - Ghana (%)
Place of birth for the foreign-born population - Liberia (%)
Place of birth for the foreign-born population - Nigeria (%)
Place of birth for the foreign-born population - Senegal (%)
Place of birth for the foreign-born population - Sierra Leone (%)
Place of birth for the foreign-born population - Other Western Africa (%)
Place of birth for the foreign-born population - Australia (%)
Place of birth for the foreign-born population - New Zealand (%)
Place of birth for the foreign-born population - Fiji (%)
Place of birth for the foreign-born population - Micronesia (%)
Place of birth for the foreign-born population - Bahamas (%)
Place of birth for the foreign-born population - Barbados (%)
Place of birth for the foreign-born population - Cuba (%)
Place of birth for the foreign-born population - Dominica (%)
Place of birth for the foreign-born population - Dominican Republic (%)
Place of birth for the foreign-born population - Grenada (%)
Place of birth for the foreign-born population - Haiti (%)
Place of birth for the foreign-born population - Jamaica (%)
Place of birth for the foreign-born population - St. Vincent and the Grenadines (%)
Place of birth for the foreign-born population - Trinidad and Tobago (%)
Place of birth for the foreign-born population - West Indies (%)
Place of birth for the foreign-born population - Other Caribbean (%)
Place of birth for the foreign-born population - Belize (%)
Place of birth for the foreign-born population - Costa Rica (%)
Place of birth for the foreign-born population - El Salvador (%)
Place of birth for the foreign-born population - Guatemala (%)
Place of birth for the foreign-born population - Honduras (%)
Place of birth for the foreign-born population - Mexico (%)
Place of birth for the foreign-born population - Nicaragua (%)
Place of birth for the foreign-born population - Panama (%)
Place of birth for the foreign-born population - Other Central America (%)
Place of birth for the foreign-born population - Argentina (%)
Place of birth for the foreign-born population - Bolivia (%)
Place of birth for the foreign-born population - Brazil (%)
Place of birth for the foreign-born population - Chile (%)
Place of birth for the foreign-born population - Colombia (%)
Place of birth for the foreign-born population - Ecuador (%)
Place of birth for the foreign-born population - Guyana (%)
Place of birth for the foreign-born population - Peru (%)
Place of birth for the foreign-born population - Uruguay (%)
Place of birth for the foreign-born population - Venezuela (%)
Place of birth for the foreign-born population - Other South America (%)
Place of birth for the foreign-born population - Canada (%)
Place of birth for the foreign-born population - Other Northern America (%)
Place of birth for the foreign-born population - Other (%)
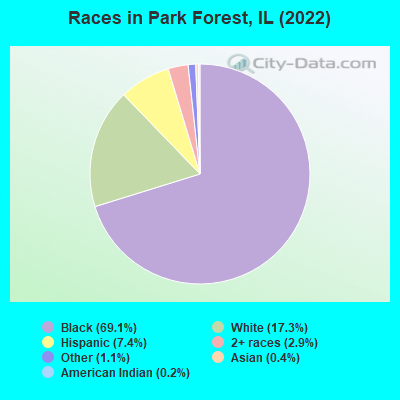
According to 2022 data, the most numerous races in Park Forest, IL are White alone (3,567 residents), Hispanic (1,521 residents), and Black alone (14,210 residents). 91.2% of Park Forest residents speak English at home. 4.8% of Park Forest, IL residents are foreign-born (2.2% born in Latin America, 1.4% born in Africa, 0.7% born in Europe), which is 194.5% less than the foreign-born rate of 14.0% across the entire state of Illinois.
Race distribution in Park Forest
2000 2022
8,424,140 67.8% White alone 1,856,152 14.9% Black alone 1,530,262 12.3% Hispanic 419,916 3.4% Asian alone 153,996 1.2% Two or more races 13,479 0.1% Other race alone 18,232 0.1% American Indian alone 3,116 0.03% Native Hawaiian and Other
7,356,301 58.5% White alone 2,299,726 18.3% Hispanic 1,660,423 13.2% Black alone 747,296 5.9% Asian alone 458,599 3.6% Two or more races 45,386 0.4% Other race alone 10,405 0.08% American Indian alone 3,896 0.03% Native Hawaiian and Other
Income and house value in Park Forest Median household income in 2022 $57,538 White non-Hispanic householders$57,402 Black householders$107,154 American Indian and Alaska Native householders$47,588 Some other race householders$52,235 Two or more races householders$64,135 Hispanic or Latino race householdersMedian 2022 house value $98,467 White Non-Hispanic householders$99,752 Black or African American householders$80,129 American Indian or Alaska Native householders $112,601 Asian householders$97,065 Some other race householders$90,524 Two or more races householders$100,686 Hispanic or Latino householders
Median age by race in Park Forest
56.4 Median age for White residents50.7 58.8 33.9 Median age for Black or African American residents28.3 39.3 17.0 Median age for American Indian / Alaska Native residents41.0 12.1 74.3 Median age for Asian residents71.2 -683,893,194.8 -687,999,999.3 Median age for Native Hawaiian / Pacific Islander residents-918,721,460.3 -610,229,276.3 25.8 Median age for Other race residents26.1 24.7 26.8 Median age for Two or more races residents26.3 29.7 57.0 Median age for White alone residents52.4 58.1 35.4 Median age for Hispanic or Latino residents39.2 32.0
Owner/renter occupied households by race in Park Forest
House owners and renters - White residents 1,348 77.4% Owner occupied394 22.6% Renter occupiedHouse owners and renters - Black or African American residents 3,063 54.7% Owner occupied2,541 45.3% Renter occupiedHouse owners and renters - American Indian / Alaska Native residents 90 71.3% Owner occupied36 28.7% Renter occupiedHouse owners and renters - Asian residents 6 11.4% Owner occupied43 88.6% Renter occupiedHouse owners and renters - Other race residents 261 90.5% Owner occupied27 9.5% Renter occupiedHouse owners and renters - Two or more races residents 211 66.9% Owner occupied104 33.1% Renter occupiedHouse owners and renters - White alone residents 1,381 76.6% Owner occupied422 23.4% Renter occupiedHouse owners and renters - Hispanic or Latino residents 337 73.6% Owner occupied121 26.4% Renter occupied
Language usage in Park Forest
English speakers - Total 91.2% of residents of Park Forest speak English at home.
5.9% of residents speak Spanish at home 457 39.0% Speak English very well716 61.0% Speak English less than very well2.1% of residents speak other language at home 330 79.3% Speak English very well86 20.7% Speak English less than very well
English speakers - Born in the United States 97.7% of residents of Park Forest speak English at home.
0.9% of residents speak Spanish at home 29 100.0% Speak English very well1.0% of residents speak other language at home 32 100.0% Speak English very well
English speakers - Native, born elsewhere 86.2% of residents of Park Forest speak English at home.
14.5% of residents speak Spanish at home 23 100.0% Speak English less than very well
English speakers - Foreign-born 31.3% of residents of Park Forest speak English at home.
44.8% of residents speak Spanish at home 111 25.3% Speak English very well327 74.7% Speak English less than very well22.4% of residents speak other language at home 132 60.3% Speak English very well87 39.7% Speak English less than very well
White (Caucasian) - Speak only English Native:
96.1% (3,044)Foreign-born:
64.4% (197)
White (Caucasian) - Speak another language Native:
6.0% (190)Foreign-born:
39.4% (120)
Black or African American - Speak only English Native:
99.2% (13,513)Foreign-born:
64.2% (77)
Black or African American - Speak another language Native:
0.8% (109)Foreign-born:
42.1% (51)
American Indian / Alaska Native - Speak another language Native:
83.1% (266)Foreign-born:
100.0% (124)
Asian - Speak another language Native:
60.2% (30)Foreign-born:
100.0% (32)
Other race - Speak only English Native:
51.1% (382)Foreign-born:
4.4% (15)
Other race - Speak another language Native:
51.2% (382)Foreign-born:
95.6% (315)
Two or more races - Speak another language Native:
3.0% (20)Foreign-born:
100.0% (89)
White alone - Speak only English Native:
96.9% (3,003)Foreign-born:
59.0% (218)
White alone - Speak another language Native:
2.6% (80)Foreign-born:
36.0% (133)
Hispanic or Latino - Speak only English Native:
30.4% (309)Foreign-born:
2.9% (13)
Hispanic or Latino - Speak another language Native:
69.5% (707)Foreign-born:
97.3% (427)
Foreign-born residents in Park Forest 978 residents are foreign born (2.2% Latin America , 1.4% Africa , 0.7% Europe ).
This city:
4.8%Illinois:
14.1%
Marital status for residents in Park Forest Marital status - White (Caucasian) population 15 years and over
Males 33.0% Never married49.6% Now married0.0% Separated4.1% Widowed13.3% DivorcedFemales 25.8% Never married37.1% Now married3.0% Separated14.9% Widowed19.2% DivorcedWomen who gave birth in the past 12 months Now married:
100.0% (19)Unmarried:
0.0% (0)
Women who did not give birth in the past 12 months Now married:
47.4% (242)Unmarried:
52.6% (268)
Marital status - Black or African American population 15 years and over
Males 59.9% Never married29.3% Now married0.8% Separated3.4% Widowed6.6% DivorcedFemales 42.4% Never married22.8% Now married3.7% Separated11.3% Widowed19.8% DivorcedWomen who gave birth in the past 12 months Now married:
87.7% (67)Unmarried:
12.3% (9)
Women who did not give birth in the past 12 months Now married:
28.3% (1,104)Unmarried:
71.7% (2,800)
Marital status - American Indian / Alaska Native population 15 years and over
Males 33.1% Never married66.9% Now married0.0% Separated0.0% Widowed0.0% DivorcedFemales 0.0% Never married100.0% Now married0.0% Separated0.0% Widowed0.0% DivorcedWomen who did not give birth in the past 12 months Now married:
100.0% (65)Unmarried:
0.0% (0)
Marital status - Asian population 15 years and over
Males 91.5% Never married8.5% Now married0.0% Separated0.0% Widowed0.0% DivorcedFemales 0.0% Never married23.8% Now married0.0% Separated76.2% Widowed0.0% DivorcedMarital status - Other race population 15 years and over
Males 41.5% Never married52.2% Now married0.0% Separated1.6% Widowed4.7% DivorcedFemales 36.2% Never married58.9% Now married0.0% Separated0.9% Widowed4.1% DivorcedWomen who gave birth in the past 12 months Now married:
100.0% (26)Unmarried:
0.0% (0)
Women who did not give birth in the past 12 months Now married:
53.7% (181)Unmarried:
46.3% (156)
Marital status - Two or more races population 15 years and over
Males 29.9% Never married59.2% Now married6.5% Separated0.0% Widowed4.3% DivorcedFemales 45.1% Never married42.0% Now married0.0% Separated0.0% Widowed12.9% DivorcedWomen who did not give birth in the past 12 months Now married:
30.8% (78)Unmarried:
69.2% (175)
Marital status - White alone, not Hispanic / Latino population 15 years and over
Males 35.1% Never married45.3% Now married0.0% Separated4.6% Widowed14.9% DivorcedFemales 25.4% Never married36.9% Now married3.1% Separated15.4% Widowed19.2% DivorcedWomen who gave birth in the past 12 months Now married:
100.0% (21)Unmarried:
0.0% (0)
Women who did not give birth in the past 12 months Now married:
48.3% (260)Unmarried:
51.7% (278)
Marital status - Hispanic or Latino population 15 years and over
Males 28.9% Never married64.1% Now married2.0% Separated1.0% Widowed4.1% DivorcedFemales 31.8% Never married59.4% Now married0.0% Separated3.4% Widowed5.3% DivorcedWomen who gave birth in the past 12 months Now married:
100.0% (23)Unmarried:
0.0% (0)
Women who did not give birth in the past 12 months Now married:
57.3% (219)Unmarried:
42.7% (163)
Ancestries in Park Forest
499 3.6% African198 1.4% English184 1.3% American182 1.3% German148 1.1% Irish122 0.9% Swedish111 0.8% Nigerian82 0.6% Polish80 0.6% Yugoslavian70 0.5% Italian41 0.3% Norwegian35 0.3% Dutch32 0.2% Jamaican29 0.2% European26 0.2% Scandinavian25 0.2% Scotch-Irish21 0.2% Swiss20 0.1% Czech18 0.1% Hungarian18 0.1% Iranian15 0.1% French Canadian10 0.07% Bulgarian10 0.07% Ghanaian8 0.06% French7 0.05% Haitian5 0.04% British5 0.04% Scottish
Children Nativity (place of birth) in Park Forest
Children under 6 years - Living with two parents Both parents native 390 100.0% NativeBoth parents foreign-born 26 100.0% NativeOne native, one foreign-born parent 18 100.0% NativeChildren under 6 years - Living with one parent Native parent 536 100.0% Native
Children 6 to 17 years - Living with two parents Both parents native 1,269 100.0% NativeBoth parents foreign-born 362 100.0% NativeOne native, one foreign-born parent 82 100.0% NativeChildren 6 to 17 years - Living with one parent Native parent 2,145 99.4% Native14 0.6% Foreign-bornForeign-born parent 13 100.0% Native
Grandparents responsible for own grandchildren in Park Forest
Grandparents (30 to 59 years) White / Caucasian 3 22.0% Responsible for grandchildren11 78.0% Not responsible for grandchildrenBlack or African American 35 16.0% Responsible for grandchildren184 84.0% Not responsible for grandchildrenWhite alone, not Hispanic / Latino 4 30.4% Responsible for grandchildren10 69.6% Not responsible for grandchildrenGrandparents (60 years and over) White / Caucasian 9 24.7% Responsible for grandchildren28 75.3% Not responsible for grandchildrenBlack or African American 45 12.8% Responsible for grandchildren302 87.2% Not responsible for grandchildrenWhite alone, not Hispanic / Latino 11 23.7% Responsible for grandchildren35 76.3% Not responsible for grandchildren