Races in Park City, Kansas (KS) Detailed Stats
Data:
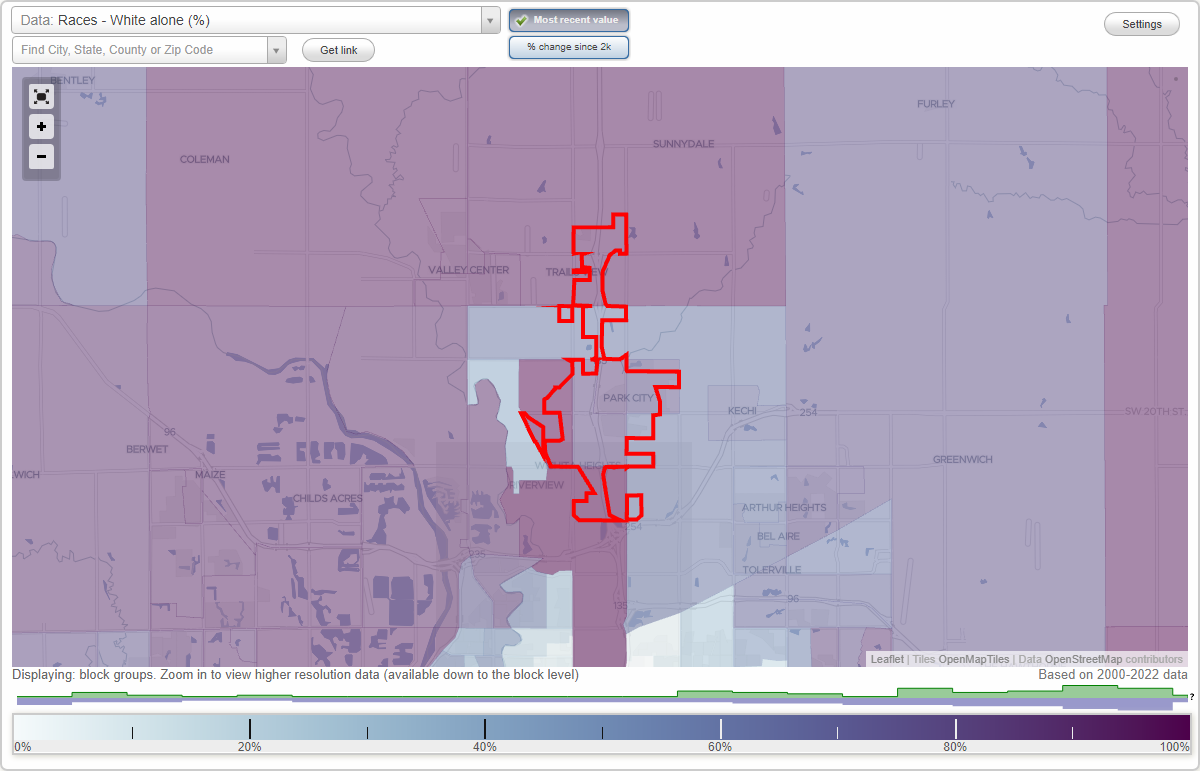
Races - White alone (%)
Races - White alone (% change since 2000)
Races - Black alone (%)
Races - Black alone (% change since 2000)
Races - American Indian alone (%)
Races - American Indian alone (% change since 2000)
Races - Asian alone (%)
Races - Asian alone (% change since 2000)
Races - Hispanic (%)
Races - Hispanic (% change since 2000)
Races - Native Hawaiian and Other Pacific Islander alone (%)
Races - Native Hawaiian and Other Pacific Islander alone (% change since 2000)
Races - Two or more races(%)
Races - Two or more races(% change since 2000)
Races - Other race alone (%)
Races - Other race alone (% change since 2000)
Racial diversity
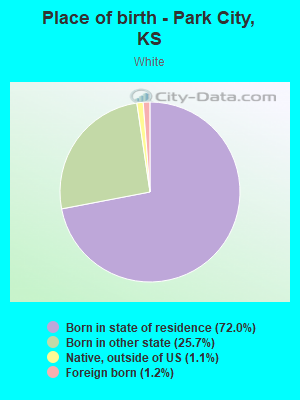
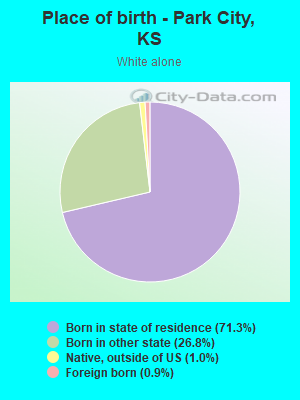
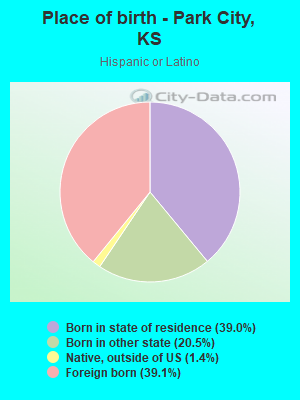
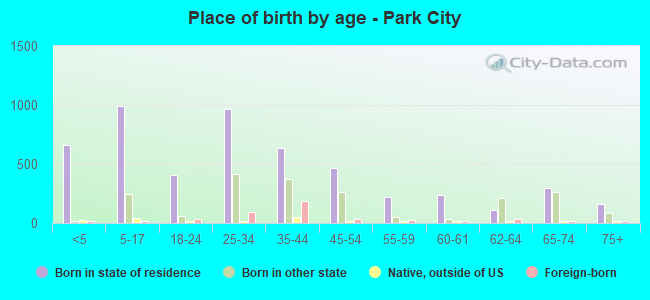
Place of birth - Born in state of residence (%)
Place of birth - Born in state of residence (%) - White
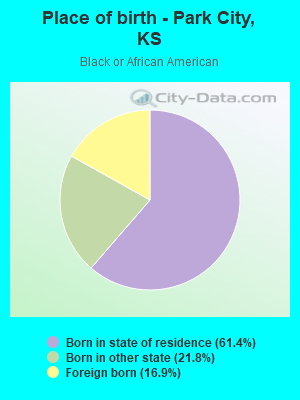
Place of birth - Born in state of residence (%) - Black or African American
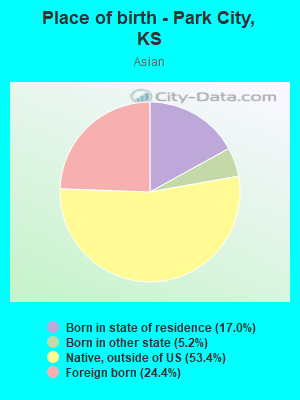
Place of birth - Born in state of residence (%) - Asian
Place of birth - Born in state of residence (%) - Hispanic or Latino
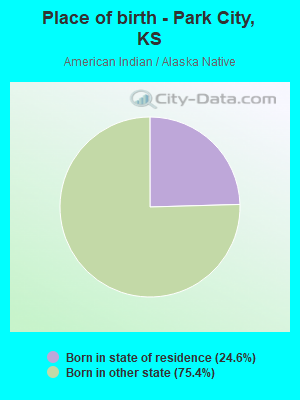
Place of birth - Born in state of residence (%) - American Indian and Alaska Native
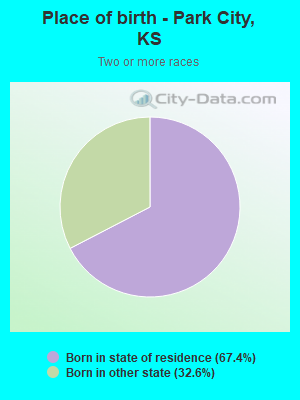
Place of birth - Born in state of residence (%) - Multirace
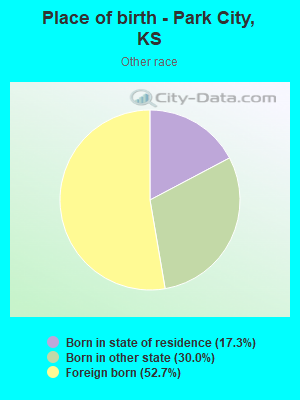
Place of birth - Born in state of residence (%) - Other Race
Place of birth - Born in other state (%)
Place of birth - Born in other state (%) - White
Place of birth - Born in other state (%) - Black or African American
Place of birth - Born in other state (%) - Asian
Place of birth - Born in other state (%) - Hispanic or Latino
Place of birth - Born in other state (%) - American Indian and Alaska Native
Place of birth - Born in other state (%) - Multirace
Place of birth - Born in other state (%) - Other Race
Place of birth - Native, outside of US (%)
Place of birth - Native, outside of US (%) - White
Place of birth - Native, outside of US (%) - Black or African American
Place of birth - Native, outside of US (%) - Asian
Place of birth - Native, outside of US (%) - Hispanic or Latino
Place of birth - Native, outside of US (%) - American Indian and Alaska Native
Place of birth - Native, outside of US (%) - Multirace
Place of birth - Native, outside of US (%) - Other Race
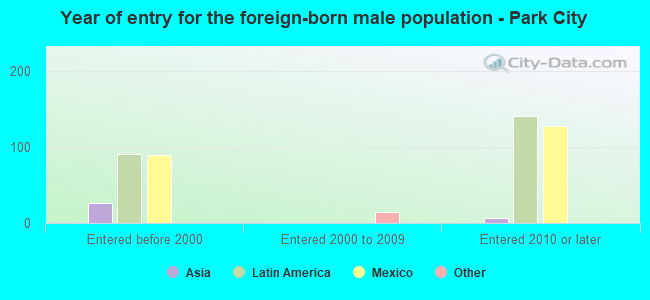
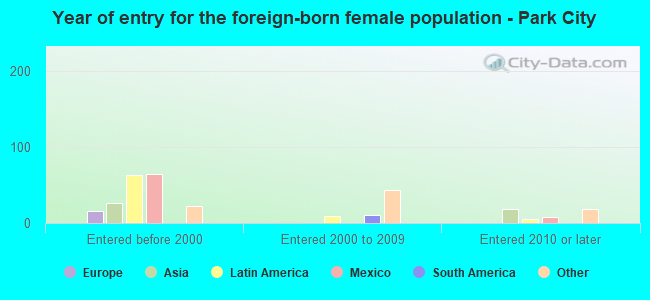
Place of birth - Foreign born (%)
Place of birth - Foreign born (%) - White
Place of birth - Foreign born (%) - Black or African American
Place of birth - Foreign born (%) - Asian
Place of birth - Foreign born (%) - Hispanic or Latino
Place of birth - Foreign born (%) - American Indian and Alaska Native
Place of birth - Foreign born (%) - Multirace
Place of birth - Foreign born (%) - Other Race
Residents speaking English at home (%)
Residents speaking English at home - Born in the United States (%)
Residents speaking English at home - Native, born elsewhere (%)
Residents speaking English at home - Foreign born (%)
Residents speaking Spanish at home (%)
Residents speaking Spanish at home - Born in the United States (%)
Residents speaking Spanish at home - Native, born elsewhere (%)
Residents speaking Spanish at home - Foreign born (%)
Residents speaking other language at home (%)
Residents speaking other language at home - Born in the United States (%)
Residents speaking other language at home - Native, born elsewhere (%)
Residents speaking other language at home - Foreign born (%)
Marital status - Never married (%)
Marital status - Now married (%)
Marital status - Separated (%)
Marital status - Widowed (%)
Marital status - Divorced (%)
Ancestries Reported - Arab (%)
Ancestries Reported - Czech (%)
Ancestries Reported - Danish (%)
Ancestries Reported - Dutch (%)
Ancestries Reported - English (%)
Ancestries Reported - French (%)
Ancestries Reported - French Canadian (%)
Ancestries Reported - German (%)
Ancestries Reported - Greek (%)
Ancestries Reported - Hungarian (%)
Ancestries Reported - Irish (%)
Ancestries Reported - Italian (%)
Ancestries Reported - Lithuanian (%)
Ancestries Reported - Norwegian (%)
Ancestries Reported - Polish (%)
Ancestries Reported - Portuguese (%)
Ancestries Reported - Russian (%)
Ancestries Reported - Scotch-Irish (%)
Ancestries Reported - Scottish (%)
Ancestries Reported - Slovak (%)
Ancestries Reported - Subsaharan African (%)
Ancestries Reported - Swedish (%)
Ancestries Reported - Swiss (%)
Ancestries Reported - Ukrainian (%)
Ancestries Reported - United States (%)
Ancestries Reported - Welsh (%)
Ancestries Reported - West Indian (%)
Ancestries Reported - Other (%)
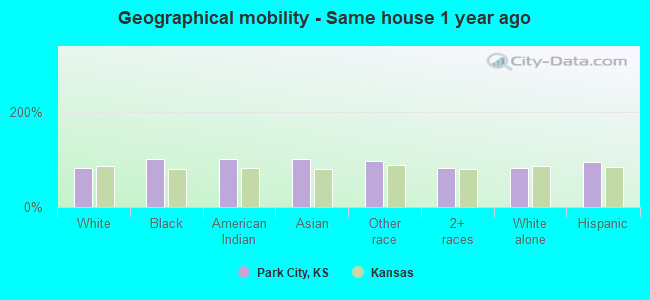
Geographical mobility - Same house 1 year ago (%)
Geographical mobility - Same house 1 year ago (%) - White
Geographical mobility - Same house 1 year ago (%) - Black or African American
Geographical mobility - Same house 1 year ago (%) - Asian
Geographical mobility - Same house 1 year ago (%) - Hispanic or Latino
Geographical mobility - Same house 1 year ago (%) - American Indian and Alaska Native
Geographical mobility - Same house 1 year ago (%) - Multirace
Geographical mobility - Same house 1 year ago (%) - Other Race
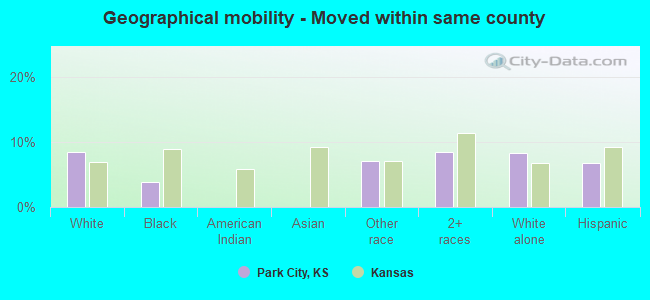
Geographical mobility - Moved within same county (%)
Geographical mobility - Moved within same county (%) - White
Geographical mobility - Moved within same county (%) - Black or African American
Geographical mobility - Moved within same county (%) - Asian
Geographical mobility - Moved within same county (%) - Hispanic or Latino
Geographical mobility - Moved within same county (%) - American Indian and Alaska Native
Geographical mobility - Moved within same county (%) - Multirace
Geographical mobility - Moved within same county (%) - Other Race
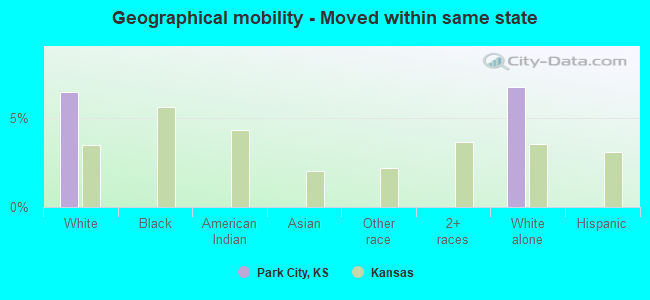
Geographical mobility - Moved from different county within same state (%)
Geographical mobility - Moved from different county within same state (%) - White
Geographical mobility - Moved from different county within same state (%) - Black or African American
Geographical mobility - Moved from different county within same state (%) - Asian
Geographical mobility - Moved from different county within same state (%) - Hispanic or Latino
Geographical mobility - Moved from different county within same state (%) - American Indian and Alaska Native
Geographical mobility - Moved from different county within same state (%) - Multirace
Geographical mobility - Moved from different county within same state (%) - Other Race
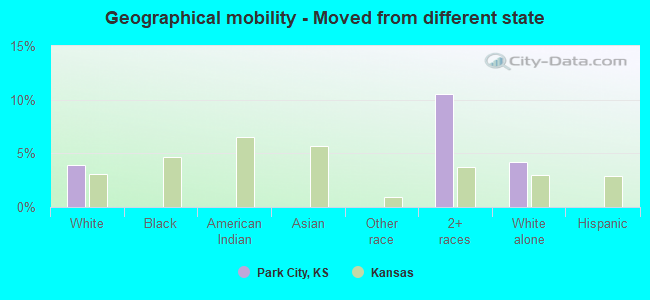
Geographical mobility - Moved from different state (%)
Geographical mobility - Moved from different state (%) - White
Geographical mobility - Moved from different state (%) - Black or African American
Geographical mobility - Moved from different state (%) - Asian
Geographical mobility - Moved from different state (%) - Hispanic or Latino
Geographical mobility - Moved from different state (%) - American Indian and Alaska Native
Geographical mobility - Moved from different state (%) - Multirace
Geographical mobility - Moved from different state (%) - Other Race
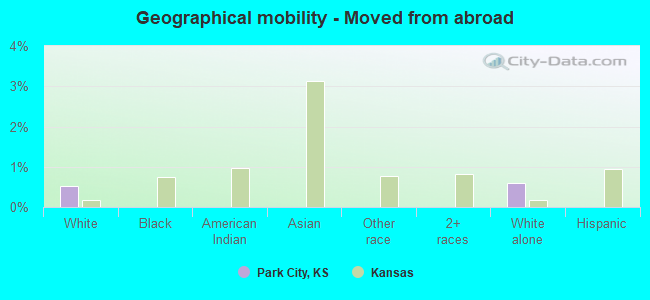
Geographical mobility - Moved from abroad (%)
Geographical mobility - Moved from abroad (%) - White
Geographical mobility - Moved from abroad (%) - Black or African American
Geographical mobility - Moved from abroad (%) - Asian
Geographical mobility - Moved from abroad (%) - Hispanic or Latino
Geographical mobility - Moved from abroad (%) - American Indian and Alaska Native
Geographical mobility - Moved from abroad (%) - Multirace
Geographical mobility - Moved from abroad (%) - Other Race
Place of birth for the foreign-born population - Ireland (%)
Place of birth for the foreign-born population - Denmark (%)
Place of birth for the foreign-born population - Norway (%)
Place of birth for the foreign-born population - Sweden (%)
Place of birth for the foreign-born population - United Kingdom (%)
Place of birth for the foreign-born population - England (%)
Place of birth for the foreign-born population - Scotland (%)
Place of birth for the foreign-born population - Other Northern Europe (%)
Place of birth for the foreign-born population - Austria (%)
Place of birth for the foreign-born population - Belgium (%)
Place of birth for the foreign-born population - France (%)
Place of birth for the foreign-born population - Germany (%)
Place of birth for the foreign-born population - Netherlands (%)
Place of birth for the foreign-born population - Switzerland (%)
Place of birth for the foreign-born population - Other Western Europe (%)
Place of birth for the foreign-born population - Greece (%)
Place of birth for the foreign-born population - Italy (%)
Place of birth for the foreign-born population - Portugal (%)
Place of birth for the foreign-born population - Spain (%)
Place of birth for the foreign-born population - Other Southern Europe (%)
Place of birth for the foreign-born population - Albania (%)
Place of birth for the foreign-born population - Belarus (%)
Place of birth for the foreign-born population - Bosnia and Herzegovina (%)
Place of birth for the foreign-born population - Bulgaria (%)
Place of birth for the foreign-born population - Croatia (%)
Place of birth for the foreign-born population - Czechoslovakia (%)
Place of birth for the foreign-born population - Hungary (%)
Place of birth for the foreign-born population - Latvia (%)
Place of birth for the foreign-born population - Lithuania (%)
Place of birth for the foreign-born population - North Macedonia (Macedonia) (%)
Place of birth for the foreign-born population - Moldova (%)
Place of birth for the foreign-born population - Poland (%)
Place of birth for the foreign-born population - Romania (%)
Place of birth for the foreign-born population - Russia (%)
Place of birth for the foreign-born population - Serbia (%)
Place of birth for the foreign-born population - Ukraine (%)
Place of birth for the foreign-born population - Other Eastern Europe (%)
Place of birth for the foreign-born population - China (%)
Place of birth for the foreign-born population - Hong Kong (%)
Place of birth for the foreign-born population - Taiwan (%)
Place of birth for the foreign-born population - Japan (%)
Place of birth for the foreign-born population - Korea (%)
Place of birth for the foreign-born population - Other Eastern Asia (%)
Place of birth for the foreign-born population - Afghanistan (%)
Place of birth for the foreign-born population - Bangladesh (%)
Place of birth for the foreign-born population - India (%)
Place of birth for the foreign-born population - Iran (%)
Place of birth for the foreign-born population - Kazakhstan (%)
Place of birth for the foreign-born population - Nepal (%)
Place of birth for the foreign-born population - Pakistan (%)
Place of birth for the foreign-born population - Sri Lanka (%)
Place of birth for the foreign-born population - Uzbekistan (%)
Place of birth for the foreign-born population - Other South Central Asia (%)
Place of birth for the foreign-born population - Burma (%)
Place of birth for the foreign-born population - Cambodia (%)
Place of birth for the foreign-born population - Indonesia (%)
Place of birth for the foreign-born population - Laos (%)
Place of birth for the foreign-born population - Malaysia (%)
Place of birth for the foreign-born population - Philippines (%)
Place of birth for the foreign-born population - Singapore (%)
Place of birth for the foreign-born population - Thailand (%)
Place of birth for the foreign-born population - Vietnam (%)
Place of birth for the foreign-born population - Other South Eastern Asia (%)
Place of birth for the foreign-born population - Armenia (%)
Place of birth for the foreign-born population - Iraq (%)
Place of birth for the foreign-born population - Israel (%)
Place of birth for the foreign-born population - Jordan (%)
Place of birth for the foreign-born population - Kuwait (%)
Place of birth for the foreign-born population - Lebanon (%)
Place of birth for the foreign-born population - Saudi Arabia (%)
Place of birth for the foreign-born population - Syria (%)
Place of birth for the foreign-born population - Turkey (%)
Place of birth for the foreign-born population - Yemen (%)
Place of birth for the foreign-born population - Other Western Asia (%)
Place of birth for the foreign-born population - Eritrea (%)
Place of birth for the foreign-born population - Ethiopia (%)
Place of birth for the foreign-born population - Kenya (%)
Place of birth for the foreign-born population - Somalia (%)
Place of birth for the foreign-born population - Uganda (%)
Place of birth for the foreign-born population - Zimbabwe (%)
Place of birth for the foreign-born population - Other Eastern Africa (%)
Place of birth for the foreign-born population - Cameroon (%)
Place of birth for the foreign-born population - Congo (%)
Place of birth for the foreign-born population - Democratic Republic of Congo (Zaire) (%)
Place of birth for the foreign-born population - Other Middle Africa (%)
Place of birth for the foreign-born population - Egypt (%)
Place of birth for the foreign-born population - Morocco (%)
Place of birth for the foreign-born population - Sudan (%)
Place of birth for the foreign-born population - Other Northern Africa (%)
Place of birth for the foreign-born population - South Africa (%)
Place of birth for the foreign-born population - Other Southern Africa (%)
Place of birth for the foreign-born population - Cabo Verde (%)
Place of birth for the foreign-born population - Ghana (%)
Place of birth for the foreign-born population - Liberia (%)
Place of birth for the foreign-born population - Nigeria (%)
Place of birth for the foreign-born population - Senegal (%)
Place of birth for the foreign-born population - Sierra Leone (%)
Place of birth for the foreign-born population - Other Western Africa (%)
Place of birth for the foreign-born population - Australia (%)
Place of birth for the foreign-born population - New Zealand (%)
Place of birth for the foreign-born population - Fiji (%)
Place of birth for the foreign-born population - Micronesia (%)
Place of birth for the foreign-born population - Bahamas (%)
Place of birth for the foreign-born population - Barbados (%)
Place of birth for the foreign-born population - Cuba (%)
Place of birth for the foreign-born population - Dominica (%)
Place of birth for the foreign-born population - Dominican Republic (%)
Place of birth for the foreign-born population - Grenada (%)
Place of birth for the foreign-born population - Haiti (%)
Place of birth for the foreign-born population - Jamaica (%)
Place of birth for the foreign-born population - St. Vincent and the Grenadines (%)
Place of birth for the foreign-born population - Trinidad and Tobago (%)
Place of birth for the foreign-born population - West Indies (%)
Place of birth for the foreign-born population - Other Caribbean (%)
Place of birth for the foreign-born population - Belize (%)
Place of birth for the foreign-born population - Costa Rica (%)
Place of birth for the foreign-born population - El Salvador (%)
Place of birth for the foreign-born population - Guatemala (%)
Place of birth for the foreign-born population - Honduras (%)
Place of birth for the foreign-born population - Mexico (%)
Place of birth for the foreign-born population - Nicaragua (%)
Place of birth for the foreign-born population - Panama (%)
Place of birth for the foreign-born population - Other Central America (%)
Place of birth for the foreign-born population - Argentina (%)
Place of birth for the foreign-born population - Bolivia (%)
Place of birth for the foreign-born population - Brazil (%)
Place of birth for the foreign-born population - Chile (%)
Place of birth for the foreign-born population - Colombia (%)
Place of birth for the foreign-born population - Ecuador (%)
Place of birth for the foreign-born population - Guyana (%)
Place of birth for the foreign-born population - Peru (%)
Place of birth for the foreign-born population - Uruguay (%)
Place of birth for the foreign-born population - Venezuela (%)
Place of birth for the foreign-born population - Other South America (%)
Place of birth for the foreign-born population - Canada (%)
Place of birth for the foreign-born population - Other Northern America (%)
Place of birth for the foreign-born population - Other (%)
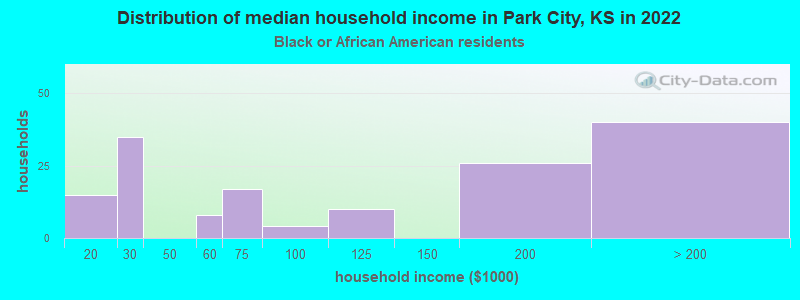
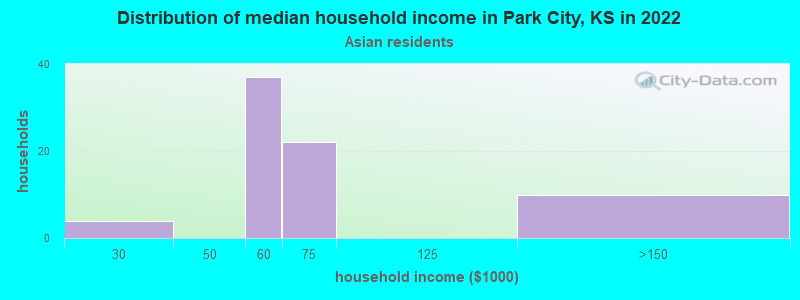
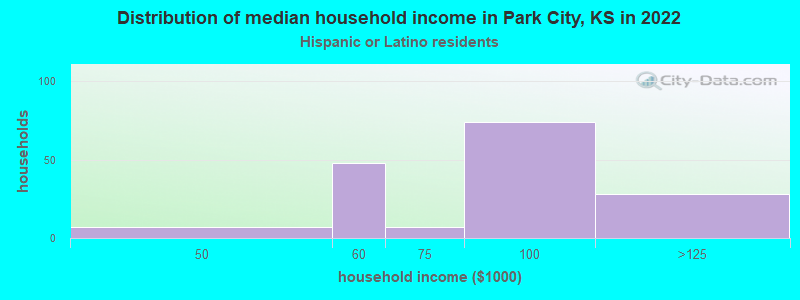
According to 2022 data, the most numerous races in Park City, KS are White alone (5,860 residents), Hispanic (723 residents), and Black alone (431 residents). 91.1% of Park City residents speak English at home. 5.9% of Park City, KS residents are foreign-born (3.5% born in Latin America, 1.1% born in Asia, 1.0% born in Africa), which is 17.9% less than the foreign-born rate of 7.0% across the entire state of Kansas.
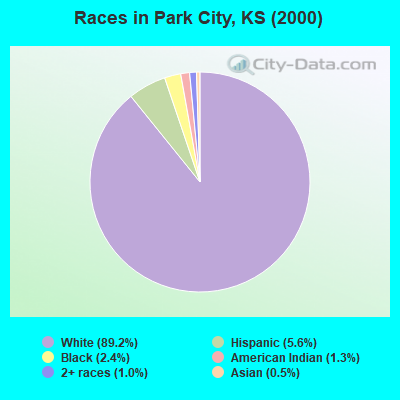
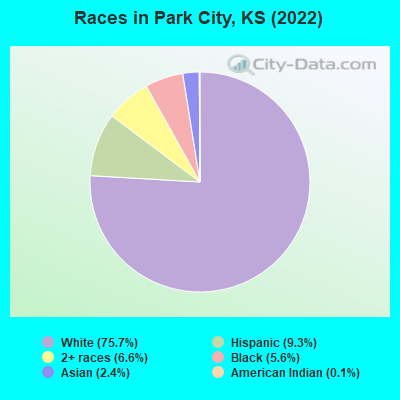
Race distribution in Park City
2000 2022
2,233,997 83.1% White alone 188,252 7.0% Hispanic 151,407 5.6% Black alone 46,301 1.7% Asian alone 42,508 1.6% Two or more races 22,322 0.8% American Indian alone 2,477 0.09% Other race alone 1,154 0.04% Native Hawaiian and Other
2,147,943 73.1% White alone 381,746 13.0% Hispanic 147,666 5.0% Black alone 145,362 4.9% Two or more races 85,085 2.9% Asian alone 13,263 0.5% Other race alone 12,065 0.4% American Indian alone 4,020 0.1% Native Hawaiian and Other
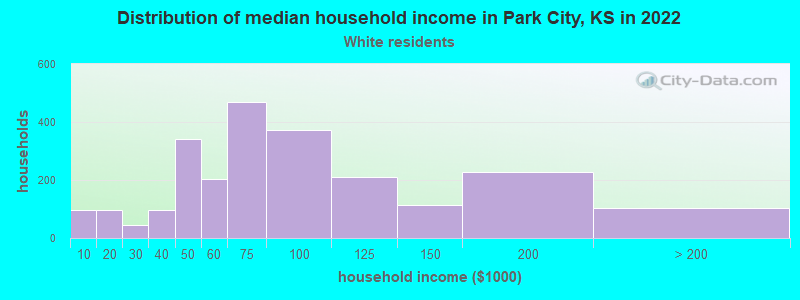
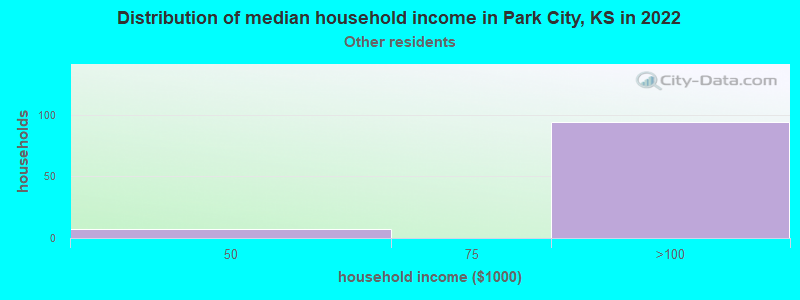
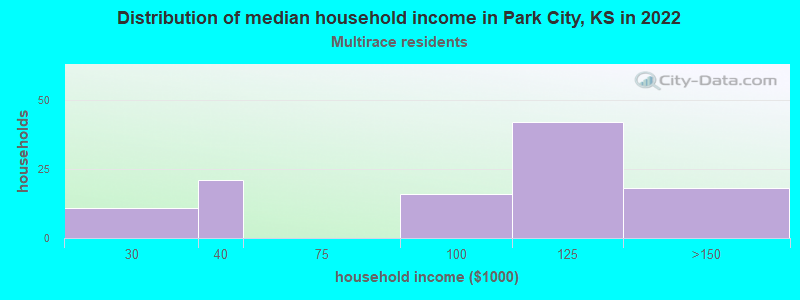
Income and house value in Park City Median household income in 2022 $69,109 White non-Hispanic householders$69,937 Asian householders$98,885 Some other race householders$100,493 Two or more races householders$87,903 Hispanic or Latino race householdersMedian 2022 house value $184,669 White Non-Hispanic householders$192,183 Black or African American householders$219,060 American Indian or Alaska Native householders $245,648 Asian householders$245,648 Some other race householders$202,298 Hispanic or Latino householders
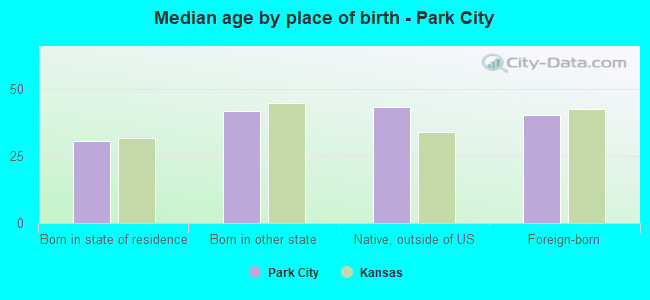
Median age by race in Park City
34.6 Median age for White residents34.4 33.7 38.7 Median age for Black or African American residents50.9 28.5 74.5 Median age for American Indian / Alaska Native residents84.4 -664,437,011.6 40.5 Median age for Asian residents18.0 37.8 -1,208,163,264.1 Median age for Native Hawaiian / Pacific Islander residents-1,324,483,774.5 -827,083,332.5 34.8 Median age for Other race residents37.0 13.3 23.4 Median age for Two or more races residents25.5 7.6 35.1 Median age for White alone residents36.9 33.1 27.9 Median age for Hispanic or Latino residents30.5 26.7
Owner/renter occupied households by race in Park City
House owners and renters - White residents 1,951 79.4% Owner occupied507 20.6% Renter occupiedHouse owners and renters - Black or African American residents 111 78.4% Owner occupied31 21.6% Renter occupiedHouse owners and renters - Asian residents 82 100.0% Owner occupiedHouse owners and renters - Other race residents 58 73.0% Owner occupied21 27.0% Renter occupiedHouse owners and renters - Two or more races residents 92 100.0% Owner occupiedHouse owners and renters - White alone residents 1,893 78.8% Owner occupied511 21.2% Renter occupiedHouse owners and renters - Hispanic or Latino residents 150 83.2% Owner occupied30 16.8% Renter occupied
Language usage in Park City
English speakers - Total 91.1% of residents of Park City speak English at home.
6.6% of residents speak Spanish at home 322 69.0% Speak English very well145 31.0% Speak English less than very well2.8% of residents speak other language at home 142 71.0% Speak English very well58 29.0% Speak English less than very well
English speakers - Born in the United States 91.6% of residents of Park City speak English at home.
6.8% of residents speak Spanish at home 133 100.0% Speak English very well1.5% of residents speak other language at home 30 100.0% Speak English very well
English speakers - Native, born elsewhere 91.6% of residents of Park City speak English at home.
11.8% of residents speak Spanish at home 14 100.0% Speak English very well
English speakers - Foreign-born 11.9% of residents of Park City speak English at home.
57.6% of residents speak Spanish at home 112 42.9% Speak English very well149 57.1% Speak English less than very well29.6% of residents speak other language at home 84 62.7% Speak English very well50 37.3% Speak English less than very well
White (Caucasian) - Speak only English Native:
98.9% (5,448)Foreign-born:
28.3% (21)
White (Caucasian) - Speak another language Native:
1.8% (100)Foreign-born:
71.3% (52)
Black or African American - Speak another language Native:
7.0% (23)Foreign-born:
82.4% (62)
Asian - Speak only English Native:
100.0% (124)Foreign-born:
41.9% (27)
Asian - Speak another language Native:
8.7% (11)Foreign-born:
64.7% (41)
Other race - Speak another language Native:
61.6% (115)Foreign-born:
100.0% (227)
White alone - Speak only English Native:
98.0% (5,318)Foreign-born:
41.4% (21)
White alone - Speak another language Native:
1.8% (97)Foreign-born:
58.6% (30)
Hispanic or Latino - Speak another language Native:
39.3% (127)Foreign-born:
97.9% (278)
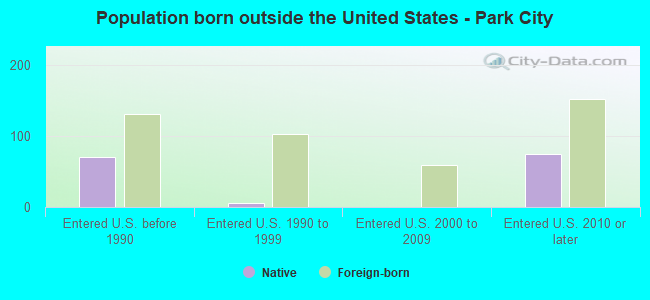
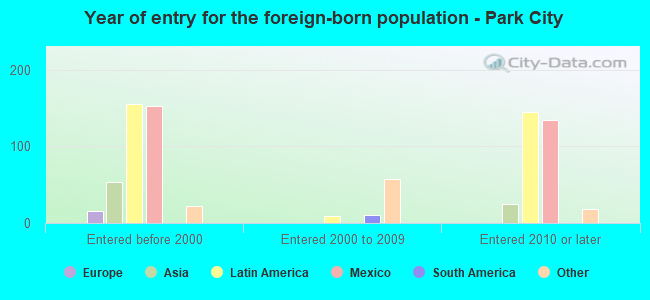
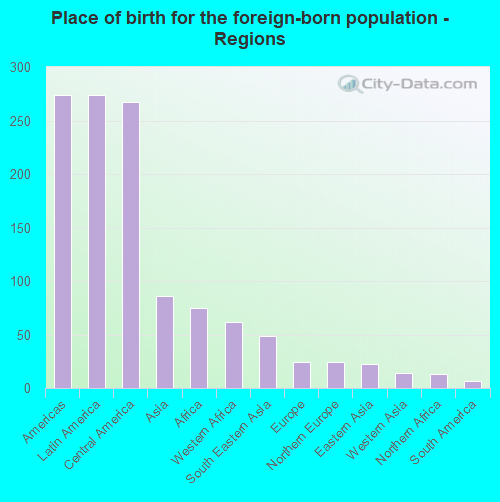
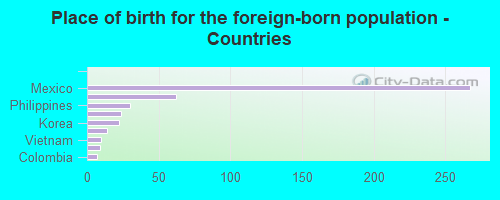
Foreign-born residents in Park City 460 residents are foreign born (3.5% Latin America , 1.1% Asia , 1.0% Africa ).
This city:
5.9%Kansas:
7.1%
Marital status for residents in Park City Marital status - White (Caucasian) population 15 years and over
Males 29.8% Never married59.1% Now married0.0% Separated2.7% Widowed8.4% DivorcedFemales 20.9% Never married59.0% Now married2.3% Separated3.5% Widowed14.4% DivorcedWomen who gave birth in the past 12 months Now married:
87.3% (139)Unmarried:
12.7% (20)
Women who did not give birth in the past 12 months Now married:
51.8% (672)Unmarried:
48.2% (624)
Marital status - Black or African American population 15 years and over
Males 0.0% Never married71.6% Now married0.0% Separated0.0% Widowed28.4% DivorcedFemales 54.7% Never married30.6% Now married0.0% Separated12.5% Widowed2.2% DivorcedWomen who gave birth in the past 12 months Now married:
0.0% (0)Unmarried:
100.0% (10)
Women who did not give birth in the past 12 months Now married:
16.9% (26)Unmarried:
83.1% (128)
Marital status - Asian population 15 years and over
Males 76.9% Never married23.1% Now married0.0% Separated0.0% Widowed0.0% DivorcedFemales 26.0% Never married63.0% Now married0.0% Separated0.0% Widowed11.0% DivorcedWomen who did not give birth in the past 12 months Now married:
68.0% (70)Unmarried:
32.0% (33)
Marital status - Other race population 15 years and over
Males 0.0% Never married100.0% Now married0.0% Separated0.0% Widowed0.0% DivorcedFemales 0.0% Never married100.0% Now married0.0% Separated0.0% Widowed0.0% DivorcedWomen who did not give birth in the past 12 months Now married:
100.0% (37)Unmarried:
0.0% (0)
Marital status - Two or more races population 15 years and over
Males 50.3% Never married42.1% Now married7.6% Separated0.0% Widowed0.0% DivorcedFemales 22.4% Never married43.3% Now married0.0% Separated20.9% Widowed13.4% DivorcedWomen who did not give birth in the past 12 months Now married:
28.6% (8)Unmarried:
71.4% (20)
Marital status - White alone, not Hispanic / Latino population 15 years and over
Males 29.3% Never married59.2% Now married0.0% Separated2.8% Widowed8.7% DivorcedFemales 19.7% Never married59.4% Now married2.3% Separated3.6% Widowed15.0% DivorcedWomen who gave birth in the past 12 months Now married:
100.0% (143)Unmarried:
0.0% (0)
Women who did not give birth in the past 12 months Now married:
51.1% (646)Unmarried:
48.9% (617)
Marital status - Hispanic or Latino population 15 years and over
Males 14.0% Never married86.0% Now married0.0% Separated0.0% Widowed0.0% DivorcedFemales 34.5% Never married65.5% Now married0.0% Separated0.0% Widowed0.0% DivorcedWomen who gave birth in the past 12 months Now married:
0.0% (0)Unmarried:
100.0% (22)
Women who did not give birth in the past 12 months Now married:
74.8% (88)Unmarried:
25.2% (30)
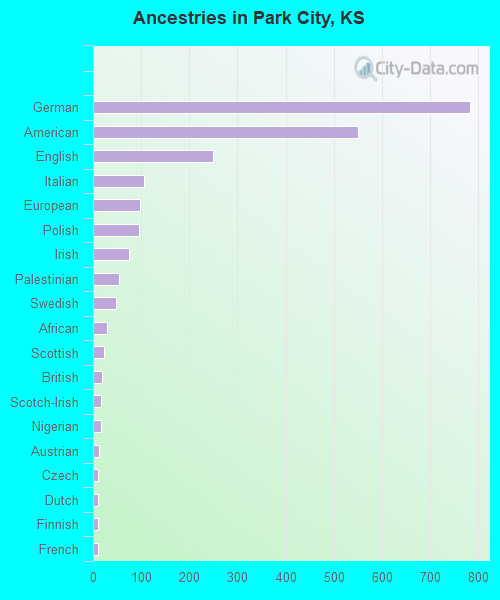
Ancestries in Park City
783 22.8% German551 16.1% American249 7.3% English105 3.1% Italian98 2.9% European95 2.8% Polish74 2.2% Irish54 1.6% Palestinian47 1.4% Swedish29 0.8% African22 0.6% Scottish18 0.5% British16 0.5% Scotch-Irish16 0.5% Nigerian12 0.3% Austrian11 0.3% Czech11 0.3% Dutch11 0.3% Finnish11 0.3% French6 0.2% Northern European1 0.03% Lithuanian
Children Nativity (place of birth) in Park City
Children under 6 years - Living with two parents Both parents native 461 100.0% NativeBoth parents foreign-born 11 100.0% NativeOne native, one foreign-born parent 38 100.0% NativeChildren under 6 years - Living with one parent Native parent 100 100.0% NativeForeign-born parent 39 100.0% NativeChildren 6 to 17 years - Living with two parents Both parents native 527 99.6% Native2 0.4% Foreign-bornBoth parents foreign-born 145 100.0% NativeOne native, one foreign-born parent 46 72.1% Native18 27.9% Foreign-bornChildren 6 to 17 years - Living with one parent Native parent 343 100.0% Native
Grandparents responsible for own grandchildren in Park City
Grandparents (30 to 59 years) White / Caucasian 50 100.0% Not responsible for grandchildrenBlack or African American 6 100.0% Not responsible for grandchildrenWhite alone, not Hispanic / Latino 55 100.0% Not responsible for grandchildrenGrandparents (60 years and over) White / Caucasian 7 9.7% Responsible for grandchildren62 90.3% Not responsible for grandchildrenBlack or African American 31 100.0% Responsible for grandchildrenWhite alone, not Hispanic / Latino 7 9.5% Responsible for grandchildren67 90.5% Not responsible for grandchildren