Races in Panama City Beach, Florida (FL) Detailed Stats
Data:
Races - White alone (%)
Races - White alone (% change since 2000)
Races - Black alone (%)
Races - Black alone (% change since 2000)
Races - American Indian alone (%)
Races - American Indian alone (% change since 2000)
Races - Asian alone (%)
Races - Asian alone (% change since 2000)
Races - Hispanic (%)
Races - Hispanic (% change since 2000)
Races - Native Hawaiian and Other Pacific Islander alone (%)
Races - Native Hawaiian and Other Pacific Islander alone (% change since 2000)
Races - Two or more races(%)
Races - Two or more races(% change since 2000)
Races - Other race alone (%)
Races - Other race alone (% change since 2000)
Racial diversity
Place of birth - Born in state of residence (%)
Place of birth - Born in state of residence (%) - White
Place of birth - Born in state of residence (%) - Black or African American
Place of birth - Born in state of residence (%) - Asian
Place of birth - Born in state of residence (%) - Hispanic or Latino
Place of birth - Born in state of residence (%) - American Indian and Alaska Native
Place of birth - Born in state of residence (%) - Multirace
Place of birth - Born in state of residence (%) - Other Race
Place of birth - Born in other state (%)
Place of birth - Born in other state (%) - White
Place of birth - Born in other state (%) - Black or African American
Place of birth - Born in other state (%) - Asian
Place of birth - Born in other state (%) - Hispanic or Latino
Place of birth - Born in other state (%) - American Indian and Alaska Native
Place of birth - Born in other state (%) - Multirace
Place of birth - Born in other state (%) - Other Race
Place of birth - Native, outside of US (%)
Place of birth - Native, outside of US (%) - White
Place of birth - Native, outside of US (%) - Black or African American
Place of birth - Native, outside of US (%) - Asian
Place of birth - Native, outside of US (%) - Hispanic or Latino
Place of birth - Native, outside of US (%) - American Indian and Alaska Native
Place of birth - Native, outside of US (%) - Multirace
Place of birth - Native, outside of US (%) - Other Race
Place of birth - Foreign born (%)
Place of birth - Foreign born (%) - White
Place of birth - Foreign born (%) - Black or African American
Place of birth - Foreign born (%) - Asian
Place of birth - Foreign born (%) - Hispanic or Latino
Place of birth - Foreign born (%) - American Indian and Alaska Native
Place of birth - Foreign born (%) - Multirace
Place of birth - Foreign born (%) - Other Race
Residents speaking English at home (%)
Residents speaking English at home - Born in the United States (%)
Residents speaking English at home - Native, born elsewhere (%)
Residents speaking English at home - Foreign born (%)
Residents speaking Spanish at home (%)
Residents speaking Spanish at home - Born in the United States (%)
Residents speaking Spanish at home - Native, born elsewhere (%)
Residents speaking Spanish at home - Foreign born (%)
Residents speaking other language at home (%)
Residents speaking other language at home - Born in the United States (%)
Residents speaking other language at home - Native, born elsewhere (%)
Residents speaking other language at home - Foreign born (%)
Marital status - Never married (%)
Marital status - Now married (%)
Marital status - Separated (%)
Marital status - Widowed (%)
Marital status - Divorced (%)
Ancestries Reported - Arab (%)
Ancestries Reported - Czech (%)
Ancestries Reported - Danish (%)
Ancestries Reported - Dutch (%)
Ancestries Reported - English (%)
Ancestries Reported - French (%)
Ancestries Reported - French Canadian (%)
Ancestries Reported - German (%)
Ancestries Reported - Greek (%)
Ancestries Reported - Hungarian (%)
Ancestries Reported - Irish (%)
Ancestries Reported - Italian (%)
Ancestries Reported - Lithuanian (%)
Ancestries Reported - Norwegian (%)
Ancestries Reported - Polish (%)
Ancestries Reported - Portuguese (%)
Ancestries Reported - Russian (%)
Ancestries Reported - Scotch-Irish (%)
Ancestries Reported - Scottish (%)
Ancestries Reported - Slovak (%)
Ancestries Reported - Subsaharan African (%)
Ancestries Reported - Swedish (%)
Ancestries Reported - Swiss (%)
Ancestries Reported - Ukrainian (%)
Ancestries Reported - United States (%)
Ancestries Reported - Welsh (%)
Ancestries Reported - West Indian (%)
Ancestries Reported - Other (%)
Geographical mobility - Same house 1 year ago (%)
Geographical mobility - Same house 1 year ago (%) - White
Geographical mobility - Same house 1 year ago (%) - Black or African American
Geographical mobility - Same house 1 year ago (%) - Asian
Geographical mobility - Same house 1 year ago (%) - Hispanic or Latino
Geographical mobility - Same house 1 year ago (%) - American Indian and Alaska Native
Geographical mobility - Same house 1 year ago (%) - Multirace
Geographical mobility - Same house 1 year ago (%) - Other Race
Geographical mobility - Moved within same county (%)
Geographical mobility - Moved within same county (%) - White
Geographical mobility - Moved within same county (%) - Black or African American
Geographical mobility - Moved within same county (%) - Asian
Geographical mobility - Moved within same county (%) - Hispanic or Latino
Geographical mobility - Moved within same county (%) - American Indian and Alaska Native
Geographical mobility - Moved within same county (%) - Multirace
Geographical mobility - Moved within same county (%) - Other Race
Geographical mobility - Moved from different county within same state (%)
Geographical mobility - Moved from different county within same state (%) - White
Geographical mobility - Moved from different county within same state (%) - Black or African American
Geographical mobility - Moved from different county within same state (%) - Asian
Geographical mobility - Moved from different county within same state (%) - Hispanic or Latino
Geographical mobility - Moved from different county within same state (%) - American Indian and Alaska Native
Geographical mobility - Moved from different county within same state (%) - Multirace
Geographical mobility - Moved from different county within same state (%) - Other Race
Geographical mobility - Moved from different state (%)
Geographical mobility - Moved from different state (%) - White
Geographical mobility - Moved from different state (%) - Black or African American
Geographical mobility - Moved from different state (%) - Asian
Geographical mobility - Moved from different state (%) - Hispanic or Latino
Geographical mobility - Moved from different state (%) - American Indian and Alaska Native
Geographical mobility - Moved from different state (%) - Multirace
Geographical mobility - Moved from different state (%) - Other Race
Geographical mobility - Moved from abroad (%)
Geographical mobility - Moved from abroad (%) - White
Geographical mobility - Moved from abroad (%) - Black or African American
Geographical mobility - Moved from abroad (%) - Asian
Geographical mobility - Moved from abroad (%) - Hispanic or Latino
Geographical mobility - Moved from abroad (%) - American Indian and Alaska Native
Geographical mobility - Moved from abroad (%) - Multirace
Geographical mobility - Moved from abroad (%) - Other Race
Place of birth for the foreign-born population - Ireland (%)
Place of birth for the foreign-born population - Denmark (%)
Place of birth for the foreign-born population - Norway (%)
Place of birth for the foreign-born population - Sweden (%)
Place of birth for the foreign-born population - United Kingdom (%)
Place of birth for the foreign-born population - England (%)
Place of birth for the foreign-born population - Scotland (%)
Place of birth for the foreign-born population - Other Northern Europe (%)
Place of birth for the foreign-born population - Austria (%)
Place of birth for the foreign-born population - Belgium (%)
Place of birth for the foreign-born population - France (%)
Place of birth for the foreign-born population - Germany (%)
Place of birth for the foreign-born population - Netherlands (%)
Place of birth for the foreign-born population - Switzerland (%)
Place of birth for the foreign-born population - Other Western Europe (%)
Place of birth for the foreign-born population - Greece (%)
Place of birth for the foreign-born population - Italy (%)
Place of birth for the foreign-born population - Portugal (%)
Place of birth for the foreign-born population - Spain (%)
Place of birth for the foreign-born population - Other Southern Europe (%)
Place of birth for the foreign-born population - Albania (%)
Place of birth for the foreign-born population - Belarus (%)
Place of birth for the foreign-born population - Bosnia and Herzegovina (%)
Place of birth for the foreign-born population - Bulgaria (%)
Place of birth for the foreign-born population - Croatia (%)
Place of birth for the foreign-born population - Czechoslovakia (%)
Place of birth for the foreign-born population - Hungary (%)
Place of birth for the foreign-born population - Latvia (%)
Place of birth for the foreign-born population - Lithuania (%)
Place of birth for the foreign-born population - North Macedonia (Macedonia) (%)
Place of birth for the foreign-born population - Moldova (%)
Place of birth for the foreign-born population - Poland (%)
Place of birth for the foreign-born population - Romania (%)
Place of birth for the foreign-born population - Russia (%)
Place of birth for the foreign-born population - Serbia (%)
Place of birth for the foreign-born population - Ukraine (%)
Place of birth for the foreign-born population - Other Eastern Europe (%)
Place of birth for the foreign-born population - China (%)
Place of birth for the foreign-born population - Hong Kong (%)
Place of birth for the foreign-born population - Taiwan (%)
Place of birth for the foreign-born population - Japan (%)
Place of birth for the foreign-born population - Korea (%)
Place of birth for the foreign-born population - Other Eastern Asia (%)
Place of birth for the foreign-born population - Afghanistan (%)
Place of birth for the foreign-born population - Bangladesh (%)
Place of birth for the foreign-born population - India (%)
Place of birth for the foreign-born population - Iran (%)
Place of birth for the foreign-born population - Kazakhstan (%)
Place of birth for the foreign-born population - Nepal (%)
Place of birth for the foreign-born population - Pakistan (%)
Place of birth for the foreign-born population - Sri Lanka (%)
Place of birth for the foreign-born population - Uzbekistan (%)
Place of birth for the foreign-born population - Other South Central Asia (%)
Place of birth for the foreign-born population - Burma (%)
Place of birth for the foreign-born population - Cambodia (%)
Place of birth for the foreign-born population - Indonesia (%)
Place of birth for the foreign-born population - Laos (%)
Place of birth for the foreign-born population - Malaysia (%)
Place of birth for the foreign-born population - Philippines (%)
Place of birth for the foreign-born population - Singapore (%)
Place of birth for the foreign-born population - Thailand (%)
Place of birth for the foreign-born population - Vietnam (%)
Place of birth for the foreign-born population - Other South Eastern Asia (%)
Place of birth for the foreign-born population - Armenia (%)
Place of birth for the foreign-born population - Iraq (%)
Place of birth for the foreign-born population - Israel (%)
Place of birth for the foreign-born population - Jordan (%)
Place of birth for the foreign-born population - Kuwait (%)
Place of birth for the foreign-born population - Lebanon (%)
Place of birth for the foreign-born population - Saudi Arabia (%)
Place of birth for the foreign-born population - Syria (%)
Place of birth for the foreign-born population - Turkey (%)
Place of birth for the foreign-born population - Yemen (%)
Place of birth for the foreign-born population - Other Western Asia (%)
Place of birth for the foreign-born population - Eritrea (%)
Place of birth for the foreign-born population - Ethiopia (%)
Place of birth for the foreign-born population - Kenya (%)
Place of birth for the foreign-born population - Somalia (%)
Place of birth for the foreign-born population - Uganda (%)
Place of birth for the foreign-born population - Zimbabwe (%)
Place of birth for the foreign-born population - Other Eastern Africa (%)
Place of birth for the foreign-born population - Cameroon (%)
Place of birth for the foreign-born population - Congo (%)
Place of birth for the foreign-born population - Democratic Republic of Congo (Zaire) (%)
Place of birth for the foreign-born population - Other Middle Africa (%)
Place of birth for the foreign-born population - Egypt (%)
Place of birth for the foreign-born population - Morocco (%)
Place of birth for the foreign-born population - Sudan (%)
Place of birth for the foreign-born population - Other Northern Africa (%)
Place of birth for the foreign-born population - South Africa (%)
Place of birth for the foreign-born population - Other Southern Africa (%)
Place of birth for the foreign-born population - Cabo Verde (%)
Place of birth for the foreign-born population - Ghana (%)
Place of birth for the foreign-born population - Liberia (%)
Place of birth for the foreign-born population - Nigeria (%)
Place of birth for the foreign-born population - Senegal (%)
Place of birth for the foreign-born population - Sierra Leone (%)
Place of birth for the foreign-born population - Other Western Africa (%)
Place of birth for the foreign-born population - Australia (%)
Place of birth for the foreign-born population - New Zealand (%)
Place of birth for the foreign-born population - Fiji (%)
Place of birth for the foreign-born population - Micronesia (%)
Place of birth for the foreign-born population - Bahamas (%)
Place of birth for the foreign-born population - Barbados (%)
Place of birth for the foreign-born population - Cuba (%)
Place of birth for the foreign-born population - Dominica (%)
Place of birth for the foreign-born population - Dominican Republic (%)
Place of birth for the foreign-born population - Grenada (%)
Place of birth for the foreign-born population - Haiti (%)
Place of birth for the foreign-born population - Jamaica (%)
Place of birth for the foreign-born population - St. Vincent and the Grenadines (%)
Place of birth for the foreign-born population - Trinidad and Tobago (%)
Place of birth for the foreign-born population - West Indies (%)
Place of birth for the foreign-born population - Other Caribbean (%)
Place of birth for the foreign-born population - Belize (%)
Place of birth for the foreign-born population - Costa Rica (%)
Place of birth for the foreign-born population - El Salvador (%)
Place of birth for the foreign-born population - Guatemala (%)
Place of birth for the foreign-born population - Honduras (%)
Place of birth for the foreign-born population - Mexico (%)
Place of birth for the foreign-born population - Nicaragua (%)
Place of birth for the foreign-born population - Panama (%)
Place of birth for the foreign-born population - Other Central America (%)
Place of birth for the foreign-born population - Argentina (%)
Place of birth for the foreign-born population - Bolivia (%)
Place of birth for the foreign-born population - Brazil (%)
Place of birth for the foreign-born population - Chile (%)
Place of birth for the foreign-born population - Colombia (%)
Place of birth for the foreign-born population - Ecuador (%)
Place of birth for the foreign-born population - Guyana (%)
Place of birth for the foreign-born population - Peru (%)
Place of birth for the foreign-born population - Uruguay (%)
Place of birth for the foreign-born population - Venezuela (%)
Place of birth for the foreign-born population - Other South America (%)
Place of birth for the foreign-born population - Canada (%)
Place of birth for the foreign-born population - Other Northern America (%)
Place of birth for the foreign-born population - Other (%)
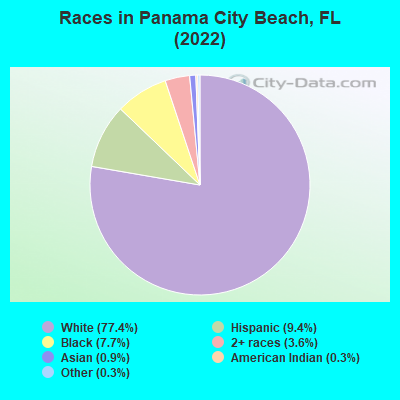
According to 2022 data, the most numerous races in Panama City Beach, FL are White alone (14,465 residents), Hispanic (1,752 residents), and Black alone (1,446 residents). 88.3% of Panama City Beach residents speak English at home. 12.1% of Panama City Beach, FL residents are foreign-born (6.0% born in Latin America, 3.2% born in Europe, 1.5% born in Africa), which is 73.2% less than the foreign-born rate of 21.0% across the entire state of Florida.
Race distribution in Panama City Beach
2000 2022
10,458,509 65.4% White alone 2,682,715 16.8% Hispanic 2,264,268 14.2% Black alone 261,693 1.6% Asian alone 236,954 1.5% Two or more races 42,358 0.3% American Indian alone 28,994 0.2% Other race alone 6,887 0.04% Native Hawaiian and Other
11,309,403 50.8% White alone 6,025,039 27.1% Hispanic 3,241,015 14.6% Black alone 861,630 3.9% Two or more races 623,692 2.8% Asian alone 152,054 0.7% Other race alone 22,504 0.1% American Indian alone 9,486 0.04% Native Hawaiian and Other
Income and house value in Panama City Beach Median household income in 2022 $77,669 White non-Hispanic householders$49,643 Some other race householders$121,748 Two or more races householders$77,068 Hispanic or Latino race householdersMedian 2022 house value $512,168 White Non-Hispanic householders$494,159 Two or more races householders$624,617 Hispanic or Latino householders
Median age by race in Panama City Beach
49.7 Median age for White residents49.5 49.6 25.7 Median age for Black or African American residents25.6 22.4 41.1 Median age for American Indian / Alaska Native residents42.0 -594,925,633.7 35.5 Median age for Asian residents22.0 39.0 -679,849,340.2 Median age for Native Hawaiian / Pacific Islander residents-858,307,848.3 -443,298,968.6 42.8 Median age for Other race residents71.3 29.4 32.1 Median age for Two or more races residents27.2 33.3 49.5 Median age for White alone residents48.6 49.1 38.7 Median age for Hispanic or Latino residents42.3 33.8
Owner/renter occupied households by race in Panama City Beach
House owners and renters - White residents 4,655 65.1% Owner occupied2,493 34.9% Renter occupiedHouse owners and renters - Black or African American residents 76 12.7% Owner occupied523 87.3% Renter occupiedHouse owners and renters - American Indian / Alaska Native residents 122 100.0% Renter occupiedHouse owners and renters - Asian residents 15 18.2% Owner occupied67 81.8% Renter occupiedHouse owners and renters - Other race residents 206 74.3% Owner occupied71 25.7% Renter occupiedHouse owners and renters - Two or more races residents 207 40.1% Owner occupied309 59.9% Renter occupiedHouse owners and renters - White alone residents 4,525 66.0% Owner occupied2,332 34.0% Renter occupiedHouse owners and renters - Hispanic or Latino residents 349 40.2% Owner occupied520 59.8% Renter occupied
Language usage in Panama City Beach
English speakers - Total 88.3% of residents of Panama City Beach speak English at home.
6.8% of residents speak Spanish at home 396 32.0% Speak English very well842 68.0% Speak English less than very well4.9% of residents speak other language at home 640 72.2% Speak English very well247 27.8% Speak English less than very well
English speakers - Born in the United States 96.5% of residents of Panama City Beach speak English at home.
1.4% of residents speak Spanish at home 166 100.0% Speak English very well2.1% of residents speak other language at home 244 100.0% Speak English very well
English speakers - Native, born elsewhere 64.7% of residents of Panama City Beach speak English at home.
34.9% of residents speak Spanish at home 92 37.7% Speak English very well152 62.3% Speak English less than very well
English speakers - Foreign-born 30.3% of residents of Panama City Beach speak English at home.
37.4% of residents speak Spanish at home 129 17.4% Speak English very well614 82.6% Speak English less than very well31.1% of residents speak other language at home 418 67.6% Speak English very well200 32.4% Speak English less than very well
White (Caucasian) - Speak only English Native:
98.6% (13,335)Foreign-born:
35.0% (340)
White (Caucasian) - Speak another language Native:
1.6% (220)Foreign-born:
65.0% (632)
Black or African American - Speak only English Native:
99.8% (802)Foreign-born:
50.9% (295)
Asian - Speak only English Native:
56.6% (47)Foreign-born:
74.1% (73)
Asian - Speak another language Native:
32.5% (27)Foreign-born:
35.4% (35)
Other race - Speak only English Native:
45.4% (85)Foreign-born:
17.6% (53)
Other race - Speak another language Native:
64.2% (120)Foreign-born:
85.2% (257)
Two or more races - Speak another language Native:
41.2% (466)Foreign-born:
97.0% (227)
White alone - Speak only English Native:
98.9% (13,144)Foreign-born:
41.5% (311)
White alone - Speak another language Native:
1.2% (161)Foreign-born:
59.0% (442)
Hispanic or Latino - Speak only English Native:
52.0% (477)Foreign-born:
10.5% (86)
Hispanic or Latino - Speak another language Native:
48.2% (442)Foreign-born:
89.6% (733)
Foreign-born residents in Panama City Beach 2,266 residents are foreign born (6.0% Latin America , 3.2% Europe , 1.5% Africa ).
This city:
12.1%Florida:
21.1%
Marital status for residents in Panama City Beach Marital status - White (Caucasian) population 15 years and over
Males 27.4% Never married55.7% Now married1.1% Separated2.2% Widowed13.6% DivorcedFemales 18.8% Never married51.0% Now married1.8% Separated9.4% Widowed19.1% DivorcedWomen who gave birth in the past 12 months Now married:
80.5% (130)Unmarried:
19.5% (32)
Women who did not give birth in the past 12 months Now married:
50.4% (1,447)Unmarried:
49.6% (1,424)
Marital status - Black or African American population 15 years and over
Males 50.1% Never married32.6% Now married8.4% Separated0.0% Widowed8.9% DivorcedFemales 48.8% Never married41.5% Now married0.0% Separated0.0% Widowed9.7% DivorcedWomen who did not give birth in the past 12 months Now married:
41.9% (207)Unmarried:
58.1% (287)
Marital status - Asian population 15 years and over
Males 56.9% Never married43.1% Now married0.0% Separated0.0% Widowed0.0% DivorcedFemales 0.0% Never married63.4% Now married0.0% Separated11.0% Widowed25.6% DivorcedWomen who did not give birth in the past 12 months Now married:
52.3% (24)Unmarried:
47.7% (22)
Marital status - Other race population 15 years and over
Males 16.5% Never married25.2% Now married9.6% Separated0.0% Widowed48.6% DivorcedFemales 30.6% Never married25.2% Now married15.0% Separated0.0% Widowed29.1% DivorcedWomen who did not give birth in the past 12 months Now married:
37.6% (106)Unmarried:
62.4% (176)
Marital status - Two or more races population 15 years and over
Males 52.6% Never married44.0% Now married0.0% Separated0.0% Widowed3.4% DivorcedFemales 35.5% Never married51.7% Now married0.0% Separated0.0% Widowed12.8% DivorcedWomen who did not give birth in the past 12 months Now married:
56.3% (205)Unmarried:
43.7% (159)
Marital status - White alone, not Hispanic / Latino population 15 years and over
Males 27.5% Never married55.8% Now married1.2% Separated2.0% Widowed13.5% DivorcedFemales 17.5% Never married51.2% Now married1.9% Separated9.7% Widowed19.7% DivorcedWomen who gave birth in the past 12 months Now married:
84.6% (133)Unmarried:
15.4% (24)
Women who did not give birth in the past 12 months Now married:
51.1% (1,411)Unmarried:
48.9% (1,350)
Marital status - Hispanic or Latino population 15 years and over
Males 28.6% Never married38.0% Now married2.5% Separated2.5% Widowed28.4% DivorcedFemales 42.1% Never married32.2% Now married5.9% Separated0.0% Widowed19.8% DivorcedWomen who gave birth in the past 12 months Now married:
0.0% (0)Unmarried:
100.0% (9)
Women who did not give birth in the past 12 months Now married:
35.5% (165)Unmarried:
64.5% (300)
Ancestries in Panama City Beach
1,389 15.6% Irish1,268 14.3% English901 10.1% American806 9.1% German278 3.1% African248 2.8% French223 2.5% Jamaican200 2.3% Scottish194 2.2% French Canadian184 2.1% Ukrainian155 1.7% Hungarian154 1.7% Italian128 1.4% Czech105 1.2% European84 0.9% Greek75 0.8% British74 0.8% Brazilian68 0.8% Polish60 0.7% Lebanese59 0.7% Portuguese47 0.5% Scotch-Irish44 0.5% Swedish43 0.5% Latvian33 0.4% Romanian31 0.3% Lithuanian28 0.3% Dutch16 0.2% Eastern European16 0.2% Estonian13 0.1% Canadian11 0.1% Austrian11 0.1% Croatian10 0.1% Turkish8 0.09% Russian6 0.07% Finnish5 0.06% Slovak
Geographical mobility in Panama City Beach Same house 1 year ago 12,249 82.7% White (Caucasian)1,077 74.3% Black or African American202 96.5% American Indian / Alaska Native88 51.2% Asian340 52.4% Other race891 65.1% Two or more races11,998 83.6% White alone, not Hispanic / Latino1,069 61.7% Hispanic or LatinoMoved within same county 837 5.6% White / Caucasian125 8.6% Black or African American16 9.2% Asian25 3.9% Other race352 25.7% Two or more races711 5.0% White alone, not Hispanic / Latino235 13.6% Hispanic or LatinoMoved within same state 181 1.2% White / Caucasian339 23.4% Black or African American8 3.8% American Indian / Alaska Native16 1.2% Two or more races150 1.0% White alone, not Hispanic / Latino29 1.7% Hispanic or LatinoMoved from different state 1,661 11.2% White / Caucasian54 3.7% Black or African American4 1.7% American Indian / Alaska Native66 38.3% Asian132 20.3% Other race74 5.4% Two or more races1,668 11.6% White alone, not Hispanic / Latino199 11.5% Hispanic or LatinoMoved from abroad 19 0.1% White220 33.9% Other race43 3.1% Two or more races23 0.2% White alone, not Hispanic / Latino100 5.8% Hispanic or Latino
Children Nativity (place of birth) in Panama City Beach
Children under 6 years - Living with two parents Both parents native 367 100.0% NativeBoth parents foreign-born 48 100.0% NativeOne native, one foreign-born parent 43 100.0% NativeChildren under 6 years - Living with one parent Native parent 255 100.0% NativeChildren 6 to 17 years - Living with two parents Both parents native 965 99.7% Native3 0.3% Foreign-bornBoth parents foreign-born 217 81.0% Native51 19.0% Foreign-bornOne native, one foreign-born parent 255 100.0% NativeChildren 6 to 17 years - Living with one parent Native parent 542 86.9% Native82 13.1% Foreign-bornForeign-born parent 77 100.0% Native
Grandparents responsible for own grandchildren in Panama City Beach
Grandparents (30 to 59 years) White / Caucasian 21 100.0% Responsible for grandchildrenAmerican Indian / Alaska Native 10 100.0% Not responsible for grandchildrenTwo or more races 18 100.0% Not responsible for grandchildrenWhite alone, not Hispanic / Latino 23 100.0% Responsible for grandchildrenGrandparents (60 years and over) White / Caucasian 65 41.9% Responsible for grandchildren90 58.1% Not responsible for grandchildrenWhite alone, not Hispanic / Latino 65 36.3% Responsible for grandchildren115 63.7% Not responsible for grandchildren