Races in Palos Hills, Illinois (IL) Detailed Stats
Data:
Races - White alone (%)
Races - White alone (% change since 2000)
Races - Black alone (%)
Races - Black alone (% change since 2000)
Races - American Indian alone (%)
Races - American Indian alone (% change since 2000)
Races - Asian alone (%)
Races - Asian alone (% change since 2000)
Races - Hispanic (%)
Races - Hispanic (% change since 2000)
Races - Native Hawaiian and Other Pacific Islander alone (%)
Races - Native Hawaiian and Other Pacific Islander alone (% change since 2000)
Races - Two or more races(%)
Races - Two or more races(% change since 2000)
Races - Other race alone (%)
Races - Other race alone (% change since 2000)
Racial diversity
Place of birth - Born in state of residence (%)
Place of birth - Born in state of residence (%) - White
Place of birth - Born in state of residence (%) - Black or African American
Place of birth - Born in state of residence (%) - Asian
Place of birth - Born in state of residence (%) - Hispanic or Latino
Place of birth - Born in state of residence (%) - American Indian and Alaska Native
Place of birth - Born in state of residence (%) - Multirace
Place of birth - Born in state of residence (%) - Other Race
Place of birth - Born in other state (%)
Place of birth - Born in other state (%) - White
Place of birth - Born in other state (%) - Black or African American
Place of birth - Born in other state (%) - Asian
Place of birth - Born in other state (%) - Hispanic or Latino
Place of birth - Born in other state (%) - American Indian and Alaska Native
Place of birth - Born in other state (%) - Multirace
Place of birth - Born in other state (%) - Other Race
Place of birth - Native, outside of US (%)
Place of birth - Native, outside of US (%) - White
Place of birth - Native, outside of US (%) - Black or African American
Place of birth - Native, outside of US (%) - Asian
Place of birth - Native, outside of US (%) - Hispanic or Latino
Place of birth - Native, outside of US (%) - American Indian and Alaska Native
Place of birth - Native, outside of US (%) - Multirace
Place of birth - Native, outside of US (%) - Other Race
Place of birth - Foreign born (%)
Place of birth - Foreign born (%) - White
Place of birth - Foreign born (%) - Black or African American
Place of birth - Foreign born (%) - Asian
Place of birth - Foreign born (%) - Hispanic or Latino
Place of birth - Foreign born (%) - American Indian and Alaska Native
Place of birth - Foreign born (%) - Multirace
Place of birth - Foreign born (%) - Other Race
Residents speaking English at home (%)
Residents speaking English at home - Born in the United States (%)
Residents speaking English at home - Native, born elsewhere (%)
Residents speaking English at home - Foreign born (%)
Residents speaking Spanish at home (%)
Residents speaking Spanish at home - Born in the United States (%)
Residents speaking Spanish at home - Native, born elsewhere (%)
Residents speaking Spanish at home - Foreign born (%)
Residents speaking other language at home (%)
Residents speaking other language at home - Born in the United States (%)
Residents speaking other language at home - Native, born elsewhere (%)
Residents speaking other language at home - Foreign born (%)
Marital status - Never married (%)
Marital status - Now married (%)
Marital status - Separated (%)
Marital status - Widowed (%)
Marital status - Divorced (%)
Ancestries Reported - Arab (%)
Ancestries Reported - Czech (%)
Ancestries Reported - Danish (%)
Ancestries Reported - Dutch (%)
Ancestries Reported - English (%)
Ancestries Reported - French (%)
Ancestries Reported - French Canadian (%)
Ancestries Reported - German (%)
Ancestries Reported - Greek (%)
Ancestries Reported - Hungarian (%)
Ancestries Reported - Irish (%)
Ancestries Reported - Italian (%)
Ancestries Reported - Lithuanian (%)
Ancestries Reported - Norwegian (%)
Ancestries Reported - Polish (%)
Ancestries Reported - Portuguese (%)
Ancestries Reported - Russian (%)
Ancestries Reported - Scotch-Irish (%)
Ancestries Reported - Scottish (%)
Ancestries Reported - Slovak (%)
Ancestries Reported - Subsaharan African (%)
Ancestries Reported - Swedish (%)
Ancestries Reported - Swiss (%)
Ancestries Reported - Ukrainian (%)
Ancestries Reported - United States (%)
Ancestries Reported - Welsh (%)
Ancestries Reported - West Indian (%)
Ancestries Reported - Other (%)
Geographical mobility - Same house 1 year ago (%)
Geographical mobility - Same house 1 year ago (%) - White
Geographical mobility - Same house 1 year ago (%) - Black or African American
Geographical mobility - Same house 1 year ago (%) - Asian
Geographical mobility - Same house 1 year ago (%) - Hispanic or Latino
Geographical mobility - Same house 1 year ago (%) - American Indian and Alaska Native
Geographical mobility - Same house 1 year ago (%) - Multirace
Geographical mobility - Same house 1 year ago (%) - Other Race
Geographical mobility - Moved within same county (%)
Geographical mobility - Moved within same county (%) - White
Geographical mobility - Moved within same county (%) - Black or African American
Geographical mobility - Moved within same county (%) - Asian
Geographical mobility - Moved within same county (%) - Hispanic or Latino
Geographical mobility - Moved within same county (%) - American Indian and Alaska Native
Geographical mobility - Moved within same county (%) - Multirace
Geographical mobility - Moved within same county (%) - Other Race
Geographical mobility - Moved from different county within same state (%)
Geographical mobility - Moved from different county within same state (%) - White
Geographical mobility - Moved from different county within same state (%) - Black or African American
Geographical mobility - Moved from different county within same state (%) - Asian
Geographical mobility - Moved from different county within same state (%) - Hispanic or Latino
Geographical mobility - Moved from different county within same state (%) - American Indian and Alaska Native
Geographical mobility - Moved from different county within same state (%) - Multirace
Geographical mobility - Moved from different county within same state (%) - Other Race
Geographical mobility - Moved from different state (%)
Geographical mobility - Moved from different state (%) - White
Geographical mobility - Moved from different state (%) - Black or African American
Geographical mobility - Moved from different state (%) - Asian
Geographical mobility - Moved from different state (%) - Hispanic or Latino
Geographical mobility - Moved from different state (%) - American Indian and Alaska Native
Geographical mobility - Moved from different state (%) - Multirace
Geographical mobility - Moved from different state (%) - Other Race
Geographical mobility - Moved from abroad (%)
Geographical mobility - Moved from abroad (%) - White
Geographical mobility - Moved from abroad (%) - Black or African American
Geographical mobility - Moved from abroad (%) - Asian
Geographical mobility - Moved from abroad (%) - Hispanic or Latino
Geographical mobility - Moved from abroad (%) - American Indian and Alaska Native
Geographical mobility - Moved from abroad (%) - Multirace
Geographical mobility - Moved from abroad (%) - Other Race
Place of birth for the foreign-born population - Ireland (%)
Place of birth for the foreign-born population - Denmark (%)
Place of birth for the foreign-born population - Norway (%)
Place of birth for the foreign-born population - Sweden (%)
Place of birth for the foreign-born population - United Kingdom (%)
Place of birth for the foreign-born population - England (%)
Place of birth for the foreign-born population - Scotland (%)
Place of birth for the foreign-born population - Other Northern Europe (%)
Place of birth for the foreign-born population - Austria (%)
Place of birth for the foreign-born population - Belgium (%)
Place of birth for the foreign-born population - France (%)
Place of birth for the foreign-born population - Germany (%)
Place of birth for the foreign-born population - Netherlands (%)
Place of birth for the foreign-born population - Switzerland (%)
Place of birth for the foreign-born population - Other Western Europe (%)
Place of birth for the foreign-born population - Greece (%)
Place of birth for the foreign-born population - Italy (%)
Place of birth for the foreign-born population - Portugal (%)
Place of birth for the foreign-born population - Spain (%)
Place of birth for the foreign-born population - Other Southern Europe (%)
Place of birth for the foreign-born population - Albania (%)
Place of birth for the foreign-born population - Belarus (%)
Place of birth for the foreign-born population - Bosnia and Herzegovina (%)
Place of birth for the foreign-born population - Bulgaria (%)
Place of birth for the foreign-born population - Croatia (%)
Place of birth for the foreign-born population - Czechoslovakia (%)
Place of birth for the foreign-born population - Hungary (%)
Place of birth for the foreign-born population - Latvia (%)
Place of birth for the foreign-born population - Lithuania (%)
Place of birth for the foreign-born population - North Macedonia (Macedonia) (%)
Place of birth for the foreign-born population - Moldova (%)
Place of birth for the foreign-born population - Poland (%)
Place of birth for the foreign-born population - Romania (%)
Place of birth for the foreign-born population - Russia (%)
Place of birth for the foreign-born population - Serbia (%)
Place of birth for the foreign-born population - Ukraine (%)
Place of birth for the foreign-born population - Other Eastern Europe (%)
Place of birth for the foreign-born population - China (%)
Place of birth for the foreign-born population - Hong Kong (%)
Place of birth for the foreign-born population - Taiwan (%)
Place of birth for the foreign-born population - Japan (%)
Place of birth for the foreign-born population - Korea (%)
Place of birth for the foreign-born population - Other Eastern Asia (%)
Place of birth for the foreign-born population - Afghanistan (%)
Place of birth for the foreign-born population - Bangladesh (%)
Place of birth for the foreign-born population - India (%)
Place of birth for the foreign-born population - Iran (%)
Place of birth for the foreign-born population - Kazakhstan (%)
Place of birth for the foreign-born population - Nepal (%)
Place of birth for the foreign-born population - Pakistan (%)
Place of birth for the foreign-born population - Sri Lanka (%)
Place of birth for the foreign-born population - Uzbekistan (%)
Place of birth for the foreign-born population - Other South Central Asia (%)
Place of birth for the foreign-born population - Burma (%)
Place of birth for the foreign-born population - Cambodia (%)
Place of birth for the foreign-born population - Indonesia (%)
Place of birth for the foreign-born population - Laos (%)
Place of birth for the foreign-born population - Malaysia (%)
Place of birth for the foreign-born population - Philippines (%)
Place of birth for the foreign-born population - Singapore (%)
Place of birth for the foreign-born population - Thailand (%)
Place of birth for the foreign-born population - Vietnam (%)
Place of birth for the foreign-born population - Other South Eastern Asia (%)
Place of birth for the foreign-born population - Armenia (%)
Place of birth for the foreign-born population - Iraq (%)
Place of birth for the foreign-born population - Israel (%)
Place of birth for the foreign-born population - Jordan (%)
Place of birth for the foreign-born population - Kuwait (%)
Place of birth for the foreign-born population - Lebanon (%)
Place of birth for the foreign-born population - Saudi Arabia (%)
Place of birth for the foreign-born population - Syria (%)
Place of birth for the foreign-born population - Turkey (%)
Place of birth for the foreign-born population - Yemen (%)
Place of birth for the foreign-born population - Other Western Asia (%)
Place of birth for the foreign-born population - Eritrea (%)
Place of birth for the foreign-born population - Ethiopia (%)
Place of birth for the foreign-born population - Kenya (%)
Place of birth for the foreign-born population - Somalia (%)
Place of birth for the foreign-born population - Uganda (%)
Place of birth for the foreign-born population - Zimbabwe (%)
Place of birth for the foreign-born population - Other Eastern Africa (%)
Place of birth for the foreign-born population - Cameroon (%)
Place of birth for the foreign-born population - Congo (%)
Place of birth for the foreign-born population - Democratic Republic of Congo (Zaire) (%)
Place of birth for the foreign-born population - Other Middle Africa (%)
Place of birth for the foreign-born population - Egypt (%)
Place of birth for the foreign-born population - Morocco (%)
Place of birth for the foreign-born population - Sudan (%)
Place of birth for the foreign-born population - Other Northern Africa (%)
Place of birth for the foreign-born population - South Africa (%)
Place of birth for the foreign-born population - Other Southern Africa (%)
Place of birth for the foreign-born population - Cabo Verde (%)
Place of birth for the foreign-born population - Ghana (%)
Place of birth for the foreign-born population - Liberia (%)
Place of birth for the foreign-born population - Nigeria (%)
Place of birth for the foreign-born population - Senegal (%)
Place of birth for the foreign-born population - Sierra Leone (%)
Place of birth for the foreign-born population - Other Western Africa (%)
Place of birth for the foreign-born population - Australia (%)
Place of birth for the foreign-born population - New Zealand (%)
Place of birth for the foreign-born population - Fiji (%)
Place of birth for the foreign-born population - Micronesia (%)
Place of birth for the foreign-born population - Bahamas (%)
Place of birth for the foreign-born population - Barbados (%)
Place of birth for the foreign-born population - Cuba (%)
Place of birth for the foreign-born population - Dominica (%)
Place of birth for the foreign-born population - Dominican Republic (%)
Place of birth for the foreign-born population - Grenada (%)
Place of birth for the foreign-born population - Haiti (%)
Place of birth for the foreign-born population - Jamaica (%)
Place of birth for the foreign-born population - St. Vincent and the Grenadines (%)
Place of birth for the foreign-born population - Trinidad and Tobago (%)
Place of birth for the foreign-born population - West Indies (%)
Place of birth for the foreign-born population - Other Caribbean (%)
Place of birth for the foreign-born population - Belize (%)
Place of birth for the foreign-born population - Costa Rica (%)
Place of birth for the foreign-born population - El Salvador (%)
Place of birth for the foreign-born population - Guatemala (%)
Place of birth for the foreign-born population - Honduras (%)
Place of birth for the foreign-born population - Mexico (%)
Place of birth for the foreign-born population - Nicaragua (%)
Place of birth for the foreign-born population - Panama (%)
Place of birth for the foreign-born population - Other Central America (%)
Place of birth for the foreign-born population - Argentina (%)
Place of birth for the foreign-born population - Bolivia (%)
Place of birth for the foreign-born population - Brazil (%)
Place of birth for the foreign-born population - Chile (%)
Place of birth for the foreign-born population - Colombia (%)
Place of birth for the foreign-born population - Ecuador (%)
Place of birth for the foreign-born population - Guyana (%)
Place of birth for the foreign-born population - Peru (%)
Place of birth for the foreign-born population - Uruguay (%)
Place of birth for the foreign-born population - Venezuela (%)
Place of birth for the foreign-born population - Other South America (%)
Place of birth for the foreign-born population - Canada (%)
Place of birth for the foreign-born population - Other Northern America (%)
Place of birth for the foreign-born population - Other (%)
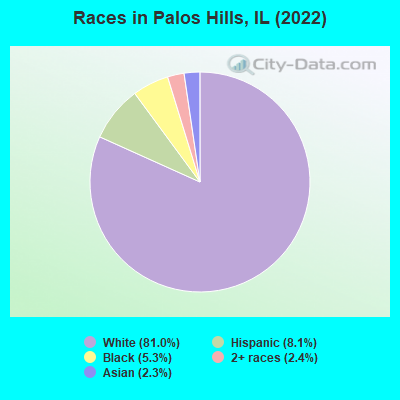
According to 2022 data, the most numerous races in Palos Hills, IL are White alone (14,472 residents), Hispanic (1,448 residents), and Black alone (940 residents). 55.8% of Palos Hills residents speak English at home. 28.3% of Palos Hills, IL residents are foreign-born (18.2% born in Europe, 5.4% born in Asia), which is 50.5% greater than the foreign-born rate of 14.0% across the entire state of Illinois.
Race distribution in Palos Hills
2000 2022
8,424,140 67.8% White alone 1,856,152 14.9% Black alone 1,530,262 12.3% Hispanic 419,916 3.4% Asian alone 153,996 1.2% Two or more races 13,479 0.1% Other race alone 18,232 0.1% American Indian alone 3,116 0.03% Native Hawaiian and Other
7,356,301 58.5% White alone 2,299,726 18.3% Hispanic 1,660,423 13.2% Black alone 747,296 5.9% Asian alone 458,599 3.6% Two or more races 45,386 0.4% Other race alone 10,405 0.08% American Indian alone 3,896 0.03% Native Hawaiian and Other
Income and house value in Palos Hills Median household income in 2022 $77,340 White non-Hispanic householders$60,193 Black householders$119,091 Asian householders$95,206 Some other race householders$96,486 Hispanic or Latino race householdersMedian 2022 house value $275,203 White Non-Hispanic householders$356,480 Black or African American householders $275,836 Asian householders$268,707 Some other race householders$369,630 Two or more races householders$264,270 Hispanic or Latino householders
Median age by race in Palos Hills
44.5 Median age for White residents41.0 49.5 33.2 Median age for Black or African American residents42.7 30.3 -680,473,372.1 Median age for American Indian / Alaska Native residents-736,736,736.0 -641,399,416.3 57.4 Median age for Asian residents52.5 78.6 -687,999,999.3 Median age for Native Hawaiian / Pacific Islander residents-918,721,460.3 -610,229,276.3 26.9 Median age for Other race residents24.9 55.9 36.4 Median age for Two or more races residents36.4 28.8 43.4 Median age for White alone residents39.2 48.3 42.6 Median age for Hispanic or Latino residents43.0 39.3
Owner/renter occupied households by race in Palos Hills
House owners and renters - White residents 5,073 82.3% Owner occupied1,090 17.7% Renter occupiedHouse owners and renters - Black or African American residents 42 10.8% Owner occupied350 89.2% Renter occupiedHouse owners and renters - Asian residents 96 88.4% Owner occupied13 11.6% Renter occupiedHouse owners and renters - Other race residents 32 67.9% Owner occupied15 32.1% Renter occupiedHouse owners and renters - Two or more races residents 300 100.0% Owner occupiedHouse owners and renters - White alone residents 5,226 82.1% Owner occupied1,136 17.9% Renter occupiedHouse owners and renters - Hispanic or Latino residents 365 84.9% Owner occupied65 15.1% Renter occupied
Language usage in Palos Hills
English speakers - Total 55.8% of residents of Palos Hills speak English at home.
4.5% of residents speak Spanish at home 426 54.9% Speak English very well350 45.1% Speak English less than very well40.2% of residents speak other language at home 4,389 63.1% Speak English very well2,570 36.9% Speak English less than very well
English speakers - Born in the United States 82.0% of residents of Palos Hills speak English at home.
2.1% of residents speak Spanish at home 22 100.0% Speak English very well17.5% of residents speak other language at home 180 100.0% Speak English very well
English speakers - Native, born elsewhere 15.8% of residents of Palos Hills speak English at home.
28.8% of residents speak Spanish at home 95 100.0% Speak English very well56.4% of residents speak other language at home 119 64.0% Speak English very well67 36.0% Speak English less than very well
English speakers - Foreign-born 9.5% of residents of Palos Hills speak English at home.
8.1% of residents speak Spanish at home 60 14.7% Speak English very well348 85.3% Speak English less than very well81.9% of residents speak other language at home 1,907 46.1% Speak English very well2,231 53.9% Speak English less than very well
White (Caucasian) - Speak only English Native:
76.7% (7,497)Foreign-born:
11.3% (373)
White (Caucasian) - Speak another language Native:
19.8% (1,933)Foreign-born:
88.5% (2,927)
Black or African American - Speak only English Native:
98.1% (848)Foreign-born:
99.0% (54)
Black or African American - Speak another language Native:
1.9% (17)Foreign-born:
15.5% (8)
Asian - Speak only English Native:
70.8% (38)Foreign-born:
1.5% (5)
Asian - Speak another language Native:
29.3% (16)Foreign-born:
99.9% (348)
Other race - Speak another language Native:
28.0% (31)Foreign-born:
100.0% (44)
Two or more races - Speak another language Native:
29.1% (221)Foreign-born:
100.0% (343)
White alone - Speak only English Native:
73.6% (7,310)Foreign-born:
8.5% (342)
White alone - Speak another language Native:
28.4% (2,818)Foreign-born:
92.3% (3,731)
Hispanic or Latino - Speak only English Native:
57.6% (531)Foreign-born:
14.7% (71)
Hispanic or Latino - Speak another language Native:
44.0% (405)Foreign-born:
84.1% (408)
Foreign-born residents in Palos Hills 5,051 residents are foreign born (18.2% Europe , 5.4% Asia ).
This city:
28.3%Illinois:
14.1%
Marital status for residents in Palos Hills Marital status - White (Caucasian) population 15 years and over
Males 34.6% Never married49.8% Now married0.5% Separated5.9% Widowed9.3% DivorcedFemales 30.1% Never married44.8% Now married0.6% Separated13.6% Widowed10.9% DivorcedWomen who gave birth in the past 12 months Now married:
100.0% (103)Unmarried:
0.0% (0)
Women who did not give birth in the past 12 months Now married:
39.3% (1,167)Unmarried:
60.7% (1,801)
Marital status - Black or African American population 15 years and over
Males 61.1% Never married12.2% Now married18.2% Separated0.3% Widowed8.2% DivorcedFemales 73.8% Never married3.1% Now married8.4% Separated2.6% Widowed12.1% DivorcedWomen who did not give birth in the past 12 months Now married:
4.3% (13)Unmarried:
95.7% (297)
Marital status - Asian population 15 years and over
Males 34.8% Never married51.8% Now married0.0% Separated13.5% Widowed0.0% DivorcedFemales 8.9% Never married35.2% Now married0.0% Separated55.9% Widowed0.0% DivorcedWomen who did not give birth in the past 12 months Now married:
64.4% (38)Unmarried:
35.6% (21)
Marital status - Other race population 15 years and over
Males 76.0% Never married24.0% Now married0.0% Separated0.0% Widowed0.0% DivorcedFemales 0.0% Never married72.2% Now married0.0% Separated27.8% Widowed0.0% DivorcedMarital status - Two or more races population 15 years and over
Males 44.5% Never married38.0% Now married0.0% Separated0.0% Widowed17.5% DivorcedFemales 50.9% Never married46.7% Now married0.0% Separated0.0% Widowed2.4% DivorcedWomen who gave birth in the past 12 months Now married:
0.0% (0)Unmarried:
100.0% (37)
Women who did not give birth in the past 12 months Now married:
8.0% (10)Unmarried:
92.0% (112)
Marital status - White alone, not Hispanic / Latino population 15 years and over
Males 35.1% Never married48.4% Now married0.6% Separated6.3% Widowed9.8% DivorcedFemales 29.9% Never married43.6% Now married0.6% Separated14.4% Widowed11.5% DivorcedWomen who gave birth in the past 12 months Now married:
100.0% (116)Unmarried:
0.0% (0)
Women who did not give birth in the past 12 months Now married:
38.6% (1,194)Unmarried:
61.4% (1,900)
Marital status - Hispanic or Latino population 15 years and over
Males 28.6% Never married61.6% Now married0.1% Separated0.0% Widowed9.7% DivorcedFemales 37.7% Never married61.4% Now married0.0% Separated0.9% Widowed0.0% DivorcedWomen who gave birth in the past 12 months Now married:
0.0% (0)Unmarried:
100.0% (27)
Women who did not give birth in the past 12 months Now married:
40.8% (122)Unmarried:
59.2% (177)
Ancestries in Palos Hills
4,339 40.9% Polish563 5.3% Italian515 4.9% Irish456 4.3% Lithuanian437 4.1% Albanian327 3.1% Greek296 2.8% Arab268 2.5% American218 2.1% German217 2.0% Jordanian200 1.9% Palestinian178 1.7% Macedonian136 1.3% English122 1.2% Croatian113 1.1% Syrian81 0.8% Serbian69 0.7% Ukrainian63 0.6% Egyptian35 0.3% Czechoslovakian34 0.3% Czech31 0.3% Scottish27 0.3% Russian20 0.2% Austrian15 0.1% Slovak14 0.1% Dutch14 0.1% African14 0.1% Swiss14 0.1% Haitian11 0.1% French11 0.1% Romanian11 0.1% Scotch-Irish10 0.09% Lebanese9 0.08% Danish9 0.08% Nigerian7 0.07% Hungarian6 0.06% Celtic
Children Nativity (place of birth) in Palos Hills
Children under 6 years - Living with two parents Both parents native 174 100.0% NativeBoth parents foreign-born 221 100.0% NativeOne native, one foreign-born parent 313 100.0% NativeChildren under 6 years - Living with one parent Native parent 197 100.0% NativeChildren 6 to 17 years - Living with two parents Both parents native 459 100.0% NativeBoth parents foreign-born 718 97.3% Native20 2.7% Foreign-bornOne native, one foreign-born parent 303 100.0% NativeChildren 6 to 17 years - Living with one parent Native parent 486 100.0% NativeForeign-born parent 512 50.1% Native510 49.9% Foreign-born
Grandparents responsible for own grandchildren in Palos Hills
Grandparents (30 to 59 years) White / Caucasian 9 100.0% Not responsible for grandchildrenWhite alone, not Hispanic / Latino 8 100.0% Not responsible for grandchildren
Grandparents (60 years and over) White / Caucasian 203 100.0% Not responsible for grandchildrenWhite alone, not Hispanic / Latino 261 100.0% Not responsible for grandchildren