Races in Palm Harbor, Florida (FL) Detailed Stats
Data:
Races - White alone (%)
Races - White alone (% change since 2000)
Races - Black alone (%)
Races - Black alone (% change since 2000)
Races - American Indian alone (%)
Races - American Indian alone (% change since 2000)
Races - Asian alone (%)
Races - Asian alone (% change since 2000)
Races - Hispanic (%)
Races - Hispanic (% change since 2000)
Races - Native Hawaiian and Other Pacific Islander alone (%)
Races - Native Hawaiian and Other Pacific Islander alone (% change since 2000)
Races - Two or more races(%)
Races - Two or more races(% change since 2000)
Races - Other race alone (%)
Races - Other race alone (% change since 2000)
Racial diversity
Place of birth - Born in state of residence (%)
Place of birth - Born in state of residence (%) - White
Place of birth - Born in state of residence (%) - Black or African American
Place of birth - Born in state of residence (%) - Asian
Place of birth - Born in state of residence (%) - Hispanic or Latino
Place of birth - Born in state of residence (%) - American Indian and Alaska Native
Place of birth - Born in state of residence (%) - Multirace
Place of birth - Born in state of residence (%) - Other Race
Place of birth - Born in other state (%)
Place of birth - Born in other state (%) - White
Place of birth - Born in other state (%) - Black or African American
Place of birth - Born in other state (%) - Asian
Place of birth - Born in other state (%) - Hispanic or Latino
Place of birth - Born in other state (%) - American Indian and Alaska Native
Place of birth - Born in other state (%) - Multirace
Place of birth - Born in other state (%) - Other Race
Place of birth - Native, outside of US (%)
Place of birth - Native, outside of US (%) - White
Place of birth - Native, outside of US (%) - Black or African American
Place of birth - Native, outside of US (%) - Asian
Place of birth - Native, outside of US (%) - Hispanic or Latino
Place of birth - Native, outside of US (%) - American Indian and Alaska Native
Place of birth - Native, outside of US (%) - Multirace
Place of birth - Native, outside of US (%) - Other Race
Place of birth - Foreign born (%)
Place of birth - Foreign born (%) - White
Place of birth - Foreign born (%) - Black or African American
Place of birth - Foreign born (%) - Asian
Place of birth - Foreign born (%) - Hispanic or Latino
Place of birth - Foreign born (%) - American Indian and Alaska Native
Place of birth - Foreign born (%) - Multirace
Place of birth - Foreign born (%) - Other Race
Residents speaking English at home (%)
Residents speaking English at home - Born in the United States (%)
Residents speaking English at home - Native, born elsewhere (%)
Residents speaking English at home - Foreign born (%)
Residents speaking Spanish at home (%)
Residents speaking Spanish at home - Born in the United States (%)
Residents speaking Spanish at home - Native, born elsewhere (%)
Residents speaking Spanish at home - Foreign born (%)
Residents speaking other language at home (%)
Residents speaking other language at home - Born in the United States (%)
Residents speaking other language at home - Native, born elsewhere (%)
Residents speaking other language at home - Foreign born (%)
Marital status - Never married (%)
Marital status - Now married (%)
Marital status - Separated (%)
Marital status - Widowed (%)
Marital status - Divorced (%)
Ancestries Reported - Arab (%)
Ancestries Reported - Czech (%)
Ancestries Reported - Danish (%)
Ancestries Reported - Dutch (%)
Ancestries Reported - English (%)
Ancestries Reported - French (%)
Ancestries Reported - French Canadian (%)
Ancestries Reported - German (%)
Ancestries Reported - Greek (%)
Ancestries Reported - Hungarian (%)
Ancestries Reported - Irish (%)
Ancestries Reported - Italian (%)
Ancestries Reported - Lithuanian (%)
Ancestries Reported - Norwegian (%)
Ancestries Reported - Polish (%)
Ancestries Reported - Portuguese (%)
Ancestries Reported - Russian (%)
Ancestries Reported - Scotch-Irish (%)
Ancestries Reported - Scottish (%)
Ancestries Reported - Slovak (%)
Ancestries Reported - Subsaharan African (%)
Ancestries Reported - Swedish (%)
Ancestries Reported - Swiss (%)
Ancestries Reported - Ukrainian (%)
Ancestries Reported - United States (%)
Ancestries Reported - Welsh (%)
Ancestries Reported - West Indian (%)
Ancestries Reported - Other (%)
Geographical mobility - Same house 1 year ago (%)
Geographical mobility - Same house 1 year ago (%) - White
Geographical mobility - Same house 1 year ago (%) - Black or African American
Geographical mobility - Same house 1 year ago (%) - Asian
Geographical mobility - Same house 1 year ago (%) - Hispanic or Latino
Geographical mobility - Same house 1 year ago (%) - American Indian and Alaska Native
Geographical mobility - Same house 1 year ago (%) - Multirace
Geographical mobility - Same house 1 year ago (%) - Other Race
Geographical mobility - Moved within same county (%)
Geographical mobility - Moved within same county (%) - White
Geographical mobility - Moved within same county (%) - Black or African American
Geographical mobility - Moved within same county (%) - Asian
Geographical mobility - Moved within same county (%) - Hispanic or Latino
Geographical mobility - Moved within same county (%) - American Indian and Alaska Native
Geographical mobility - Moved within same county (%) - Multirace
Geographical mobility - Moved within same county (%) - Other Race
Geographical mobility - Moved from different county within same state (%)
Geographical mobility - Moved from different county within same state (%) - White
Geographical mobility - Moved from different county within same state (%) - Black or African American
Geographical mobility - Moved from different county within same state (%) - Asian
Geographical mobility - Moved from different county within same state (%) - Hispanic or Latino
Geographical mobility - Moved from different county within same state (%) - American Indian and Alaska Native
Geographical mobility - Moved from different county within same state (%) - Multirace
Geographical mobility - Moved from different county within same state (%) - Other Race
Geographical mobility - Moved from different state (%)
Geographical mobility - Moved from different state (%) - White
Geographical mobility - Moved from different state (%) - Black or African American
Geographical mobility - Moved from different state (%) - Asian
Geographical mobility - Moved from different state (%) - Hispanic or Latino
Geographical mobility - Moved from different state (%) - American Indian and Alaska Native
Geographical mobility - Moved from different state (%) - Multirace
Geographical mobility - Moved from different state (%) - Other Race
Geographical mobility - Moved from abroad (%)
Geographical mobility - Moved from abroad (%) - White
Geographical mobility - Moved from abroad (%) - Black or African American
Geographical mobility - Moved from abroad (%) - Asian
Geographical mobility - Moved from abroad (%) - Hispanic or Latino
Geographical mobility - Moved from abroad (%) - American Indian and Alaska Native
Geographical mobility - Moved from abroad (%) - Multirace
Geographical mobility - Moved from abroad (%) - Other Race
Place of birth for the foreign-born population - Ireland (%)
Place of birth for the foreign-born population - Denmark (%)
Place of birth for the foreign-born population - Norway (%)
Place of birth for the foreign-born population - Sweden (%)
Place of birth for the foreign-born population - United Kingdom (%)
Place of birth for the foreign-born population - England (%)
Place of birth for the foreign-born population - Scotland (%)
Place of birth for the foreign-born population - Other Northern Europe (%)
Place of birth for the foreign-born population - Austria (%)
Place of birth for the foreign-born population - Belgium (%)
Place of birth for the foreign-born population - France (%)
Place of birth for the foreign-born population - Germany (%)
Place of birth for the foreign-born population - Netherlands (%)
Place of birth for the foreign-born population - Switzerland (%)
Place of birth for the foreign-born population - Other Western Europe (%)
Place of birth for the foreign-born population - Greece (%)
Place of birth for the foreign-born population - Italy (%)
Place of birth for the foreign-born population - Portugal (%)
Place of birth for the foreign-born population - Spain (%)
Place of birth for the foreign-born population - Other Southern Europe (%)
Place of birth for the foreign-born population - Albania (%)
Place of birth for the foreign-born population - Belarus (%)
Place of birth for the foreign-born population - Bosnia and Herzegovina (%)
Place of birth for the foreign-born population - Bulgaria (%)
Place of birth for the foreign-born population - Croatia (%)
Place of birth for the foreign-born population - Czechoslovakia (%)
Place of birth for the foreign-born population - Hungary (%)
Place of birth for the foreign-born population - Latvia (%)
Place of birth for the foreign-born population - Lithuania (%)
Place of birth for the foreign-born population - North Macedonia (Macedonia) (%)
Place of birth for the foreign-born population - Moldova (%)
Place of birth for the foreign-born population - Poland (%)
Place of birth for the foreign-born population - Romania (%)
Place of birth for the foreign-born population - Russia (%)
Place of birth for the foreign-born population - Serbia (%)
Place of birth for the foreign-born population - Ukraine (%)
Place of birth for the foreign-born population - Other Eastern Europe (%)
Place of birth for the foreign-born population - China (%)
Place of birth for the foreign-born population - Hong Kong (%)
Place of birth for the foreign-born population - Taiwan (%)
Place of birth for the foreign-born population - Japan (%)
Place of birth for the foreign-born population - Korea (%)
Place of birth for the foreign-born population - Other Eastern Asia (%)
Place of birth for the foreign-born population - Afghanistan (%)
Place of birth for the foreign-born population - Bangladesh (%)
Place of birth for the foreign-born population - India (%)
Place of birth for the foreign-born population - Iran (%)
Place of birth for the foreign-born population - Kazakhstan (%)
Place of birth for the foreign-born population - Nepal (%)
Place of birth for the foreign-born population - Pakistan (%)
Place of birth for the foreign-born population - Sri Lanka (%)
Place of birth for the foreign-born population - Uzbekistan (%)
Place of birth for the foreign-born population - Other South Central Asia (%)
Place of birth for the foreign-born population - Burma (%)
Place of birth for the foreign-born population - Cambodia (%)
Place of birth for the foreign-born population - Indonesia (%)
Place of birth for the foreign-born population - Laos (%)
Place of birth for the foreign-born population - Malaysia (%)
Place of birth for the foreign-born population - Philippines (%)
Place of birth for the foreign-born population - Singapore (%)
Place of birth for the foreign-born population - Thailand (%)
Place of birth for the foreign-born population - Vietnam (%)
Place of birth for the foreign-born population - Other South Eastern Asia (%)
Place of birth for the foreign-born population - Armenia (%)
Place of birth for the foreign-born population - Iraq (%)
Place of birth for the foreign-born population - Israel (%)
Place of birth for the foreign-born population - Jordan (%)
Place of birth for the foreign-born population - Kuwait (%)
Place of birth for the foreign-born population - Lebanon (%)
Place of birth for the foreign-born population - Saudi Arabia (%)
Place of birth for the foreign-born population - Syria (%)
Place of birth for the foreign-born population - Turkey (%)
Place of birth for the foreign-born population - Yemen (%)
Place of birth for the foreign-born population - Other Western Asia (%)
Place of birth for the foreign-born population - Eritrea (%)
Place of birth for the foreign-born population - Ethiopia (%)
Place of birth for the foreign-born population - Kenya (%)
Place of birth for the foreign-born population - Somalia (%)
Place of birth for the foreign-born population - Uganda (%)
Place of birth for the foreign-born population - Zimbabwe (%)
Place of birth for the foreign-born population - Other Eastern Africa (%)
Place of birth for the foreign-born population - Cameroon (%)
Place of birth for the foreign-born population - Congo (%)
Place of birth for the foreign-born population - Democratic Republic of Congo (Zaire) (%)
Place of birth for the foreign-born population - Other Middle Africa (%)
Place of birth for the foreign-born population - Egypt (%)
Place of birth for the foreign-born population - Morocco (%)
Place of birth for the foreign-born population - Sudan (%)
Place of birth for the foreign-born population - Other Northern Africa (%)
Place of birth for the foreign-born population - South Africa (%)
Place of birth for the foreign-born population - Other Southern Africa (%)
Place of birth for the foreign-born population - Cabo Verde (%)
Place of birth for the foreign-born population - Ghana (%)
Place of birth for the foreign-born population - Liberia (%)
Place of birth for the foreign-born population - Nigeria (%)
Place of birth for the foreign-born population - Senegal (%)
Place of birth for the foreign-born population - Sierra Leone (%)
Place of birth for the foreign-born population - Other Western Africa (%)
Place of birth for the foreign-born population - Australia (%)
Place of birth for the foreign-born population - New Zealand (%)
Place of birth for the foreign-born population - Fiji (%)
Place of birth for the foreign-born population - Micronesia (%)
Place of birth for the foreign-born population - Bahamas (%)
Place of birth for the foreign-born population - Barbados (%)
Place of birth for the foreign-born population - Cuba (%)
Place of birth for the foreign-born population - Dominica (%)
Place of birth for the foreign-born population - Dominican Republic (%)
Place of birth for the foreign-born population - Grenada (%)
Place of birth for the foreign-born population - Haiti (%)
Place of birth for the foreign-born population - Jamaica (%)
Place of birth for the foreign-born population - St. Vincent and the Grenadines (%)
Place of birth for the foreign-born population - Trinidad and Tobago (%)
Place of birth for the foreign-born population - West Indies (%)
Place of birth for the foreign-born population - Other Caribbean (%)
Place of birth for the foreign-born population - Belize (%)
Place of birth for the foreign-born population - Costa Rica (%)
Place of birth for the foreign-born population - El Salvador (%)
Place of birth for the foreign-born population - Guatemala (%)
Place of birth for the foreign-born population - Honduras (%)
Place of birth for the foreign-born population - Mexico (%)
Place of birth for the foreign-born population - Nicaragua (%)
Place of birth for the foreign-born population - Panama (%)
Place of birth for the foreign-born population - Other Central America (%)
Place of birth for the foreign-born population - Argentina (%)
Place of birth for the foreign-born population - Bolivia (%)
Place of birth for the foreign-born population - Brazil (%)
Place of birth for the foreign-born population - Chile (%)
Place of birth for the foreign-born population - Colombia (%)
Place of birth for the foreign-born population - Ecuador (%)
Place of birth for the foreign-born population - Guyana (%)
Place of birth for the foreign-born population - Peru (%)
Place of birth for the foreign-born population - Uruguay (%)
Place of birth for the foreign-born population - Venezuela (%)
Place of birth for the foreign-born population - Other South America (%)
Place of birth for the foreign-born population - Canada (%)
Place of birth for the foreign-born population - Other Northern America (%)
Place of birth for the foreign-born population - Other (%)
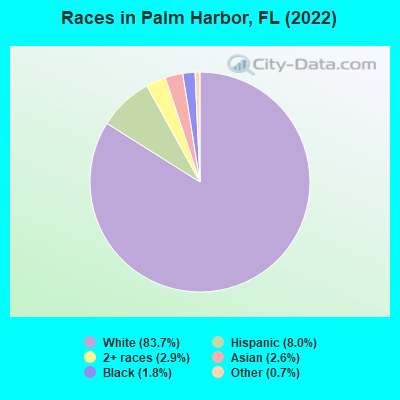
According to 2022 data, the most numerous races in Palm Harbor, FL are White alone (51,644 residents), Hispanic (4,963 residents), and Black alone (1,096 residents). 85.9% of Palm Harbor residents speak English at home. 13.5% of Palm Harbor, FL residents are foreign-born (4.9% born in Europe, 2.9% born in Latin America, 2.6% born in Asia, 1.6% born in Africa), which is 55.3% less than the foreign-born rate of 21.0% across the entire state of Florida.
Race distribution in Palm Harbor
2000 2022
10,458,509 65.4% White alone 2,682,715 16.8% Hispanic 2,264,268 14.2% Black alone 261,693 1.6% Asian alone 236,954 1.5% Two or more races 42,358 0.3% American Indian alone 28,994 0.2% Other race alone 6,887 0.04% Native Hawaiian and Other
11,309,403 50.8% White alone 6,025,039 27.1% Hispanic 3,241,015 14.6% Black alone 861,630 3.9% Two or more races 623,692 2.8% Asian alone 152,054 0.7% Other race alone 22,504 0.1% American Indian alone 9,486 0.04% Native Hawaiian and Other
Income and house value in Palm Harbor Median household income in 2022 $82,234 White non-Hispanic householders$78,141 Asian householders$153,973 Some other race householders$90,549 Two or more races householders$106,068 Hispanic or Latino race householdersMedian 2022 house value $468,585 White Non-Hispanic householders$524,815 Black or African American householders $529,313 Asian householders$322,011 Some other race householders$491,077 Two or more races householders$417,603 Hispanic or Latino householders
Median age by race in Palm Harbor
53.1 Median age for White residents51.1 54.9 40.4 Median age for Black or African American residents36.9 39.0 -666,666,666.0 Median age for American Indian / Alaska Native residents-666,666,666.0 -666,666,666.0 61.0 Median age for Asian residents60.1 67.2 -666,666,666.0 Median age for Native Hawaiian / Pacific Islander residents-666,666,666.0 -666,666,666.0 29.5 Median age for Other race residents23.3 30.1 37.3 Median age for Two or more races residents30.7 55.0 53.3 Median age for White alone residents51.3 55.2 32.9 Median age for Hispanic or Latino residents48.0 28.4
Owner/renter occupied households by race in Palm Harbor
House owners and renters - White residents 19,751 79.2% Owner occupied5,188 20.8% Renter occupiedHouse owners and renters - Black or African American residents 185 54.8% Owner occupied153 45.2% Renter occupiedHouse owners and renters - American Indian / Alaska Native residents 6 7.7% Owner occupied75 92.3% Renter occupiedHouse owners and renters - Asian residents 352 73.8% Owner occupied125 26.2% Renter occupiedHouse owners and renters - Other race residents 89 72.1% Owner occupied35 27.9% Renter occupiedHouse owners and renters - Two or more races residents 1,951 91.2% Owner occupied189 8.8% Renter occupiedHouse owners and renters - White alone residents 19,263 78.8% Owner occupied5,188 21.2% Renter occupiedHouse owners and renters - Hispanic or Latino residents 1,137 77.3% Owner occupied333 22.7% Renter occupied
Language usage in Palm Harbor
English speakers - Total 85.9% of residents of Palm Harbor speak English at home.
5.4% of residents speak Spanish at home 1,851 52.2% Speak English very well1,697 47.8% Speak English less than very well8.7% of residents speak other language at home 3,343 59.1% Speak English very well2,315 40.9% Speak English less than very well
English speakers - Born in the United States 93.6% of residents of Palm Harbor speak English at home.
4.1% of residents speak Spanish at home 1,018 59.0% Speak English very well707 41.0% Speak English less than very well2.3% of residents speak other language at home 580 62.0% Speak English very well356 38.0% Speak English less than very well
English speakers - Native, born elsewhere 32.3% of residents of Palm Harbor speak English at home.
67.7% of residents speak Spanish at home 336 56.9% Speak English very well255 43.1% Speak English less than very well
English speakers - Foreign-born 33.1% of residents of Palm Harbor speak English at home.
12.1% of residents speak Spanish at home 497 49.3% Speak English very well511 50.7% Speak English less than very well54.8% of residents speak other language at home 2,599 57.0% Speak English very well1,959 43.0% Speak English less than very well
White (Caucasian) - Speak only English Native:
97.3% (50,167)Foreign-born:
31.5% (1,872)
White (Caucasian) - Speak another language Native:
2.7% (1,395)Foreign-born:
68.5% (4,070)
Black or African American - Speak only English Native:
92.9% (768)Foreign-born:
86.9% (174)
Black or African American - Speak another language Native:
5.3% (44)Foreign-born:
16.8% (34)
Asian - Speak only English Native:
57.9% (316)Foreign-born:
33.1% (349)
Asian - Speak another language Native:
41.9% (229)Foreign-born:
67.2% (709)
Other race - Speak only English Native:
74.1% (300)Foreign-born:
23.7% (64)
Other race - Speak another language Native:
26.2% (106)Foreign-born:
73.2% (197)
Two or more races - Speak only English Native:
58.6% (1,940)Foreign-born:
28.0% (336)
Two or more races - Speak another language Native:
40.7% (1,346)Foreign-born:
72.5% (868)
White alone - Speak only English Native:
98.2% (49,994)Foreign-born:
30.2% (1,678)
White alone - Speak another language Native:
1.8% (922)Foreign-born:
69.8% (3,871)
Hispanic or Latino - Speak only English Native:
34.6% (1,267)Foreign-born:
26.5% (250)
Hispanic or Latino - Speak another language Native:
65.4% (2,394)Foreign-born:
73.5% (693)
Foreign-born residents in Palm Harbor 8,342 residents are foreign born (4.9% Europe , 2.9% Latin America , 2.6% Asia , 1.6% Africa ).
This city:
13.5%Florida:
21.1%
Marital status for residents in Palm Harbor Marital status - White (Caucasian) population 15 years and over
Males 20.3% Never married63.6% Now married0.8% Separated2.3% Widowed13.1% DivorcedFemales 15.7% Never married56.9% Now married0.5% Separated13.0% Widowed13.9% DivorcedWomen who gave birth in the past 12 months Now married:
100.0% (297)Unmarried:
0.0% (0)
Women who did not give birth in the past 12 months Now married:
53.2% (4,568)Unmarried:
46.8% (4,022)
Marital status - Black or African American population 15 years and over
Males 48.5% Never married45.1% Now married0.0% Separated2.6% Widowed3.8% DivorcedFemales 40.4% Never married34.2% Now married0.0% Separated15.7% Widowed9.7% DivorcedWomen who gave birth in the past 12 months Now married:
100.0% (16)Unmarried:
0.0% (0)
Women who did not give birth in the past 12 months Now married:
27.4% (86)Unmarried:
72.6% (227)
Marital status - American Indian / Alaska Native population 15 years and over
Males 83.6% Never married0.0% Now married0.0% Separated16.4% Widowed0.0% DivorcedFemales 94.0% Never married6.0% Now married0.0% Separated0.0% Widowed0.0% DivorcedWomen who did not give birth in the past 12 months Now married:
0.0% (0)Unmarried:
100.0% (129)
Marital status - Asian population 15 years and over
Males 29.7% Never married60.1% Now married3.3% Separated0.9% Widowed5.9% DivorcedFemales 19.9% Never married64.6% Now married0.0% Separated5.1% Widowed10.4% DivorcedWomen who gave birth in the past 12 months Now married:
100.0% (11)Unmarried:
0.0% (0)
Women who did not give birth in the past 12 months Now married:
64.7% (295)Unmarried:
35.3% (161)
Marital status - Other race population 15 years and over
Males 25.9% Never married66.4% Now married0.0% Separated0.0% Widowed7.7% DivorcedFemales 52.3% Never married34.9% Now married0.0% Separated3.9% Widowed8.9% DivorcedWomen who gave birth in the past 12 months Now married:
0.0% (0)Unmarried:
100.0% (16)
Women who did not give birth in the past 12 months Now married:
35.1% (106)Unmarried:
64.9% (196)
Marital status - Two or more races population 15 years and over
Males 55.0% Never married39.9% Now married0.0% Separated0.9% Widowed4.2% DivorcedFemales 36.6% Never married39.0% Now married3.5% Separated11.6% Widowed9.2% DivorcedWomen who did not give birth in the past 12 months Now married:
41.4% (555)Unmarried:
58.6% (784)
Marital status - White alone, not Hispanic / Latino population 15 years and over
Males 20.9% Never married62.5% Now married0.8% Separated2.4% Widowed13.5% DivorcedFemales 15.8% Never married56.7% Now married0.5% Separated13.1% Widowed14.0% DivorcedWomen who gave birth in the past 12 months Now married:
100.0% (297)Unmarried:
0.0% (0)
Women who did not give birth in the past 12 months Now married:
52.7% (4,490)Unmarried:
47.3% (4,022)
Marital status - Hispanic or Latino population 15 years and over
Males 43.3% Never married44.4% Now married0.0% Separated2.0% Widowed10.4% DivorcedFemales 38.3% Never married41.0% Now married2.5% Separated6.1% Widowed12.0% DivorcedWomen who gave birth in the past 12 months Now married:
100.0% (10)Unmarried:
0.0% (0)
Women who did not give birth in the past 12 months Now married:
40.2% (519)Unmarried:
59.8% (773)
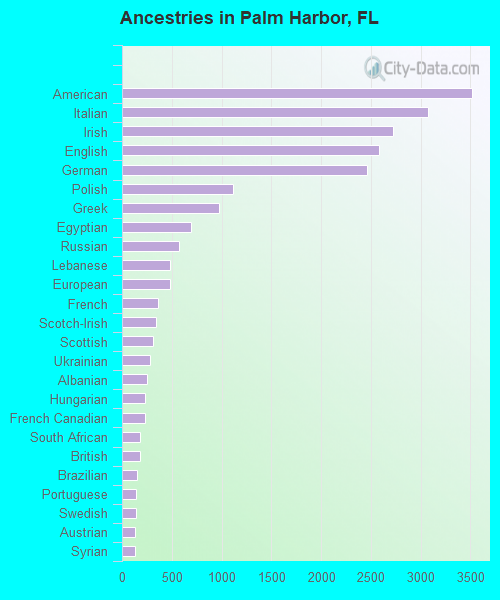
Ancestries in Palm Harbor
3,512 12.5% American3,073 11.0% Italian2,724 9.7% Irish2,585 9.2% English2,465 8.8% German1,115 4.0% Polish978 3.5% Greek690 2.5% Egyptian568 2.0% Russian482 1.7% Lebanese480 1.7% European366 1.3% French341 1.2% Scotch-Irish311 1.1% Scottish279 1.0% Ukrainian253 0.9% Albanian229 0.8% Hungarian227 0.8% French Canadian182 0.6% South African177 0.6% British155 0.6% Brazilian140 0.5% Portuguese136 0.5% Swedish130 0.5% Austrian126 0.4% Syrian122 0.4% Norwegian114 0.4% Belgian112 0.4% Eastern European97 0.3% Dutch91 0.3% Scandinavian86 0.3% Swiss71 0.3% Romanian68 0.2% Canadian65 0.2% Ethiopian65 0.2% Senegalese64 0.2% Slovak60 0.2% Welsh59 0.2% Moroccan59 0.2% Lithuanian51 0.2% Basque44 0.2% Ghanaian39 0.1% Croatian39 0.1% Celtic38 0.1% Yugoslavian31 0.1% Ugandan28 0.10% African27 0.10% Finnish24 0.09% Northern European22 0.08% Israeli22 0.08% Cypriot18 0.06% Danish15 0.05% Slovene11 0.04% Pennsylvania German10 0.04% Turkish9 0.03% Maltese9 0.03% Iranian9 0.03% Serbian
Geographical mobility in Palm Harbor Same house 1 year ago 52,791 88.7% White (Caucasian)797 73.4% Black or African American106 44.1% American Indian / Alaska Native1,482 88.7% Asian753 100.0% Other race4,736 91.9% Two or more races51,880 88.7% White alone, not Hispanic / Latino4,413 90.0% Hispanic or LatinoMoved within same county 2,229 3.7% White / Caucasian179 16.5% Black or African American106 44.3% American Indian / Alaska Native26 1.6% Asian12 1.7% Other race206 4.0% Two or more races2,101 3.6% White alone, not Hispanic / Latino172 3.5% Hispanic or LatinoMoved within same state 1,763 3.0% White / Caucasian33 3.0% Black or African American36 2.1% Asian14 1.9% Other race88 1.7% Two or more races1,763 3.0% White alone, not Hispanic / Latino179 3.7% Hispanic or LatinoMoved from different state 2,212 3.7% White / Caucasian36 3.3% Black or African American98 5.8% Asian51 1.0% Two or more races2,212 3.8% White alone, not Hispanic / Latino87 1.8% Hispanic or LatinoMoved from abroad 541 0.9% White127 2.5% Two or more races541 0.9% White alone, not Hispanic / Latino146 3.0% Hispanic or Latino
Children Nativity (place of birth) in Palm Harbor
Children under 6 years - Living with two parents Both parents native 1,354 100.0% NativeBoth parents foreign-born 123 63.0% Native73 37.0% Foreign-bornOne native, one foreign-born parent 239 100.0% NativeChildren under 6 years - Living with one parent Native parent 737 100.0% NativeChildren 6 to 17 years - Living with two parents Both parents native 3,332 100.0% NativeBoth parents foreign-born 236 27.8% Native613 72.2% Foreign-bornOne native, one foreign-born parent 594 100.0% NativeChildren 6 to 17 years - Living with one parent Native parent 1,675 100.0% NativeForeign-born parent 278 57.9% Native202 42.1% Foreign-born
Place of birth for residents in Palm Harbor
Grandparents responsible for own grandchildren in Palm Harbor
Grandparents (30 to 59 years) White / Caucasian 78 39.4% Responsible for grandchildren120 60.6% Not responsible for grandchildrenOther race 23 100.0% Responsible for grandchildrenWhite alone, not Hispanic / Latino 91 43.0% Responsible for grandchildren121 57.0% Not responsible for grandchildrenGrandparents (60 years and over) White / Caucasian 79 16.6% Responsible for grandchildren397 83.4% Not responsible for grandchildrenWhite alone, not Hispanic / Latino 76 16.6% Responsible for grandchildren381 83.4% Not responsible for grandchildren