Races in Palm Beach Gardens, Florida (FL) Detailed Stats
Data:
Races - White alone (%)
Races - White alone (% change since 2000)
Races - Black alone (%)
Races - Black alone (% change since 2000)
Races - American Indian alone (%)
Races - American Indian alone (% change since 2000)
Races - Asian alone (%)
Races - Asian alone (% change since 2000)
Races - Hispanic (%)
Races - Hispanic (% change since 2000)
Races - Native Hawaiian and Other Pacific Islander alone (%)
Races - Native Hawaiian and Other Pacific Islander alone (% change since 2000)
Races - Two or more races(%)
Races - Two or more races(% change since 2000)
Races - Other race alone (%)
Races - Other race alone (% change since 2000)
Racial diversity
Place of birth - Born in state of residence (%)
Place of birth - Born in state of residence (%) - White
Place of birth - Born in state of residence (%) - Black or African American
Place of birth - Born in state of residence (%) - Asian
Place of birth - Born in state of residence (%) - Hispanic or Latino
Place of birth - Born in state of residence (%) - American Indian and Alaska Native
Place of birth - Born in state of residence (%) - Multirace
Place of birth - Born in state of residence (%) - Other Race
Place of birth - Born in other state (%)
Place of birth - Born in other state (%) - White
Place of birth - Born in other state (%) - Black or African American
Place of birth - Born in other state (%) - Asian
Place of birth - Born in other state (%) - Hispanic or Latino
Place of birth - Born in other state (%) - American Indian and Alaska Native
Place of birth - Born in other state (%) - Multirace
Place of birth - Born in other state (%) - Other Race
Place of birth - Native, outside of US (%)
Place of birth - Native, outside of US (%) - White
Place of birth - Native, outside of US (%) - Black or African American
Place of birth - Native, outside of US (%) - Asian
Place of birth - Native, outside of US (%) - Hispanic or Latino
Place of birth - Native, outside of US (%) - American Indian and Alaska Native
Place of birth - Native, outside of US (%) - Multirace
Place of birth - Native, outside of US (%) - Other Race
Place of birth - Foreign born (%)
Place of birth - Foreign born (%) - White
Place of birth - Foreign born (%) - Black or African American
Place of birth - Foreign born (%) - Asian
Place of birth - Foreign born (%) - Hispanic or Latino
Place of birth - Foreign born (%) - American Indian and Alaska Native
Place of birth - Foreign born (%) - Multirace
Place of birth - Foreign born (%) - Other Race
Residents speaking English at home (%)
Residents speaking English at home - Born in the United States (%)
Residents speaking English at home - Native, born elsewhere (%)
Residents speaking English at home - Foreign born (%)
Residents speaking Spanish at home (%)
Residents speaking Spanish at home - Born in the United States (%)
Residents speaking Spanish at home - Native, born elsewhere (%)
Residents speaking Spanish at home - Foreign born (%)
Residents speaking other language at home (%)
Residents speaking other language at home - Born in the United States (%)
Residents speaking other language at home - Native, born elsewhere (%)
Residents speaking other language at home - Foreign born (%)
Marital status - Never married (%)
Marital status - Now married (%)
Marital status - Separated (%)
Marital status - Widowed (%)
Marital status - Divorced (%)
Ancestries Reported - Arab (%)
Ancestries Reported - Czech (%)
Ancestries Reported - Danish (%)
Ancestries Reported - Dutch (%)
Ancestries Reported - English (%)
Ancestries Reported - French (%)
Ancestries Reported - French Canadian (%)
Ancestries Reported - German (%)
Ancestries Reported - Greek (%)
Ancestries Reported - Hungarian (%)
Ancestries Reported - Irish (%)
Ancestries Reported - Italian (%)
Ancestries Reported - Lithuanian (%)
Ancestries Reported - Norwegian (%)
Ancestries Reported - Polish (%)
Ancestries Reported - Portuguese (%)
Ancestries Reported - Russian (%)
Ancestries Reported - Scotch-Irish (%)
Ancestries Reported - Scottish (%)
Ancestries Reported - Slovak (%)
Ancestries Reported - Subsaharan African (%)
Ancestries Reported - Swedish (%)
Ancestries Reported - Swiss (%)
Ancestries Reported - Ukrainian (%)
Ancestries Reported - United States (%)
Ancestries Reported - Welsh (%)
Ancestries Reported - West Indian (%)
Ancestries Reported - Other (%)
Geographical mobility - Same house 1 year ago (%)
Geographical mobility - Same house 1 year ago (%) - White
Geographical mobility - Same house 1 year ago (%) - Black or African American
Geographical mobility - Same house 1 year ago (%) - Asian
Geographical mobility - Same house 1 year ago (%) - Hispanic or Latino
Geographical mobility - Same house 1 year ago (%) - American Indian and Alaska Native
Geographical mobility - Same house 1 year ago (%) - Multirace
Geographical mobility - Same house 1 year ago (%) - Other Race
Geographical mobility - Moved within same county (%)
Geographical mobility - Moved within same county (%) - White
Geographical mobility - Moved within same county (%) - Black or African American
Geographical mobility - Moved within same county (%) - Asian
Geographical mobility - Moved within same county (%) - Hispanic or Latino
Geographical mobility - Moved within same county (%) - American Indian and Alaska Native
Geographical mobility - Moved within same county (%) - Multirace
Geographical mobility - Moved within same county (%) - Other Race
Geographical mobility - Moved from different county within same state (%)
Geographical mobility - Moved from different county within same state (%) - White
Geographical mobility - Moved from different county within same state (%) - Black or African American
Geographical mobility - Moved from different county within same state (%) - Asian
Geographical mobility - Moved from different county within same state (%) - Hispanic or Latino
Geographical mobility - Moved from different county within same state (%) - American Indian and Alaska Native
Geographical mobility - Moved from different county within same state (%) - Multirace
Geographical mobility - Moved from different county within same state (%) - Other Race
Geographical mobility - Moved from different state (%)
Geographical mobility - Moved from different state (%) - White
Geographical mobility - Moved from different state (%) - Black or African American
Geographical mobility - Moved from different state (%) - Asian
Geographical mobility - Moved from different state (%) - Hispanic or Latino
Geographical mobility - Moved from different state (%) - American Indian and Alaska Native
Geographical mobility - Moved from different state (%) - Multirace
Geographical mobility - Moved from different state (%) - Other Race
Geographical mobility - Moved from abroad (%)
Geographical mobility - Moved from abroad (%) - White
Geographical mobility - Moved from abroad (%) - Black or African American
Geographical mobility - Moved from abroad (%) - Asian
Geographical mobility - Moved from abroad (%) - Hispanic or Latino
Geographical mobility - Moved from abroad (%) - American Indian and Alaska Native
Geographical mobility - Moved from abroad (%) - Multirace
Geographical mobility - Moved from abroad (%) - Other Race
Place of birth for the foreign-born population - Ireland (%)
Place of birth for the foreign-born population - Denmark (%)
Place of birth for the foreign-born population - Norway (%)
Place of birth for the foreign-born population - Sweden (%)
Place of birth for the foreign-born population - United Kingdom (%)
Place of birth for the foreign-born population - England (%)
Place of birth for the foreign-born population - Scotland (%)
Place of birth for the foreign-born population - Other Northern Europe (%)
Place of birth for the foreign-born population - Austria (%)
Place of birth for the foreign-born population - Belgium (%)
Place of birth for the foreign-born population - France (%)
Place of birth for the foreign-born population - Germany (%)
Place of birth for the foreign-born population - Netherlands (%)
Place of birth for the foreign-born population - Switzerland (%)
Place of birth for the foreign-born population - Other Western Europe (%)
Place of birth for the foreign-born population - Greece (%)
Place of birth for the foreign-born population - Italy (%)
Place of birth for the foreign-born population - Portugal (%)
Place of birth for the foreign-born population - Spain (%)
Place of birth for the foreign-born population - Other Southern Europe (%)
Place of birth for the foreign-born population - Albania (%)
Place of birth for the foreign-born population - Belarus (%)
Place of birth for the foreign-born population - Bosnia and Herzegovina (%)
Place of birth for the foreign-born population - Bulgaria (%)
Place of birth for the foreign-born population - Croatia (%)
Place of birth for the foreign-born population - Czechoslovakia (%)
Place of birth for the foreign-born population - Hungary (%)
Place of birth for the foreign-born population - Latvia (%)
Place of birth for the foreign-born population - Lithuania (%)
Place of birth for the foreign-born population - North Macedonia (Macedonia) (%)
Place of birth for the foreign-born population - Moldova (%)
Place of birth for the foreign-born population - Poland (%)
Place of birth for the foreign-born population - Romania (%)
Place of birth for the foreign-born population - Russia (%)
Place of birth for the foreign-born population - Serbia (%)
Place of birth for the foreign-born population - Ukraine (%)
Place of birth for the foreign-born population - Other Eastern Europe (%)
Place of birth for the foreign-born population - China (%)
Place of birth for the foreign-born population - Hong Kong (%)
Place of birth for the foreign-born population - Taiwan (%)
Place of birth for the foreign-born population - Japan (%)
Place of birth for the foreign-born population - Korea (%)
Place of birth for the foreign-born population - Other Eastern Asia (%)
Place of birth for the foreign-born population - Afghanistan (%)
Place of birth for the foreign-born population - Bangladesh (%)
Place of birth for the foreign-born population - India (%)
Place of birth for the foreign-born population - Iran (%)
Place of birth for the foreign-born population - Kazakhstan (%)
Place of birth for the foreign-born population - Nepal (%)
Place of birth for the foreign-born population - Pakistan (%)
Place of birth for the foreign-born population - Sri Lanka (%)
Place of birth for the foreign-born population - Uzbekistan (%)
Place of birth for the foreign-born population - Other South Central Asia (%)
Place of birth for the foreign-born population - Burma (%)
Place of birth for the foreign-born population - Cambodia (%)
Place of birth for the foreign-born population - Indonesia (%)
Place of birth for the foreign-born population - Laos (%)
Place of birth for the foreign-born population - Malaysia (%)
Place of birth for the foreign-born population - Philippines (%)
Place of birth for the foreign-born population - Singapore (%)
Place of birth for the foreign-born population - Thailand (%)
Place of birth for the foreign-born population - Vietnam (%)
Place of birth for the foreign-born population - Other South Eastern Asia (%)
Place of birth for the foreign-born population - Armenia (%)
Place of birth for the foreign-born population - Iraq (%)
Place of birth for the foreign-born population - Israel (%)
Place of birth for the foreign-born population - Jordan (%)
Place of birth for the foreign-born population - Kuwait (%)
Place of birth for the foreign-born population - Lebanon (%)
Place of birth for the foreign-born population - Saudi Arabia (%)
Place of birth for the foreign-born population - Syria (%)
Place of birth for the foreign-born population - Turkey (%)
Place of birth for the foreign-born population - Yemen (%)
Place of birth for the foreign-born population - Other Western Asia (%)
Place of birth for the foreign-born population - Eritrea (%)
Place of birth for the foreign-born population - Ethiopia (%)
Place of birth for the foreign-born population - Kenya (%)
Place of birth for the foreign-born population - Somalia (%)
Place of birth for the foreign-born population - Uganda (%)
Place of birth for the foreign-born population - Zimbabwe (%)
Place of birth for the foreign-born population - Other Eastern Africa (%)
Place of birth for the foreign-born population - Cameroon (%)
Place of birth for the foreign-born population - Congo (%)
Place of birth for the foreign-born population - Democratic Republic of Congo (Zaire) (%)
Place of birth for the foreign-born population - Other Middle Africa (%)
Place of birth for the foreign-born population - Egypt (%)
Place of birth for the foreign-born population - Morocco (%)
Place of birth for the foreign-born population - Sudan (%)
Place of birth for the foreign-born population - Other Northern Africa (%)
Place of birth for the foreign-born population - South Africa (%)
Place of birth for the foreign-born population - Other Southern Africa (%)
Place of birth for the foreign-born population - Cabo Verde (%)
Place of birth for the foreign-born population - Ghana (%)
Place of birth for the foreign-born population - Liberia (%)
Place of birth for the foreign-born population - Nigeria (%)
Place of birth for the foreign-born population - Senegal (%)
Place of birth for the foreign-born population - Sierra Leone (%)
Place of birth for the foreign-born population - Other Western Africa (%)
Place of birth for the foreign-born population - Australia (%)
Place of birth for the foreign-born population - New Zealand (%)
Place of birth for the foreign-born population - Fiji (%)
Place of birth for the foreign-born population - Micronesia (%)
Place of birth for the foreign-born population - Bahamas (%)
Place of birth for the foreign-born population - Barbados (%)
Place of birth for the foreign-born population - Cuba (%)
Place of birth for the foreign-born population - Dominica (%)
Place of birth for the foreign-born population - Dominican Republic (%)
Place of birth for the foreign-born population - Grenada (%)
Place of birth for the foreign-born population - Haiti (%)
Place of birth for the foreign-born population - Jamaica (%)
Place of birth for the foreign-born population - St. Vincent and the Grenadines (%)
Place of birth for the foreign-born population - Trinidad and Tobago (%)
Place of birth for the foreign-born population - West Indies (%)
Place of birth for the foreign-born population - Other Caribbean (%)
Place of birth for the foreign-born population - Belize (%)
Place of birth for the foreign-born population - Costa Rica (%)
Place of birth for the foreign-born population - El Salvador (%)
Place of birth for the foreign-born population - Guatemala (%)
Place of birth for the foreign-born population - Honduras (%)
Place of birth for the foreign-born population - Mexico (%)
Place of birth for the foreign-born population - Nicaragua (%)
Place of birth for the foreign-born population - Panama (%)
Place of birth for the foreign-born population - Other Central America (%)
Place of birth for the foreign-born population - Argentina (%)
Place of birth for the foreign-born population - Bolivia (%)
Place of birth for the foreign-born population - Brazil (%)
Place of birth for the foreign-born population - Chile (%)
Place of birth for the foreign-born population - Colombia (%)
Place of birth for the foreign-born population - Ecuador (%)
Place of birth for the foreign-born population - Guyana (%)
Place of birth for the foreign-born population - Peru (%)
Place of birth for the foreign-born population - Uruguay (%)
Place of birth for the foreign-born population - Venezuela (%)
Place of birth for the foreign-born population - Other South America (%)
Place of birth for the foreign-born population - Canada (%)
Place of birth for the foreign-born population - Other Northern America (%)
Place of birth for the foreign-born population - Other (%)
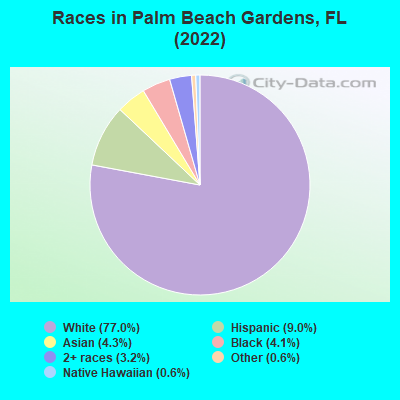
According to 2022 data, the most numerous races in Palm Beach Gardens, FL are White alone (46,206 residents), Hispanic (5,426 residents), and Black alone (2,471 residents). 84.1% of Palm Beach Gardens residents speak English at home. 13.8% of Palm Beach Gardens, FL residents are foreign-born (4.6% born in Latin America, 3.6% born in Europe, 3.1% born in Asia), which is 52.2% less than the foreign-born rate of 21.0% across the entire state of Florida.
Race distribution in Palm Beach Gardens
2000 2022
10,458,509 65.4% White alone 2,682,715 16.8% Hispanic 2,264,268 14.2% Black alone 261,693 1.6% Asian alone 236,954 1.5% Two or more races 42,358 0.3% American Indian alone 28,994 0.2% Other race alone 6,887 0.04% Native Hawaiian and Other
11,309,403 50.8% White alone 6,025,039 27.1% Hispanic 3,241,015 14.6% Black alone 861,630 3.9% Two or more races 623,692 2.8% Asian alone 152,054 0.7% Other race alone 22,504 0.1% American Indian alone 9,486 0.04% Native Hawaiian and Other
Income and house value in Palm Beach Gardens Median household income in 2022 $102,450 White non-Hispanic householders$110,672 Black householders$142,845 Asian householders$110,253 Some other race householders$168,790 Two or more races householders$117,993 Hispanic or Latino race householdersMedian 2022 house value $690,081 White Non-Hispanic householders$445,150 Black or African American householders $628,354 Asian householders$312,198 Some other race householders$54,605 Two or more races householders$445,150 Hispanic or Latino householders
Median age by race in Palm Beach Gardens
58.5 Median age for White residents56.5 60.0 35.1 Median age for Black or African American residents34.7 34.0 -724,168,912.1 Median age for American Indian / Alaska Native residents-806,112,702.2 -660,098,521.5 37.6 Median age for Asian residents39.6 37.2 15.6 Median age for Native Hawaiian / Pacific Islander residents13.6 16.0 38.1 Median age for Other race residents39.2 35.6 32.2 Median age for Two or more races residents32.0 32.0 56.7 Median age for White alone residents54.7 58.2 35.3 Median age for Hispanic or Latino residents37.0 33.8
Owner/renter occupied households by race in Palm Beach Gardens
House owners and renters - White residents 16,540 77.0% Owner occupied4,945 23.0% Renter occupiedHouse owners and renters - Black or African American residents 456 59.1% Owner occupied316 40.9% Renter occupiedHouse owners and renters - Asian residents 526 62.1% Owner occupied322 37.9% Renter occupiedHouse owners and renters - Native Hawaiian / Pacific Islander residents 97 100.0% Renter occupiedHouse owners and renters - Other race residents 331 88.8% Owner occupied42 11.2% Renter occupiedHouse owners and renters - Two or more races residents 1,120 70.4% Owner occupied471 29.6% Renter occupiedHouse owners and renters - White alone residents 16,877 76.1% Owner occupied5,286 23.9% Renter occupiedHouse owners and renters - Hispanic or Latino residents 1,167 64.2% Owner occupied651 35.8% Renter occupied
Language usage in Palm Beach Gardens
English speakers - Total 84.1% of residents of Palm Beach Gardens speak English at home.
5.4% of residents speak Spanish at home 2,194 70.3% Speak English very well929 29.7% Speak English less than very well9.9% of residents speak other language at home 4,589 80.4% Speak English very well1,120 19.6% Speak English less than very well
English speakers - Born in the United States 96.7% of residents of Palm Beach Gardens speak English at home.
1.4% of residents speak Spanish at home 397 86.9% Speak English very well60 13.1% Speak English less than very well2.1% of residents speak other language at home 655 93.0% Speak English very well49 7.0% Speak English less than very well
English speakers - Native, born elsewhere 33.7% of residents of Palm Beach Gardens speak English at home.
33.3% of residents speak Spanish at home 186 51.8% Speak English very well173 48.2% Speak English less than very well26.5% of residents speak other language at home 260 91.2% Speak English very well25 8.8% Speak English less than very well
English speakers - Foreign-born 31.2% of residents of Palm Beach Gardens speak English at home.
20.1% of residents speak Spanish at home 1,068 64.3% Speak English very well594 35.7% Speak English less than very well47.8% of residents speak other language at home 2,972 75.4% Speak English very well972 24.6% Speak English less than very well
White (Caucasian) - Speak only English Native:
99.1% (40,396)Foreign-born:
57.5% (1,432)
White (Caucasian) - Speak another language Native:
3.0% (1,225)Foreign-born:
53.2% (1,326)
Black or African American - Speak only English Native:
80.7% (1,525)Foreign-born:
33.9% (240)
Black or African American - Speak another language Native:
19.5% (368)Foreign-born:
65.9% (467)
Asian - Speak only English Native:
53.5% (346)Foreign-born:
23.3% (377)
Asian - Speak another language Native:
44.8% (289)Foreign-born:
76.7% (1,245)
Native Hawaiian / Pacific Islander - Speak another language Native:
46.6% (66)Foreign-born:
100.0% (49)
Other race - Speak only English Native:
61.1% (500)Foreign-born:
27.4% (182)
Other race - Speak another language Native:
40.5% (331)Foreign-born:
71.7% (477)
Two or more races - Speak only English Native:
82.4% (2,581)Foreign-born:
22.2% (334)
Two or more races - Speak another language Native:
14.9% (468)Foreign-born:
74.3% (1,115)
White alone - Speak only English Native:
97.1% (40,444)Foreign-born:
47.7% (1,483)
White alone - Speak another language Native:
3.0% (1,267)Foreign-born:
53.2% (1,653)
Hispanic or Latino - Speak only English Native:
63.5% (1,940)Foreign-born:
14.9% (287)
Hispanic or Latino - Speak another language Native:
37.4% (1,142)Foreign-born:
84.7% (1,636)
Foreign-born residents in Palm Beach Gardens 8,284 residents are foreign born (4.6% Latin America , 3.6% Europe , 3.1% Asia ).
This city:
13.8%Florida:
21.1%
Marital status for residents in Palm Beach Gardens Marital status - White (Caucasian) population 15 years and over
Males 23.9% Never married61.5% Now married0.6% Separated3.3% Widowed10.7% DivorcedFemales 19.8% Never married52.0% Now married0.5% Separated13.6% Widowed14.1% DivorcedWomen who gave birth in the past 12 months Now married:
92.2% (254)Unmarried:
7.8% (21)
Women who did not give birth in the past 12 months Now married:
41.4% (2,702)Unmarried:
58.6% (3,831)
Marital status - Black or African American population 15 years and over
Males 18.9% Never married64.6% Now married0.5% Separated4.8% Widowed11.2% DivorcedFemales 40.0% Never married42.8% Now married2.4% Separated2.5% Widowed12.2% DivorcedWomen who gave birth in the past 12 months Now married:
0.0% (0)Unmarried:
100.0% (3)
Women who did not give birth in the past 12 months Now married:
45.7% (371)Unmarried:
54.3% (441)
Marital status - Asian population 15 years and over
Males 24.0% Never married68.4% Now married0.0% Separated7.6% Widowed0.0% DivorcedFemales 24.8% Never married61.8% Now married0.0% Separated3.1% Widowed10.3% DivorcedWomen who gave birth in the past 12 months Now married:
100.0% (100)Unmarried:
0.0% (0)
Women who did not give birth in the past 12 months Now married:
49.2% (291)Unmarried:
50.8% (300)
Marital status - Native Hawaiian / Pacific Islander population 15 years and over
Males 0.0% Never married100.0% Now married0.0% Separated0.0% Widowed0.0% DivorcedFemales 49.5% Never married50.5% Now married0.0% Separated0.0% Widowed0.0% DivorcedWomen who did not give birth in the past 12 months Now married:
0.0% (0)Unmarried:
100.0% (34)
Marital status - Other race population 15 years and over
Males 31.6% Never married61.5% Now married0.0% Separated0.0% Widowed6.9% DivorcedFemales 22.1% Never married52.9% Now married4.5% Separated7.6% Widowed13.0% DivorcedWomen who gave birth in the past 12 months Now married:
100.0% (48)Unmarried:
0.0% (0)
Women who did not give birth in the past 12 months Now married:
60.1% (308)Unmarried:
39.9% (205)
Marital status - Two or more races population 15 years and over
Males 35.6% Never married54.1% Now married0.0% Separated2.0% Widowed8.3% DivorcedFemales 31.4% Never married56.7% Now married0.0% Separated1.0% Widowed10.8% DivorcedWomen who gave birth in the past 12 months Now married:
50.6% (57)Unmarried:
49.4% (56)
Women who did not give birth in the past 12 months Now married:
59.4% (738)Unmarried:
40.6% (504)
Marital status - White alone, not Hispanic / Latino population 15 years and over
Males 23.6% Never married61.7% Now married0.6% Separated3.4% Widowed10.7% DivorcedFemales 19.1% Never married52.3% Now married0.5% Separated14.0% Widowed14.1% DivorcedWomen who gave birth in the past 12 months Now married:
93.2% (291)Unmarried:
6.8% (21)
Women who did not give birth in the past 12 months Now married:
41.8% (2,925)Unmarried:
58.2% (4,070)
Marital status - Hispanic or Latino population 15 years and over
Males 31.6% Never married56.9% Now married0.0% Separated1.3% Widowed10.3% DivorcedFemales 34.2% Never married48.9% Now married1.3% Separated4.4% Widowed11.2% DivorcedWomen who gave birth in the past 12 months Now married:
62.8% (78)Unmarried:
37.2% (46)
Women who did not give birth in the past 12 months Now married:
44.2% (666)Unmarried:
55.8% (840)
Ancestries in Palm Beach Gardens
2,741 9.5% American2,723 9.4% Irish2,539 8.8% Italian2,094 7.2% German1,928 6.7% English1,175 4.1% Russian1,093 3.8% Polish732 2.5% Eastern European586 2.0% European542 1.9% Haitian506 1.7% Austrian384 1.3% Norwegian335 1.2% French276 1.0% Scottish250 0.9% French Canadian184 0.6% Hungarian167 0.6% Jamaican164 0.6% Scotch-Irish163 0.6% Bulgarian154 0.5% Ukrainian138 0.5% Greek136 0.5% Canadian120 0.4% British117 0.4% Lebanese105 0.4% Swiss99 0.3% Danish94 0.3% African91 0.3% Lithuanian81 0.3% Romanian78 0.3% Egyptian76 0.3% Dutch69 0.2% Swedish64 0.2% Pennsylvania German61 0.2% Scandinavian56 0.2% Armenian41 0.1% Portuguese35 0.1% Brazilian33 0.1% Nigerian31 0.1% Welsh30 0.1% Ghanaian29 0.1% Celtic29 0.1% Albanian27 0.09% Israeli17 0.06% South African16 0.06% Belgian16 0.06% Iraqi15 0.05% Jordanian14 0.05% Slovene14 0.05% Basque14 0.05% Trinidadian and Tobagonian13 0.04% Finnish13 0.04% Croatian12 0.04% Slovak10 0.03% Yugoslavian7 0.02% Turkish6 0.02% Northern European6 0.02% Belizean3 0.01% Bahamian
Geographical mobility in Palm Beach Gardens Same house 1 year ago 39,134 90.7% White (Caucasian)2,372 88.6% Black or African American1,822 72.9% Asian211 99.6% Native Hawaiian / Pacific Islander1,374 87.8% Other race4,639 88.7% Two or more races41,482 90.2% White alone, not Hispanic / Latino4,583 86.5% Hispanic or LatinoMoved within same county 1,761 4.1% White / Caucasian57 2.1% Black or African American210 8.4% Asian115 7.4% Other race261 5.0% Two or more races1,991 4.3% White alone, not Hispanic / Latino388 7.3% Hispanic or LatinoMoved within same state 665 1.5% White / Caucasian59 2.2% Black or African American125 5.0% Asian4 0.1% Two or more races770 1.7% White alone, not Hispanic / Latino50 0.9% Hispanic or LatinoMoved from different state 1,626 3.8% White / Caucasian123 4.6% Black or African American306 12.2% Asian318 6.1% Two or more races1,653 3.6% White alone, not Hispanic / Latino267 5.0% Hispanic or LatinoMoved from abroad 133 0.3% White25 1.0% Black or African American85 3.4% Asian21 10.1% Native Hawaiian / Pacific Islander84 5.4% Other race24 0.5% Two or more races166 0.4% White alone, not Hispanic / Latino38 0.7% Hispanic or Latino
Children Nativity (place of birth) in Palm Beach Gardens
Children under 6 years - Living with two parents Both parents native 1,811 100.0% Native0 0.0% Foreign-bornBoth parents foreign-born 307 94.8% Native17 5.2% Foreign-bornOne native, one foreign-born parent 360 100.0% NativeChildren under 6 years - Living with one parent Native parent 274 100.0% NativeForeign-born parent 204 100.0% NativeChildren 6 to 17 years - Living with two parents Both parents native 3,160 99.4% Native19 0.6% Foreign-bornBoth parents foreign-born 935 82.8% Native194 17.2% Foreign-bornOne native, one foreign-born parent 897 98.9% Native10 1.1% Foreign-bornChildren 6 to 17 years - Living with one parent Native parent 1,495 100.0% NativeForeign-born parent 340 52.3% Native310 47.7% Foreign-born
Grandparents responsible for own grandchildren in Palm Beach Gardens
Grandparents (30 to 59 years) Black or African American 4 100.0% Responsible for grandchildrenAsian 40 100.0% Not responsible for grandchildren
Grandparents (60 years and over) Asian 83 100.0% Not responsible for grandchildren