Races in Palisades Park, New Jersey (NJ) Detailed Stats
Data:
Races - White alone (%)
Races - White alone (% change since 2000)
Races - Black alone (%)
Races - Black alone (% change since 2000)
Races - American Indian alone (%)
Races - American Indian alone (% change since 2000)
Races - Asian alone (%)
Races - Asian alone (% change since 2000)
Races - Hispanic (%)
Races - Hispanic (% change since 2000)
Races - Native Hawaiian and Other Pacific Islander alone (%)
Races - Native Hawaiian and Other Pacific Islander alone (% change since 2000)
Races - Two or more races(%)
Races - Two or more races(% change since 2000)
Races - Other race alone (%)
Races - Other race alone (% change since 2000)
Racial diversity
Place of birth - Born in state of residence (%)
Place of birth - Born in state of residence (%) - White
Place of birth - Born in state of residence (%) - Black or African American
Place of birth - Born in state of residence (%) - Asian
Place of birth - Born in state of residence (%) - Hispanic or Latino
Place of birth - Born in state of residence (%) - American Indian and Alaska Native
Place of birth - Born in state of residence (%) - Multirace
Place of birth - Born in state of residence (%) - Other Race
Place of birth - Born in other state (%)
Place of birth - Born in other state (%) - White
Place of birth - Born in other state (%) - Black or African American
Place of birth - Born in other state (%) - Asian
Place of birth - Born in other state (%) - Hispanic or Latino
Place of birth - Born in other state (%) - American Indian and Alaska Native
Place of birth - Born in other state (%) - Multirace
Place of birth - Born in other state (%) - Other Race
Place of birth - Native, outside of US (%)
Place of birth - Native, outside of US (%) - White
Place of birth - Native, outside of US (%) - Black or African American
Place of birth - Native, outside of US (%) - Asian
Place of birth - Native, outside of US (%) - Hispanic or Latino
Place of birth - Native, outside of US (%) - American Indian and Alaska Native
Place of birth - Native, outside of US (%) - Multirace
Place of birth - Native, outside of US (%) - Other Race
Place of birth - Foreign born (%)
Place of birth - Foreign born (%) - White
Place of birth - Foreign born (%) - Black or African American
Place of birth - Foreign born (%) - Asian
Place of birth - Foreign born (%) - Hispanic or Latino
Place of birth - Foreign born (%) - American Indian and Alaska Native
Place of birth - Foreign born (%) - Multirace
Place of birth - Foreign born (%) - Other Race
Residents speaking English at home (%)
Residents speaking English at home - Born in the United States (%)
Residents speaking English at home - Native, born elsewhere (%)
Residents speaking English at home - Foreign born (%)
Residents speaking Spanish at home (%)
Residents speaking Spanish at home - Born in the United States (%)
Residents speaking Spanish at home - Native, born elsewhere (%)
Residents speaking Spanish at home - Foreign born (%)
Residents speaking other language at home (%)
Residents speaking other language at home - Born in the United States (%)
Residents speaking other language at home - Native, born elsewhere (%)
Residents speaking other language at home - Foreign born (%)
Marital status - Never married (%)
Marital status - Now married (%)
Marital status - Separated (%)
Marital status - Widowed (%)
Marital status - Divorced (%)
Ancestries Reported - Arab (%)
Ancestries Reported - Czech (%)
Ancestries Reported - Danish (%)
Ancestries Reported - Dutch (%)
Ancestries Reported - English (%)
Ancestries Reported - French (%)
Ancestries Reported - French Canadian (%)
Ancestries Reported - German (%)
Ancestries Reported - Greek (%)
Ancestries Reported - Hungarian (%)
Ancestries Reported - Irish (%)
Ancestries Reported - Italian (%)
Ancestries Reported - Lithuanian (%)
Ancestries Reported - Norwegian (%)
Ancestries Reported - Polish (%)
Ancestries Reported - Portuguese (%)
Ancestries Reported - Russian (%)
Ancestries Reported - Scotch-Irish (%)
Ancestries Reported - Scottish (%)
Ancestries Reported - Slovak (%)
Ancestries Reported - Subsaharan African (%)
Ancestries Reported - Swedish (%)
Ancestries Reported - Swiss (%)
Ancestries Reported - Ukrainian (%)
Ancestries Reported - United States (%)
Ancestries Reported - Welsh (%)
Ancestries Reported - West Indian (%)
Ancestries Reported - Other (%)
Geographical mobility - Same house 1 year ago (%)
Geographical mobility - Same house 1 year ago (%) - White
Geographical mobility - Same house 1 year ago (%) - Black or African American
Geographical mobility - Same house 1 year ago (%) - Asian
Geographical mobility - Same house 1 year ago (%) - Hispanic or Latino
Geographical mobility - Same house 1 year ago (%) - American Indian and Alaska Native
Geographical mobility - Same house 1 year ago (%) - Multirace
Geographical mobility - Same house 1 year ago (%) - Other Race
Geographical mobility - Moved within same county (%)
Geographical mobility - Moved within same county (%) - White
Geographical mobility - Moved within same county (%) - Black or African American
Geographical mobility - Moved within same county (%) - Asian
Geographical mobility - Moved within same county (%) - Hispanic or Latino
Geographical mobility - Moved within same county (%) - American Indian and Alaska Native
Geographical mobility - Moved within same county (%) - Multirace
Geographical mobility - Moved within same county (%) - Other Race
Geographical mobility - Moved from different county within same state (%)
Geographical mobility - Moved from different county within same state (%) - White
Geographical mobility - Moved from different county within same state (%) - Black or African American
Geographical mobility - Moved from different county within same state (%) - Asian
Geographical mobility - Moved from different county within same state (%) - Hispanic or Latino
Geographical mobility - Moved from different county within same state (%) - American Indian and Alaska Native
Geographical mobility - Moved from different county within same state (%) - Multirace
Geographical mobility - Moved from different county within same state (%) - Other Race
Geographical mobility - Moved from different state (%)
Geographical mobility - Moved from different state (%) - White
Geographical mobility - Moved from different state (%) - Black or African American
Geographical mobility - Moved from different state (%) - Asian
Geographical mobility - Moved from different state (%) - Hispanic or Latino
Geographical mobility - Moved from different state (%) - American Indian and Alaska Native
Geographical mobility - Moved from different state (%) - Multirace
Geographical mobility - Moved from different state (%) - Other Race
Geographical mobility - Moved from abroad (%)
Geographical mobility - Moved from abroad (%) - White
Geographical mobility - Moved from abroad (%) - Black or African American
Geographical mobility - Moved from abroad (%) - Asian
Geographical mobility - Moved from abroad (%) - Hispanic or Latino
Geographical mobility - Moved from abroad (%) - American Indian and Alaska Native
Geographical mobility - Moved from abroad (%) - Multirace
Geographical mobility - Moved from abroad (%) - Other Race
Place of birth for the foreign-born population - Ireland (%)
Place of birth for the foreign-born population - Denmark (%)
Place of birth for the foreign-born population - Norway (%)
Place of birth for the foreign-born population - Sweden (%)
Place of birth for the foreign-born population - United Kingdom (%)
Place of birth for the foreign-born population - England (%)
Place of birth for the foreign-born population - Scotland (%)
Place of birth for the foreign-born population - Other Northern Europe (%)
Place of birth for the foreign-born population - Austria (%)
Place of birth for the foreign-born population - Belgium (%)
Place of birth for the foreign-born population - France (%)
Place of birth for the foreign-born population - Germany (%)
Place of birth for the foreign-born population - Netherlands (%)
Place of birth for the foreign-born population - Switzerland (%)
Place of birth for the foreign-born population - Other Western Europe (%)
Place of birth for the foreign-born population - Greece (%)
Place of birth for the foreign-born population - Italy (%)
Place of birth for the foreign-born population - Portugal (%)
Place of birth for the foreign-born population - Spain (%)
Place of birth for the foreign-born population - Other Southern Europe (%)
Place of birth for the foreign-born population - Albania (%)
Place of birth for the foreign-born population - Belarus (%)
Place of birth for the foreign-born population - Bosnia and Herzegovina (%)
Place of birth for the foreign-born population - Bulgaria (%)
Place of birth for the foreign-born population - Croatia (%)
Place of birth for the foreign-born population - Czechoslovakia (%)
Place of birth for the foreign-born population - Hungary (%)
Place of birth for the foreign-born population - Latvia (%)
Place of birth for the foreign-born population - Lithuania (%)
Place of birth for the foreign-born population - North Macedonia (Macedonia) (%)
Place of birth for the foreign-born population - Moldova (%)
Place of birth for the foreign-born population - Poland (%)
Place of birth for the foreign-born population - Romania (%)
Place of birth for the foreign-born population - Russia (%)
Place of birth for the foreign-born population - Serbia (%)
Place of birth for the foreign-born population - Ukraine (%)
Place of birth for the foreign-born population - Other Eastern Europe (%)
Place of birth for the foreign-born population - China (%)
Place of birth for the foreign-born population - Hong Kong (%)
Place of birth for the foreign-born population - Taiwan (%)
Place of birth for the foreign-born population - Japan (%)
Place of birth for the foreign-born population - Korea (%)
Place of birth for the foreign-born population - Other Eastern Asia (%)
Place of birth for the foreign-born population - Afghanistan (%)
Place of birth for the foreign-born population - Bangladesh (%)
Place of birth for the foreign-born population - India (%)
Place of birth for the foreign-born population - Iran (%)
Place of birth for the foreign-born population - Kazakhstan (%)
Place of birth for the foreign-born population - Nepal (%)
Place of birth for the foreign-born population - Pakistan (%)
Place of birth for the foreign-born population - Sri Lanka (%)
Place of birth for the foreign-born population - Uzbekistan (%)
Place of birth for the foreign-born population - Other South Central Asia (%)
Place of birth for the foreign-born population - Burma (%)
Place of birth for the foreign-born population - Cambodia (%)
Place of birth for the foreign-born population - Indonesia (%)
Place of birth for the foreign-born population - Laos (%)
Place of birth for the foreign-born population - Malaysia (%)
Place of birth for the foreign-born population - Philippines (%)
Place of birth for the foreign-born population - Singapore (%)
Place of birth for the foreign-born population - Thailand (%)
Place of birth for the foreign-born population - Vietnam (%)
Place of birth for the foreign-born population - Other South Eastern Asia (%)
Place of birth for the foreign-born population - Armenia (%)
Place of birth for the foreign-born population - Iraq (%)
Place of birth for the foreign-born population - Israel (%)
Place of birth for the foreign-born population - Jordan (%)
Place of birth for the foreign-born population - Kuwait (%)
Place of birth for the foreign-born population - Lebanon (%)
Place of birth for the foreign-born population - Saudi Arabia (%)
Place of birth for the foreign-born population - Syria (%)
Place of birth for the foreign-born population - Turkey (%)
Place of birth for the foreign-born population - Yemen (%)
Place of birth for the foreign-born population - Other Western Asia (%)
Place of birth for the foreign-born population - Eritrea (%)
Place of birth for the foreign-born population - Ethiopia (%)
Place of birth for the foreign-born population - Kenya (%)
Place of birth for the foreign-born population - Somalia (%)
Place of birth for the foreign-born population - Uganda (%)
Place of birth for the foreign-born population - Zimbabwe (%)
Place of birth for the foreign-born population - Other Eastern Africa (%)
Place of birth for the foreign-born population - Cameroon (%)
Place of birth for the foreign-born population - Congo (%)
Place of birth for the foreign-born population - Democratic Republic of Congo (Zaire) (%)
Place of birth for the foreign-born population - Other Middle Africa (%)
Place of birth for the foreign-born population - Egypt (%)
Place of birth for the foreign-born population - Morocco (%)
Place of birth for the foreign-born population - Sudan (%)
Place of birth for the foreign-born population - Other Northern Africa (%)
Place of birth for the foreign-born population - South Africa (%)
Place of birth for the foreign-born population - Other Southern Africa (%)
Place of birth for the foreign-born population - Cabo Verde (%)
Place of birth for the foreign-born population - Ghana (%)
Place of birth for the foreign-born population - Liberia (%)
Place of birth for the foreign-born population - Nigeria (%)
Place of birth for the foreign-born population - Senegal (%)
Place of birth for the foreign-born population - Sierra Leone (%)
Place of birth for the foreign-born population - Other Western Africa (%)
Place of birth for the foreign-born population - Australia (%)
Place of birth for the foreign-born population - New Zealand (%)
Place of birth for the foreign-born population - Fiji (%)
Place of birth for the foreign-born population - Micronesia (%)
Place of birth for the foreign-born population - Bahamas (%)
Place of birth for the foreign-born population - Barbados (%)
Place of birth for the foreign-born population - Cuba (%)
Place of birth for the foreign-born population - Dominica (%)
Place of birth for the foreign-born population - Dominican Republic (%)
Place of birth for the foreign-born population - Grenada (%)
Place of birth for the foreign-born population - Haiti (%)
Place of birth for the foreign-born population - Jamaica (%)
Place of birth for the foreign-born population - St. Vincent and the Grenadines (%)
Place of birth for the foreign-born population - Trinidad and Tobago (%)
Place of birth for the foreign-born population - West Indies (%)
Place of birth for the foreign-born population - Other Caribbean (%)
Place of birth for the foreign-born population - Belize (%)
Place of birth for the foreign-born population - Costa Rica (%)
Place of birth for the foreign-born population - El Salvador (%)
Place of birth for the foreign-born population - Guatemala (%)
Place of birth for the foreign-born population - Honduras (%)
Place of birth for the foreign-born population - Mexico (%)
Place of birth for the foreign-born population - Nicaragua (%)
Place of birth for the foreign-born population - Panama (%)
Place of birth for the foreign-born population - Other Central America (%)
Place of birth for the foreign-born population - Argentina (%)
Place of birth for the foreign-born population - Bolivia (%)
Place of birth for the foreign-born population - Brazil (%)
Place of birth for the foreign-born population - Chile (%)
Place of birth for the foreign-born population - Colombia (%)
Place of birth for the foreign-born population - Ecuador (%)
Place of birth for the foreign-born population - Guyana (%)
Place of birth for the foreign-born population - Peru (%)
Place of birth for the foreign-born population - Uruguay (%)
Place of birth for the foreign-born population - Venezuela (%)
Place of birth for the foreign-born population - Other South America (%)
Place of birth for the foreign-born population - Canada (%)
Place of birth for the foreign-born population - Other Northern America (%)
Place of birth for the foreign-born population - Other (%)
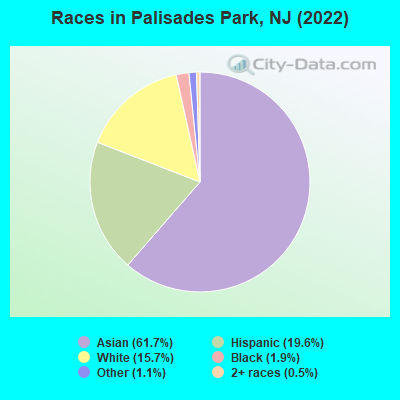
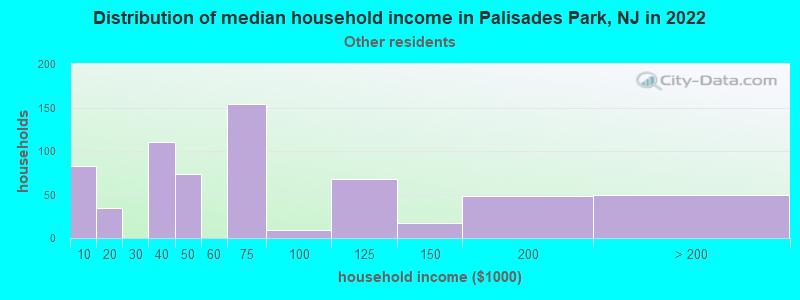
According to 2022 data, the most numerous races in Palisades Park, NJ are White alone (3,178 residents), Hispanic (3,968 residents), and Black alone (381 residents). 24.6% of Palisades Park residents speak English at home. 61.7% of Palisades Park, NJ residents are foreign-born (46.2% born in Asia, 10.9% born in Latin America), which is 62.7% greater than the foreign-born rate of 23.0% across the entire state of New Jersey.
Race distribution in Palisades Park
2000 2022
5,557,209 66.0% White alone 1,117,191 13.3% Hispanic 1,096,171 13.0% Black alone 477,012 5.7% Asian alone 133,689 1.6% Two or more races 19,565 0.2% Other race alone 11,338 0.1% American Indian alone 2,175 0.03% Native Hawaiian and Other
4,766,476 51.5% White alone 2,028,470 21.9% Hispanic 1,111,632 12.0% Black alone 923,546 10.0% Asian alone 332,237 3.6% Two or more races 89,847 1.0% Other race alone 8,557 0.09% American Indian alone 934 0.01% Native Hawaiian and Other
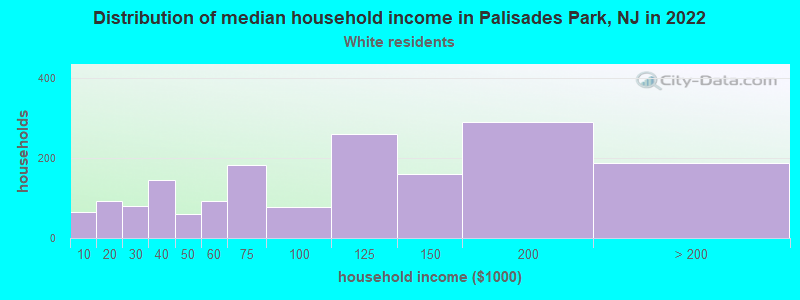
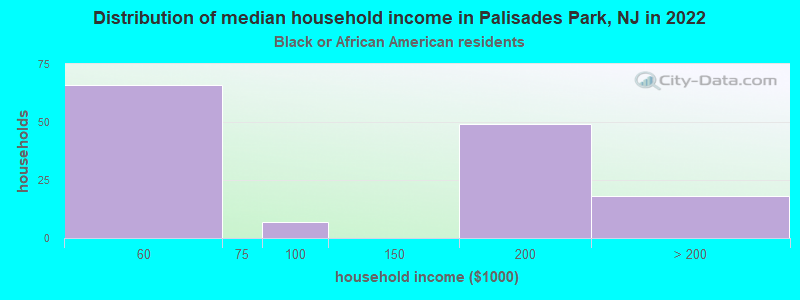
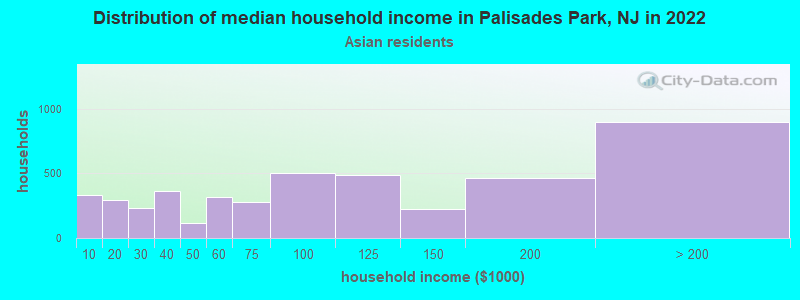
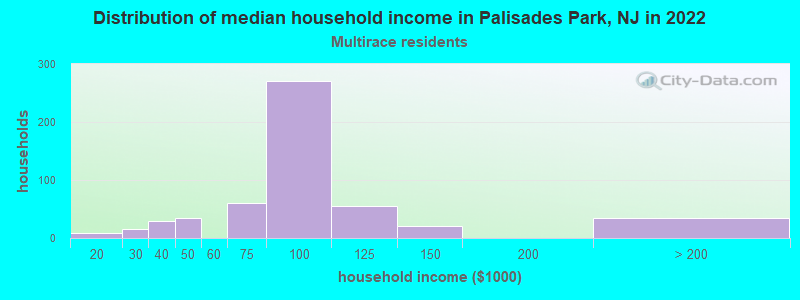
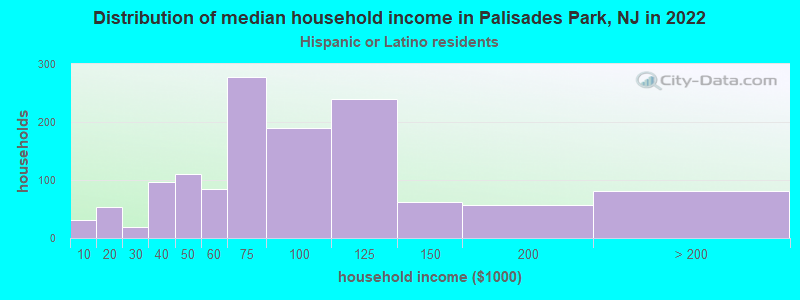
Income and house value in Palisades Park Median household income in 2022 $106,196 White non-Hispanic householders$90,583 Asian householders$65,075 Some other race householders$80,198 Two or more races householders$73,950 Hispanic or Latino race householdersMedian 2022 house value $625,463 White Non-Hispanic householders$770,274 Black or African American householders $716,775 Asian householders$640,308 Some other race householders$762,152 Two or more races householders$698,849 Hispanic or Latino householders
Median age by race in Palisades Park
40.7 Median age for White residents39.4 42.8 35.0 Median age for Black or African American residents39.0 22.8 -766,197,182.3 Median age for American Indian / Alaska Native residents-686,322,685.6 -753,722,794.2 45.5 Median age for Asian residents46.2 45.8 -510,460,250.5 Median age for Native Hawaiian / Pacific Islander residents-514,767,932.0 -713,070,378.3 34.3 Median age for Other race residents37.6 33.9 49.5 Median age for Two or more races residents50.9 43.4 45.8 Median age for White alone residents49.8 45.5 36.1 Median age for Hispanic or Latino residents36.5 34.9
Owner/renter occupied households by race in Palisades Park
House owners and renters - White residents 837 51.7% Owner occupied781 48.3% Renter occupiedHouse owners and renters - Black or African American residents 18 15.7% Owner occupied97 84.3% Renter occupiedHouse owners and renters - American Indian / Alaska Native residents 9 100.0% Owner occupiedHouse owners and renters - Asian residents 1,644 36.8% Owner occupied2,818 63.2% Renter occupiedHouse owners and renters - Native Hawaiian / Pacific Islander residents 1 100.0% Renter occupiedHouse owners and renters - Other race residents 60 9.1% Owner occupied596 90.9% Renter occupiedHouse owners and renters - Two or more races residents 125 22.3% Owner occupied435 77.7% Renter occupiedHouse owners and renters - White alone residents 721 55.8% Owner occupied570 44.2% Renter occupiedHouse owners and renters - Hispanic or Latino residents 272 21.7% Owner occupied986 78.3% Renter occupied
Language usage in Palisades Park
English speakers - Total 24.6% of residents of Palisades Park speak English at home.
17.0% of residents speak Spanish at home 1,552 47.6% Speak English very well1,711 52.4% Speak English less than very well60.0% of residents speak other language at home 4,705 40.7% Speak English very well6,842 59.3% Speak English less than very well
English speakers - Born in the United States 40.3% of residents of Palisades Park speak English at home.
21.9% of residents speak Spanish at home 575 91.6% Speak English very well53 8.4% Speak English less than very well41.9% of residents speak other language at home 1,152 95.8% Speak English very well50 4.2% Speak English less than very well
English speakers - Native, born elsewhere 7.5% of residents of Palisades Park speak English at home.
66.3% of residents speak Spanish at home 81 43.8% Speak English very well104 56.2% Speak English less than very well41.6% of residents speak other language at home 29 25.0% Speak English very well87 75.0% Speak English less than very well
English speakers - Foreign-born 11.4% of residents of Palisades Park speak English at home.
16.4% of residents speak Spanish at home 597 29.3% Speak English very well1,444 70.7% Speak English less than very well72.4% of residents speak other language at home 2,578 28.7% Speak English very well6,411 71.3% Speak English less than very well
White (Caucasian) - Speak only English Native:
67.4% (1,932)Foreign-born:
16.2% (183)
White (Caucasian) - Speak another language Native:
27.1% (776)Foreign-born:
82.5% (932)
Black or African American - Speak only English Native:
83.3% (312)Foreign-born:
50.9% (35)
Black or African American - Speak another language Native:
16.8% (63)Foreign-born:
46.1% (31)
Asian - Speak only English Native:
32.3% (878)Foreign-born:
10.7% (995)
Asian - Speak another language Native:
67.0% (1,823)Foreign-born:
89.3% (8,288)
Other race - Speak only English Native:
18.6% (157)Foreign-born:
13.9% (144)
Other race - Speak another language Native:
83.3% (701)Foreign-born:
80.2% (830)
Two or more races - Speak only English Native:
15.9% (58)Foreign-born:
4.3% (47)
Two or more races - Speak another language Native:
89.5% (327)Foreign-born:
96.9% (1,063)
White alone - Speak only English Native:
76.1% (1,775)Foreign-born:
17.4% (134)
White alone - Speak another language Native:
23.0% (536)Foreign-born:
82.7% (635)
Hispanic or Latino - Speak only English Native:
24.9% (402)Foreign-born:
13.4% (283)
Hispanic or Latino - Speak another language Native:
77.9% (1,256)Foreign-born:
87.3% (1,848)
Foreign-born residents in Palisades Park 12,482 residents are foreign born (46.2% Asia , 10.9% Latin America ).
This city:
61.7%New Jersey:
23.2%
Marital status for residents in Palisades Park Marital status - White (Caucasian) population 15 years and over
Males 41.9% Never married50.0% Now married1.6% Separated3.8% Widowed2.7% DivorcedFemales 36.4% Never married33.4% Now married0.5% Separated14.7% Widowed15.0% DivorcedWomen who gave birth in the past 12 months Now married:
100.0% (23)Unmarried:
0.0% (0)
Women who did not give birth in the past 12 months Now married:
17.3% (182)Unmarried:
82.7% (870)
Marital status - Black or African American population 15 years and over
Males 60.9% Never married34.7% Now married0.0% Separated0.0% Widowed4.5% DivorcedFemales 90.5% Never married9.5% Now married0.0% Separated0.0% Widowed0.0% DivorcedWomen who did not give birth in the past 12 months Now married:
14.9% (21)Unmarried:
85.1% (117)
Marital status - American Indian / Alaska Native population 15 years and over
Males 0.0% Never married100.0% Now married0.0% Separated0.0% Widowed0.0% DivorcedFemales 0.0% Never married100.0% Now married0.0% Separated0.0% Widowed0.0% DivorcedMarital status - Asian population 15 years and over
Males 32.9% Never married55.1% Now married0.0% Separated5.7% Widowed6.3% DivorcedFemales 30.6% Never married47.7% Now married1.7% Separated9.3% Widowed10.7% DivorcedWomen who gave birth in the past 12 months Now married:
100.0% (138)Unmarried:
0.0% (0)
Women who did not give birth in the past 12 months Now married:
39.4% (1,319)Unmarried:
60.6% (2,029)
Marital status - Other race population 15 years and over
Males 28.7% Never married65.8% Now married3.6% Separated0.0% Widowed1.9% DivorcedFemales 40.2% Never married43.3% Now married1.4% Separated8.2% Widowed6.8% DivorcedWomen who gave birth in the past 12 months Now married:
58.3% (74)Unmarried:
41.7% (53)
Women who did not give birth in the past 12 months Now married:
40.4% (224)Unmarried:
59.6% (330)
Marital status - Two or more races population 15 years and over
Males 52.7% Never married43.3% Now married0.0% Separated1.7% Widowed2.3% DivorcedFemales 20.2% Never married35.4% Now married15.0% Separated10.3% Widowed19.1% DivorcedWomen who gave birth in the past 12 months Now married:
100.0% (4)Unmarried:
0.0% (0)
Women who did not give birth in the past 12 months Now married:
30.1% (90)Unmarried:
69.9% (210)
Marital status - White alone, not Hispanic / Latino population 15 years and over
Males 36.1% Never married51.8% Now married2.4% Separated5.7% Widowed4.1% DivorcedFemales 30.8% Never married36.4% Now married0.7% Separated21.6% Widowed10.5% DivorcedWomen who did not give birth in the past 12 months Now married:
20.3% (148)Unmarried:
79.7% (581)
Marital status - Hispanic or Latino population 15 years and over
Males 48.4% Never married48.7% Now married1.1% Separated0.5% Widowed1.3% DivorcedFemales 41.0% Never married33.3% Now married4.1% Separated5.1% Widowed16.5% DivorcedWomen who gave birth in the past 12 months Now married:
70.9% (76)Unmarried:
29.1% (31)
Women who did not give birth in the past 12 months Now married:
23.5% (251)Unmarried:
76.5% (816)
Ancestries in Palisades Park
304 2.2% Italian276 2.0% American142 1.0% Greek122 0.9% Armenian105 0.8% Jordanian70 0.5% Syrian57 0.4% Polish55 0.4% Jamaican38 0.3% Czechoslovakian35 0.3% Macedonian34 0.2% Albanian33 0.2% Croatian28 0.2% Irish26 0.2% Lebanese26 0.2% Romanian24 0.2% Guyanese24 0.2% Serbian21 0.2% German19 0.1% Turkish15 0.1% Nigerian15 0.1% Trinidadian and Tobagonian9 0.07% Russian9 0.07% Haitian6 0.04% Ukrainian6 0.04% West Indian5 0.04% English3 0.02% Cypriot
Geographical mobility in Palisades Park Same house 1 year ago 3,718 89.1% White (Caucasian)453 100.0% Black or African American9 44.6% American Indian / Alaska Native10,821 86.5% Asian1,731 85.3% Other race943 68.3% Two or more races2,838 89.5% White alone, not Hispanic / Latino3,117 80.8% Hispanic or LatinoMoved within same county 147 3.5% White / Caucasian15 77.8% American Indian / Alaska Native1,212 9.7% Asian1 94.6% Native Hawaiian / Pacific Islander297 14.7% Other race426 30.9% Two or more races71 2.2% White alone, not Hispanic / Latino707 18.3% Hispanic or LatinoMoved within same state 196 4.7% White / Caucasian1 0.3% Black or African American49 0.4% Asian180 5.7% White alone, not Hispanic / Latino94 2.4% Hispanic or LatinoMoved from different state 250 2.0% AsianMoved from abroad 64 1.5% White78 0.6% Asian56 1.8% White alone, not Hispanic / Latino34 0.9% Hispanic or Latino
Children Nativity (place of birth) in Palisades Park
Children under 6 years - Living with two parents Both parents native 244 100.0% NativeBoth parents foreign-born 345 95.9% Native15 4.1% Foreign-bornOne native, one foreign-born parent 212 100.0% NativeChildren under 6 years - Living with one parent Native parent 24 100.0% NativeForeign-born parent 206 87.1% Native31 12.9% Foreign-bornChildren 6 to 17 years - Living with two parents Both parents native 108 83.3% Native22 16.7% Foreign-bornBoth parents foreign-born 573 67.2% Native280 32.8% Foreign-bornOne native, one foreign-born parent 49 100.0% NativeChildren 6 to 17 years - Living with one parent Native parent 111 100.0% NativeForeign-born parent 372 51.9% Native344 48.1% Foreign-born
Grandparents responsible for own grandchildren in Palisades Park
Grandparents (30 to 59 years) White / Caucasian 6 100.0% Not responsible for grandchildrenAsian 9 100.0% Not responsible for grandchildrenWhite alone, not Hispanic / Latino 7 100.0% Not responsible for grandchildrenGrandparents (60 years and over) White / Caucasian 10 100.0% Responsible for grandchildrenAsian 23 18.1% Responsible for grandchildren105 81.9% Not responsible for grandchildrenWhite alone, not Hispanic / Latino 14 100.0% Responsible for grandchildren