Races in Oxford, North Carolina (NC) Detailed Stats
Ancestries, Foreign-born residents, place of birth
Settings
X


Recent posts about races in Oxford, North Carolina on our local forum with over 2,400,000 registered users:
 | East Raleigh Shooting Spree (315 replies) |
| Upscale Single story homes nestled among other mostly single story homes, ~3,000 sf up. Where? (199 replies) |
| Update on Oxford, NC please and other walkable towns (18 replies) |
| Reasonably priced suburbs of Raleigh/Durham? (23 replies) |
| What state is North Carolina's closest peer (193 replies) |
| Current Coronavirus Status (2075 replies) |
Latest news about races in Oxford, NC collected exclusively by city-data.com from local newspapers, TV, and radio stations
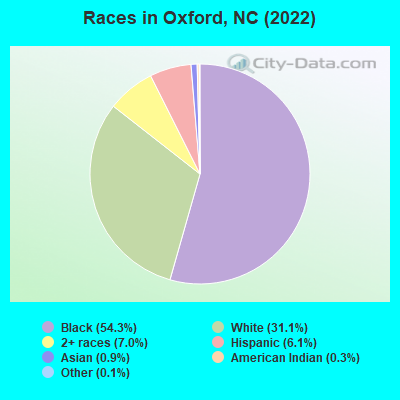
According to 2022 data, the most numerous races in Oxford, NC are White alone (2,757 residents), Black alone (4,819 residents), and Hispanic (544 residents). 92.4% of Oxford residents speak English at home. 5.3% of Oxford, NC residents are foreign-born (2.5% born in Latin America, 1.5% born in Asia, 0.8% born in Europe), which is 52.4% less than the foreign-born rate of 8.0% across the entire state of North Carolina.
Race distribution in Oxford
2000
2022

- 4,26951.2%Black alone
- 3,57942.9%White alone
- 3804.6%Hispanic
- 520.6%Two or more races
- 340.4%Asian alone
- 140.2%American Indian alone
- 50.06%Other race alone
- 50.06%Native Hawaiian and Other
Pacific Islander alone

-
- 4,81954.3%Black alone
- 2,75731.1%White alone
- 6257.0%Two or more races
- 5446.1%Hispanic
- 830.9%Asian alone
- 250.3%American Indian alone
- 90.1%Other race alone
2000
2022
-
- 5,647,15570.2%White alone
- 1,723,30121.4%Black alone
- 378,9634.7%Hispanic
- 112,4161.4%Asian alone
- 95,3331.2%American Indian alone
- 79,9651.0%Two or more races
- 9,0150.1%Other race alone
- 3,1650.04%Native Hawaiian and Other
Pacific Islander alone

-
- 6,497,51960.7%White alone
- 2,155,65020.1%Black alone
- 1,114,79910.4%Hispanic
- 438,0614.1%Two or more races
- 341,0523.2%Asian alone
- 91,7580.9%American Indian alone
- 50,1800.5%Other race alone
- 9,9540.09%Native Hawaiian and Other
Pacific Islander alone

Income and house value in Oxford
- Median household income in 2022
- $80,522White non-Hispanic householders
- $34,769Black householders
- $96,882Asian householders
- $59,279Some other race householders
- $59,387Hispanic or Latino race householders
- Median 2022 house value
- $236,135White Non-Hispanic householders
- $139,791Black or African American householders
- $78,711Native Hawaiian and other Pacific Islander householders
Household income for White non-Hispanic householders

Household income for Black householders

Household income for Asian householders

Household income for Some other race householders

Household income for Two or more races householders

Household income for Hispanic or Latino race householders

Median age by race in Oxford
- 52.4Median age for White residents
- 44.4Males
- 61.3Females
- 40.7Median age for Black or African American residents
- 38.1Males
- 42.3Females
- 37.5Median age for American Indian / Alaska Native residents
- -668,604,650.5Males
- -682,971,013.8Females
- 28.5Median age for Asian residents
- 28.5Males
- -689,075,629.6Females
- -609,884,331.7Median age for Native Hawaiian / Pacific Islander residents
- -611,708,482.1Males
- -612,403,100.2Females
- 33.5Median age for Other race residents
- 45.2Males
- 26.3Females
- 48.7Median age for Two or more races residents
- 49.7Males
- 18.0Females
- 51.5Median age for White alone residents
- 44.5Males
- 60.0Females
- 33.2Median age for Hispanic or Latino residents
- 40.3Males
- 33.3Females
Owner/renter occupied households by race in Oxford
- House owners and renters - White residents
- 80566.0%Owner occupied
- 41634.0%Renter occupied
- House owners and renters - Black or African American residents
- 84743.9%Owner occupied
- 1,08356.1%Renter occupied
- House owners and renters - American Indian / Alaska Native residents
- 12100.0%Renter occupied
- House owners and renters - Asian residents
- 45100.0%Owner occupied
- House owners and renters - Other race residents
- 8945.4%Owner occupied
- 10754.6%Renter occupied
- House owners and renters - Two or more races residents
- 12447.3%Owner occupied
- 13852.7%Renter occupied
- House owners and renters - White alone residents
- 79664.9%Owner occupied
- 43035.1%Renter occupied
- House owners and renters - Hispanic or Latino residents
- 8840.8%Owner occupied
- 12859.2%Renter occupied
Language usage in Oxford
- English speakers - Total
- 92.4% of residents of Oxford speak English at home.
- 4.2% of residents speak Spanish at home
- 21961.7%Speak English very well
- 13638.3%Speak English less than very well
- 3.2% of residents speak other language at home
- 16159.4%Speak English very well
- 11040.6%Speak English less than very well
- English speakers - Born in the United States
- 96.6% of residents of Oxford speak English at home.
- 1.5% of residents speak Spanish at home
- 23100.0%Speak English very well
- 1.9% of residents speak other language at home
- 1346.4%Speak English very well
- 1553.6%Speak English less than very well
- English speakers - Native, born elsewhere
- 54.5% of residents of Oxford speak English at home.
- 43.0% of residents speak Spanish at home
- 3873.1%Speak English very well
- 1426.9%Speak English less than very well
- English speakers - Foreign-born
- 4.1% of residents of Oxford speak English at home.
- 49.8% of residents speak Spanish at home
- 11147.8%Speak English very well
- 12152.2%Speak English less than very well
- 45.3% of residents speak other language at home
- 13463.5%Speak English very well
- 7736.5%Speak English less than very well
White (Caucasian) - Speak only English
| Native: | 98.6% (2,576) |
| Foreign-born: | 23.9% (18) |
White (Caucasian) - Speak another language
| Native: | 1.7% (44) |
| Foreign-born: | 69.5% (53) |
Black or African American - Speak another language
| Native: | 0.6% (26) |
| Foreign-born: | 99.2% (49) |
Other race - Speak another language
| Native: | 6.5% (4) |
| Foreign-born: | 100.0% (266) |
White alone - Speak only English
| Native: | 98.7% (2,568) |
| Foreign-born: | 18.6% (19) |
White alone - Speak another language
| Native: | 1.2% (32) |
| Foreign-born: | 81.4% (84) |
Hispanic or Latino - Speak another language
| Native: | 32.6% (86) |
| Foreign-born: | 99.8% (227) |
Foreign-born residents in Oxford
466 residents are foreign born (2.5% Latin America, 1.5% Asia, 0.8% Europe).
| This city: | 5.3% |
| North Carolina: | 8.3% |


Marital status for residents in Oxford
Marital status - White (Caucasian) population 15 years and over
- Males
- 31.6%Never married
- 50.5%Now married
- 0.5%Separated
- 7.7%Widowed
- 9.7%Divorced
- Females
- 13.1%Never married
- 47.6%Now married
- 3.6%Separated
- 18.2%Widowed
- 17.5%Divorced
Women who did not give birth in the past 12 months
| Now married: | 60.9% (277) |
| Unmarried: | 39.1% (177) |
Marital status - Black or African American population 15 years and over
- Males
- 39.0%Never married
- 36.8%Now married
- 3.0%Separated
- 2.9%Widowed
- 18.3%Divorced
- Females
- 41.4%Never married
- 22.0%Now married
- 4.8%Separated
- 12.9%Widowed
- 18.9%Divorced
Women who gave birth in the past 12 months
| Now married: | 0.0% (0) |
| Unmarried: | 100.0% (112) |
Women who did not give birth in the past 12 months
| Now married: | 19.7% (201) |
| Unmarried: | 80.3% (819) |
Marital status - American Indian / Alaska Native population 15 years and over
- Males
- 44.4%Never married
- 55.6%Now married
- 0.0%Separated
- 0.0%Widowed
- 0.0%Divorced
- Females
- 100.0%Never married
- 0.0%Now married
- 0.0%Separated
- 0.0%Widowed
- 0.0%Divorced
Marital status - Asian population 15 years and over
- Males
- 52.6%Never married
- 26.3%Now married
- 0.0%Separated
- 0.0%Widowed
- 21.1%Divorced
- Females
- 0.0%Never married
- 100.0%Now married
- 0.0%Separated
- 0.0%Widowed
- 0.0%Divorced
Women who did not give birth in the past 12 months
| Now married: | 100.0% (16) |
| Unmarried: | 0.0% (0) |
Marital status - Other race population 15 years and over
- Males
- 13.7%Never married
- 43.5%Now married
- 0.0%Separated
- 0.0%Widowed
- 42.7%Divorced
- Females
- 37.8%Never married
- 50.0%Now married
- 0.0%Separated
- 0.0%Widowed
- 12.2%Divorced
Women who did not give birth in the past 12 months
| Now married: | 35.8% (26) |
| Unmarried: | 64.2% (47) |
Marital status - Two or more races population 15 years and over
- Males
- 40.0%Never married
- 26.5%Now married
- 0.0%Separated
- 0.0%Widowed
- 33.5%Divorced
- Females
- 45.1%Never married
- 19.4%Now married
- 0.0%Separated
- 0.0%Widowed
- 35.4%Divorced
Women who did not give birth in the past 12 months
| Now married: | 32.0% (42) |
| Unmarried: | 68.0% (90) |
Marital status - White alone, not Hispanic / Latino population 15 years and over
- Males
- 31.0%Never married
- 51.5%Now married
- 0.0%Separated
- 7.5%Widowed
- 10.0%Divorced
- Females
- 13.3%Never married
- 48.5%Now married
- 3.7%Separated
- 16.8%Widowed
- 17.8%Divorced
Women who did not give birth in the past 12 months
| Now married: | 60.9% (286) |
| Unmarried: | 39.1% (184) |
Marital status - Hispanic or Latino population 15 years and over
- Males
- 26.5%Never married
- 39.3%Now married
- 3.1%Separated
- 2.6%Widowed
- 28.6%Divorced
- Females
- 39.4%Never married
- 41.7%Now married
- 0.0%Separated
- 12.8%Widowed
- 6.1%Divorced
Women who did not give birth in the past 12 months
| Now married: | 37.0% (37) |
| Unmarried: | 63.0% (63) |
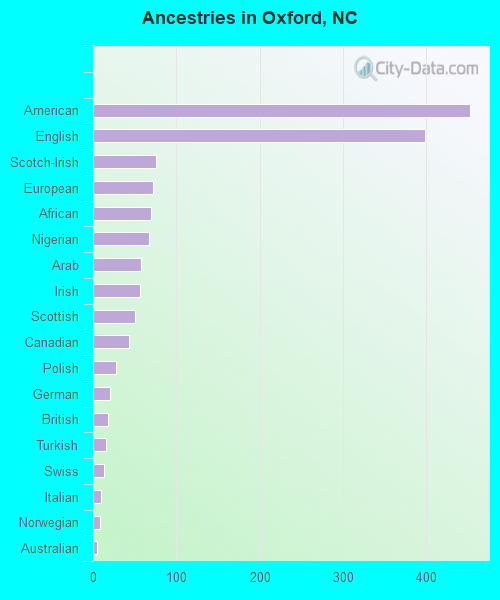
Ancestries in Oxford

- 4538.5%American
- 3997.5%English
- 761.4%Scotch-Irish
- 721.3%European
- 701.3%African
- 671.3%Nigerian
- 581.1%Arab
- 561.0%Irish
- 511.0%Scottish
- 430.8%Canadian
- 280.5%Polish
- 210.4%German
- 180.3%British
- 160.3%Turkish
- 130.2%Swiss
- 100.2%Italian
- 80.1%Norwegian
- 50.09%Australian
Geographical mobility in Oxford

- Same house 1 year ago
- 2,00673.3%White (Caucasian)
- 4,28590.6%Black or African American
- 1960.4%American Indian / Alaska Native
- 86100.0%Asian
- 32281.5%Other race
- 52862.8%Two or more races
- 2,00772.8%White alone, not Hispanic / Latino
- 44181.0%Hispanic or Latino

-
- Moved within same county
- 42015.3%White / Caucasian
- 2395.1%Black or African American
- 826.6%American Indian / Alaska Native
- 6115.5%Other race
- 202.3%Two or more races
- 44216.0%White alone, not Hispanic / Latino
- 478.5%Hispanic or Latino

-
- Moved within same state
- 752.7%White / Caucasian
- 1924.1%Black or African American
- 21125.1%Two or more races
- 742.7%White alone, not Hispanic / Latino
- 509.1%Hispanic or Latino

-
- Moved from different state
- 1385.0%White / Caucasian
- 190.4%Black or African American
- 8910.6%Two or more races
- 1435.2%White alone, not Hispanic / Latino

-
- Moved from abroad
- 160.6%White
- 90.2%Black or African American
- 51.2%Other race
- 140.5%White alone, not Hispanic / Latino
- 71.3%Hispanic or Latino

Children Nativity (place of birth) in Oxford
Place of birth for residents in Oxford
![Place of birth for the foreign-born population - Regions]()
- 233Americas
- 233Latin America
- 233Central America
- 137Asia
- 72Europe
- 55Western Europe
- 53Western Asia
- 47South Central Asia
- 23Africa
- 23Western Africa
- 20South Eastern Asia
- 16Northern Europe
- 15Eastern Asia
- 15China

![Place of birth for the foreign-born population - Countries]()
- 218Mexico
- 47India
- 43Germany
- 30Yemen
- 23Turkey
- 23Nigeria
- 15China
- 12Switzerland
- 12Philippines
- 11Guatemala
- 8Ireland
- 8England
- 7Vietnam
- 3Honduras

Grandparents responsible for own grandchildren in Oxford
Zip codes: 27565.