Races in Oxford, Mississippi (MS) Detailed Stats
Data:
Races - White alone (%)
Races - White alone (% change since 2000)
Races - Black alone (%)
Races - Black alone (% change since 2000)
Races - American Indian alone (%)
Races - American Indian alone (% change since 2000)
Races - Asian alone (%)
Races - Asian alone (% change since 2000)
Races - Hispanic (%)
Races - Hispanic (% change since 2000)
Races - Native Hawaiian and Other Pacific Islander alone (%)
Races - Native Hawaiian and Other Pacific Islander alone (% change since 2000)
Races - Two or more races(%)
Races - Two or more races(% change since 2000)
Races - Other race alone (%)
Races - Other race alone (% change since 2000)
Racial diversity
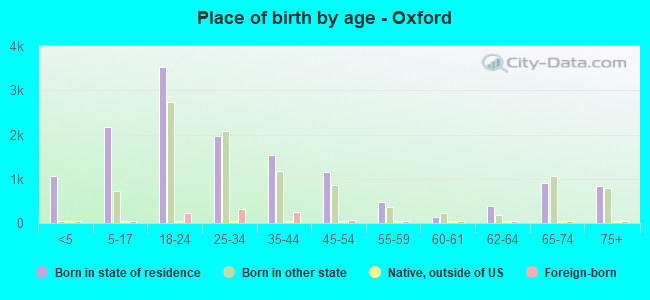
Place of birth - Born in state of residence (%)
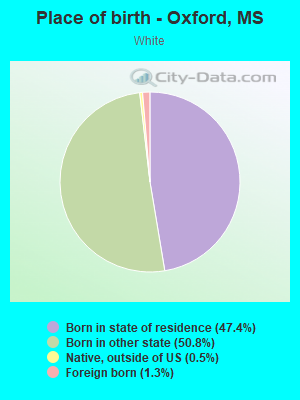
Place of birth - Born in state of residence (%) - White
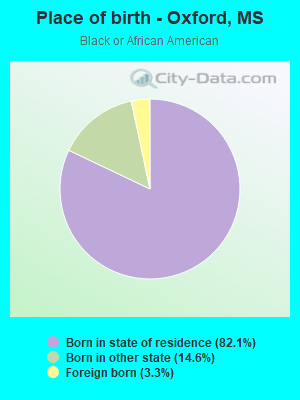
Place of birth - Born in state of residence (%) - Black or African American
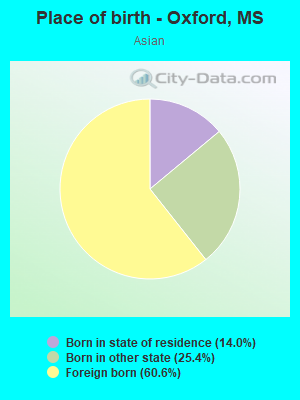
Place of birth - Born in state of residence (%) - Asian
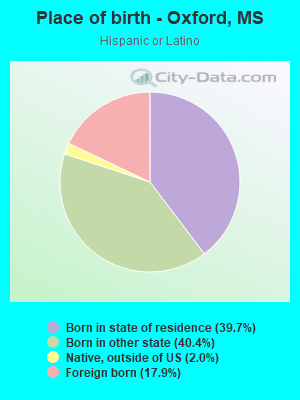
Place of birth - Born in state of residence (%) - Hispanic or Latino
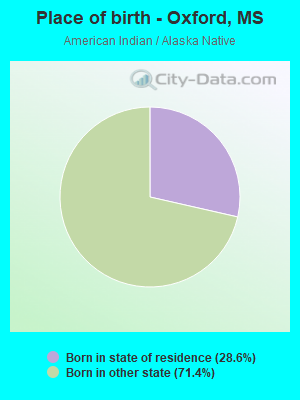
Place of birth - Born in state of residence (%) - American Indian and Alaska Native
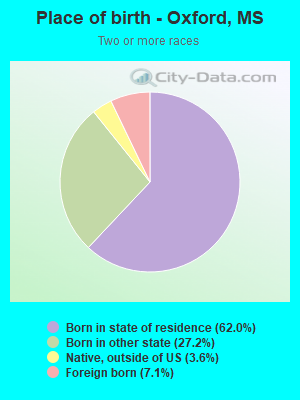
Place of birth - Born in state of residence (%) - Multirace
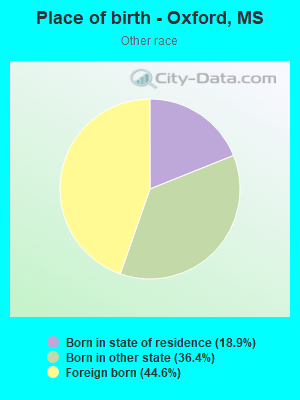
Place of birth - Born in state of residence (%) - Other Race
Place of birth - Born in other state (%)
Place of birth - Born in other state (%) - White
Place of birth - Born in other state (%) - Black or African American
Place of birth - Born in other state (%) - Asian
Place of birth - Born in other state (%) - Hispanic or Latino
Place of birth - Born in other state (%) - American Indian and Alaska Native
Place of birth - Born in other state (%) - Multirace
Place of birth - Born in other state (%) - Other Race
Place of birth - Native, outside of US (%)
Place of birth - Native, outside of US (%) - White
Place of birth - Native, outside of US (%) - Black or African American
Place of birth - Native, outside of US (%) - Asian
Place of birth - Native, outside of US (%) - Hispanic or Latino
Place of birth - Native, outside of US (%) - American Indian and Alaska Native
Place of birth - Native, outside of US (%) - Multirace
Place of birth - Native, outside of US (%) - Other Race
Place of birth - Foreign born (%)
Place of birth - Foreign born (%) - White
Place of birth - Foreign born (%) - Black or African American
Place of birth - Foreign born (%) - Asian
Place of birth - Foreign born (%) - Hispanic or Latino
Place of birth - Foreign born (%) - American Indian and Alaska Native
Place of birth - Foreign born (%) - Multirace
Place of birth - Foreign born (%) - Other Race
Residents speaking English at home (%)
Residents speaking English at home - Born in the United States (%)
Residents speaking English at home - Native, born elsewhere (%)
Residents speaking English at home - Foreign born (%)
Residents speaking Spanish at home (%)
Residents speaking Spanish at home - Born in the United States (%)
Residents speaking Spanish at home - Native, born elsewhere (%)
Residents speaking Spanish at home - Foreign born (%)
Residents speaking other language at home (%)
Residents speaking other language at home - Born in the United States (%)
Residents speaking other language at home - Native, born elsewhere (%)
Residents speaking other language at home - Foreign born (%)
Marital status - Never married (%)
Marital status - Now married (%)
Marital status - Separated (%)
Marital status - Widowed (%)
Marital status - Divorced (%)
Ancestries Reported - Arab (%)
Ancestries Reported - Czech (%)
Ancestries Reported - Danish (%)
Ancestries Reported - Dutch (%)
Ancestries Reported - English (%)
Ancestries Reported - French (%)
Ancestries Reported - French Canadian (%)
Ancestries Reported - German (%)
Ancestries Reported - Greek (%)
Ancestries Reported - Hungarian (%)
Ancestries Reported - Irish (%)
Ancestries Reported - Italian (%)
Ancestries Reported - Lithuanian (%)
Ancestries Reported - Norwegian (%)
Ancestries Reported - Polish (%)
Ancestries Reported - Portuguese (%)
Ancestries Reported - Russian (%)
Ancestries Reported - Scotch-Irish (%)
Ancestries Reported - Scottish (%)
Ancestries Reported - Slovak (%)
Ancestries Reported - Subsaharan African (%)
Ancestries Reported - Swedish (%)
Ancestries Reported - Swiss (%)
Ancestries Reported - Ukrainian (%)
Ancestries Reported - United States (%)
Ancestries Reported - Welsh (%)
Ancestries Reported - West Indian (%)
Ancestries Reported - Other (%)
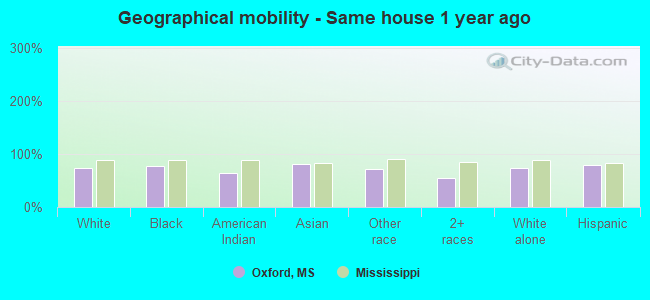
Geographical mobility - Same house 1 year ago (%)
Geographical mobility - Same house 1 year ago (%) - White
Geographical mobility - Same house 1 year ago (%) - Black or African American
Geographical mobility - Same house 1 year ago (%) - Asian
Geographical mobility - Same house 1 year ago (%) - Hispanic or Latino
Geographical mobility - Same house 1 year ago (%) - American Indian and Alaska Native
Geographical mobility - Same house 1 year ago (%) - Multirace
Geographical mobility - Same house 1 year ago (%) - Other Race
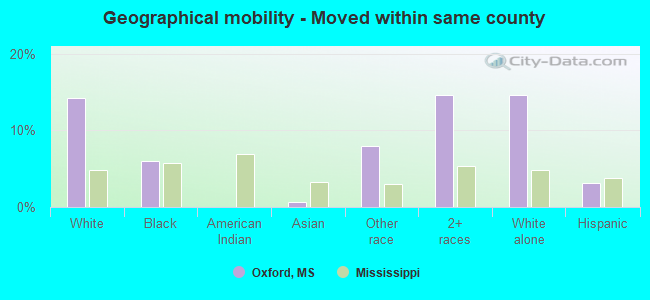
Geographical mobility - Moved within same county (%)
Geographical mobility - Moved within same county (%) - White
Geographical mobility - Moved within same county (%) - Black or African American
Geographical mobility - Moved within same county (%) - Asian
Geographical mobility - Moved within same county (%) - Hispanic or Latino
Geographical mobility - Moved within same county (%) - American Indian and Alaska Native
Geographical mobility - Moved within same county (%) - Multirace
Geographical mobility - Moved within same county (%) - Other Race
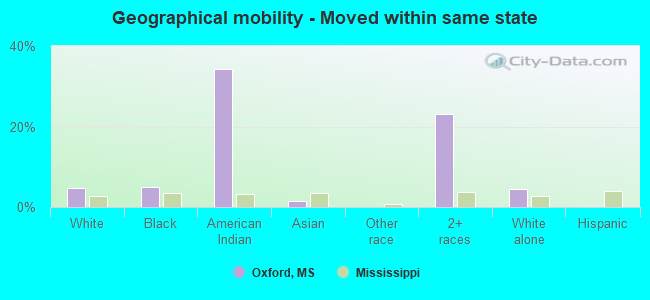
Geographical mobility - Moved from different county within same state (%)
Geographical mobility - Moved from different county within same state (%) - White
Geographical mobility - Moved from different county within same state (%) - Black or African American
Geographical mobility - Moved from different county within same state (%) - Asian
Geographical mobility - Moved from different county within same state (%) - Hispanic or Latino
Geographical mobility - Moved from different county within same state (%) - American Indian and Alaska Native
Geographical mobility - Moved from different county within same state (%) - Multirace
Geographical mobility - Moved from different county within same state (%) - Other Race
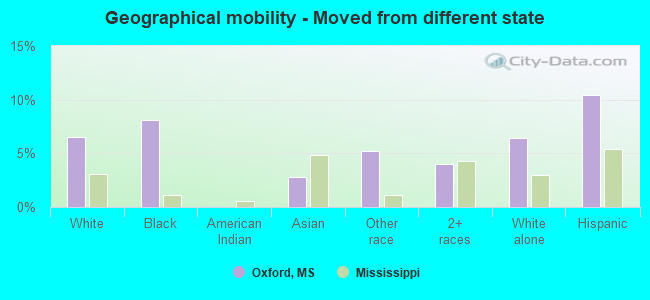
Geographical mobility - Moved from different state (%)
Geographical mobility - Moved from different state (%) - White
Geographical mobility - Moved from different state (%) - Black or African American
Geographical mobility - Moved from different state (%) - Asian
Geographical mobility - Moved from different state (%) - Hispanic or Latino
Geographical mobility - Moved from different state (%) - American Indian and Alaska Native
Geographical mobility - Moved from different state (%) - Multirace
Geographical mobility - Moved from different state (%) - Other Race
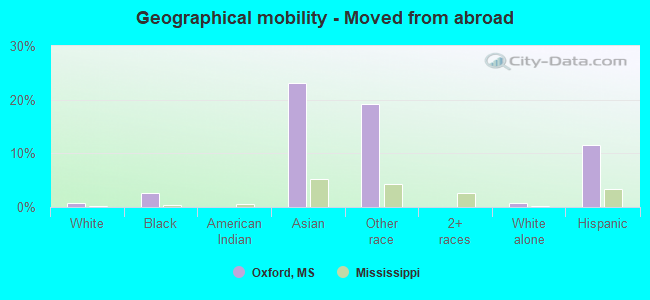
Geographical mobility - Moved from abroad (%)
Geographical mobility - Moved from abroad (%) - White
Geographical mobility - Moved from abroad (%) - Black or African American
Geographical mobility - Moved from abroad (%) - Asian
Geographical mobility - Moved from abroad (%) - Hispanic or Latino
Geographical mobility - Moved from abroad (%) - American Indian and Alaska Native
Geographical mobility - Moved from abroad (%) - Multirace
Geographical mobility - Moved from abroad (%) - Other Race
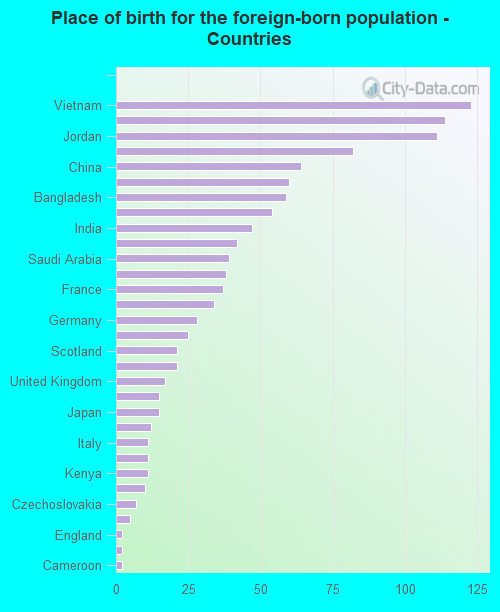
Place of birth for the foreign-born population - Ireland (%)
Place of birth for the foreign-born population - Denmark (%)
Place of birth for the foreign-born population - Norway (%)
Place of birth for the foreign-born population - Sweden (%)
Place of birth for the foreign-born population - United Kingdom (%)
Place of birth for the foreign-born population - England (%)
Place of birth for the foreign-born population - Scotland (%)
Place of birth for the foreign-born population - Other Northern Europe (%)
Place of birth for the foreign-born population - Austria (%)
Place of birth for the foreign-born population - Belgium (%)
Place of birth for the foreign-born population - France (%)
Place of birth for the foreign-born population - Germany (%)
Place of birth for the foreign-born population - Netherlands (%)
Place of birth for the foreign-born population - Switzerland (%)
Place of birth for the foreign-born population - Other Western Europe (%)
Place of birth for the foreign-born population - Greece (%)
Place of birth for the foreign-born population - Italy (%)
Place of birth for the foreign-born population - Portugal (%)
Place of birth for the foreign-born population - Spain (%)
Place of birth for the foreign-born population - Other Southern Europe (%)
Place of birth for the foreign-born population - Albania (%)
Place of birth for the foreign-born population - Belarus (%)
Place of birth for the foreign-born population - Bosnia and Herzegovina (%)
Place of birth for the foreign-born population - Bulgaria (%)
Place of birth for the foreign-born population - Croatia (%)
Place of birth for the foreign-born population - Czechoslovakia (%)
Place of birth for the foreign-born population - Hungary (%)
Place of birth for the foreign-born population - Latvia (%)
Place of birth for the foreign-born population - Lithuania (%)
Place of birth for the foreign-born population - North Macedonia (Macedonia) (%)
Place of birth for the foreign-born population - Moldova (%)
Place of birth for the foreign-born population - Poland (%)
Place of birth for the foreign-born population - Romania (%)
Place of birth for the foreign-born population - Russia (%)
Place of birth for the foreign-born population - Serbia (%)
Place of birth for the foreign-born population - Ukraine (%)
Place of birth for the foreign-born population - Other Eastern Europe (%)
Place of birth for the foreign-born population - China (%)
Place of birth for the foreign-born population - Hong Kong (%)
Place of birth for the foreign-born population - Taiwan (%)
Place of birth for the foreign-born population - Japan (%)
Place of birth for the foreign-born population - Korea (%)
Place of birth for the foreign-born population - Other Eastern Asia (%)
Place of birth for the foreign-born population - Afghanistan (%)
Place of birth for the foreign-born population - Bangladesh (%)
Place of birth for the foreign-born population - India (%)
Place of birth for the foreign-born population - Iran (%)
Place of birth for the foreign-born population - Kazakhstan (%)
Place of birth for the foreign-born population - Nepal (%)
Place of birth for the foreign-born population - Pakistan (%)
Place of birth for the foreign-born population - Sri Lanka (%)
Place of birth for the foreign-born population - Uzbekistan (%)
Place of birth for the foreign-born population - Other South Central Asia (%)
Place of birth for the foreign-born population - Burma (%)
Place of birth for the foreign-born population - Cambodia (%)
Place of birth for the foreign-born population - Indonesia (%)
Place of birth for the foreign-born population - Laos (%)
Place of birth for the foreign-born population - Malaysia (%)
Place of birth for the foreign-born population - Philippines (%)
Place of birth for the foreign-born population - Singapore (%)
Place of birth for the foreign-born population - Thailand (%)
Place of birth for the foreign-born population - Vietnam (%)
Place of birth for the foreign-born population - Other South Eastern Asia (%)
Place of birth for the foreign-born population - Armenia (%)
Place of birth for the foreign-born population - Iraq (%)
Place of birth for the foreign-born population - Israel (%)
Place of birth for the foreign-born population - Jordan (%)
Place of birth for the foreign-born population - Kuwait (%)
Place of birth for the foreign-born population - Lebanon (%)
Place of birth for the foreign-born population - Saudi Arabia (%)
Place of birth for the foreign-born population - Syria (%)
Place of birth for the foreign-born population - Turkey (%)
Place of birth for the foreign-born population - Yemen (%)
Place of birth for the foreign-born population - Other Western Asia (%)
Place of birth for the foreign-born population - Eritrea (%)
Place of birth for the foreign-born population - Ethiopia (%)
Place of birth for the foreign-born population - Kenya (%)
Place of birth for the foreign-born population - Somalia (%)
Place of birth for the foreign-born population - Uganda (%)
Place of birth for the foreign-born population - Zimbabwe (%)
Place of birth for the foreign-born population - Other Eastern Africa (%)
Place of birth for the foreign-born population - Cameroon (%)
Place of birth for the foreign-born population - Congo (%)
Place of birth for the foreign-born population - Democratic Republic of Congo (Zaire) (%)
Place of birth for the foreign-born population - Other Middle Africa (%)
Place of birth for the foreign-born population - Egypt (%)
Place of birth for the foreign-born population - Morocco (%)
Place of birth for the foreign-born population - Sudan (%)
Place of birth for the foreign-born population - Other Northern Africa (%)
Place of birth for the foreign-born population - South Africa (%)
Place of birth for the foreign-born population - Other Southern Africa (%)
Place of birth for the foreign-born population - Cabo Verde (%)
Place of birth for the foreign-born population - Ghana (%)
Place of birth for the foreign-born population - Liberia (%)
Place of birth for the foreign-born population - Nigeria (%)
Place of birth for the foreign-born population - Senegal (%)
Place of birth for the foreign-born population - Sierra Leone (%)
Place of birth for the foreign-born population - Other Western Africa (%)
Place of birth for the foreign-born population - Australia (%)
Place of birth for the foreign-born population - New Zealand (%)
Place of birth for the foreign-born population - Fiji (%)
Place of birth for the foreign-born population - Micronesia (%)
Place of birth for the foreign-born population - Bahamas (%)
Place of birth for the foreign-born population - Barbados (%)
Place of birth for the foreign-born population - Cuba (%)
Place of birth for the foreign-born population - Dominica (%)
Place of birth for the foreign-born population - Dominican Republic (%)
Place of birth for the foreign-born population - Grenada (%)
Place of birth for the foreign-born population - Haiti (%)
Place of birth for the foreign-born population - Jamaica (%)
Place of birth for the foreign-born population - St. Vincent and the Grenadines (%)
Place of birth for the foreign-born population - Trinidad and Tobago (%)
Place of birth for the foreign-born population - West Indies (%)
Place of birth for the foreign-born population - Other Caribbean (%)
Place of birth for the foreign-born population - Belize (%)
Place of birth for the foreign-born population - Costa Rica (%)
Place of birth for the foreign-born population - El Salvador (%)
Place of birth for the foreign-born population - Guatemala (%)
Place of birth for the foreign-born population - Honduras (%)
Place of birth for the foreign-born population - Mexico (%)
Place of birth for the foreign-born population - Nicaragua (%)
Place of birth for the foreign-born population - Panama (%)
Place of birth for the foreign-born population - Other Central America (%)
Place of birth for the foreign-born population - Argentina (%)
Place of birth for the foreign-born population - Bolivia (%)
Place of birth for the foreign-born population - Brazil (%)
Place of birth for the foreign-born population - Chile (%)
Place of birth for the foreign-born population - Colombia (%)
Place of birth for the foreign-born population - Ecuador (%)
Place of birth for the foreign-born population - Guyana (%)
Place of birth for the foreign-born population - Peru (%)
Place of birth for the foreign-born population - Uruguay (%)
Place of birth for the foreign-born population - Venezuela (%)
Place of birth for the foreign-born population - Other South America (%)
Place of birth for the foreign-born population - Canada (%)
Place of birth for the foreign-born population - Other Northern America (%)
Place of birth for the foreign-born population - Other (%)
Latest news about races in Oxford, MS collected exclusively by city-data.com from local newspapers, TV, and radio stations
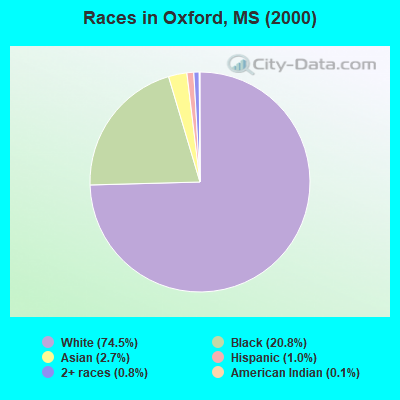
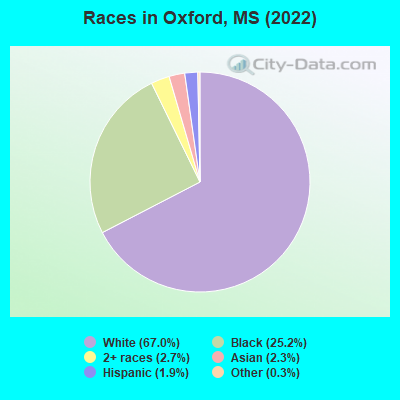
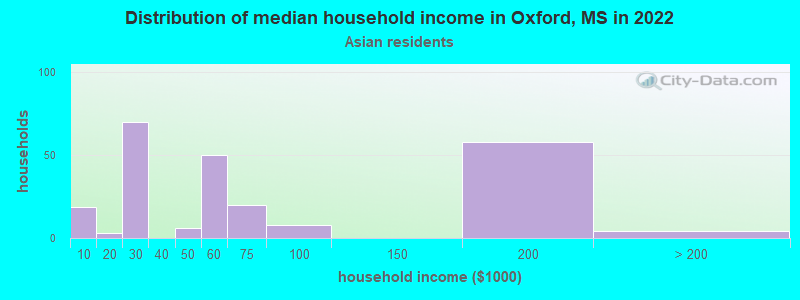
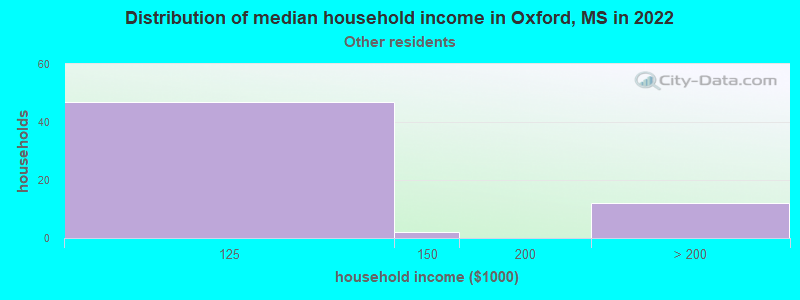
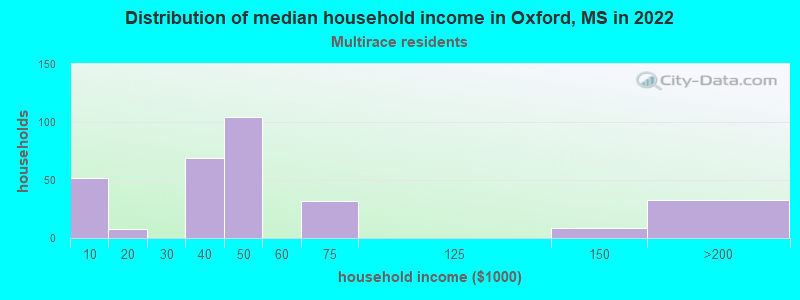
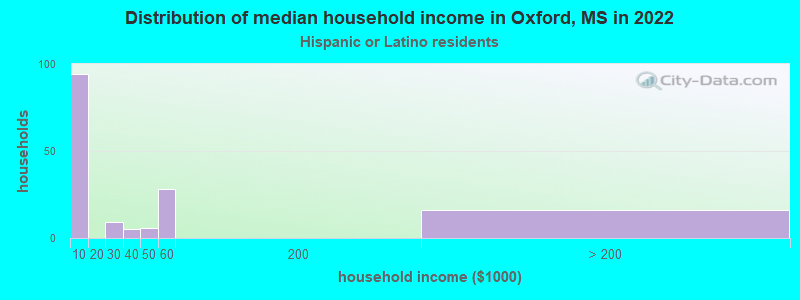
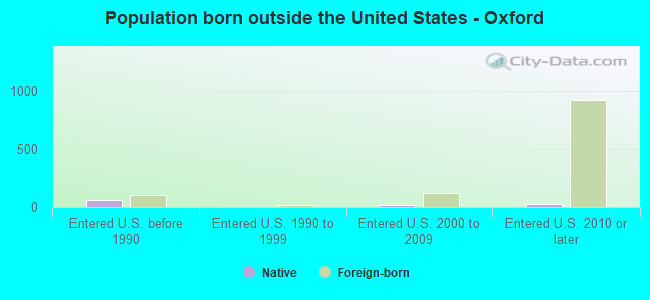
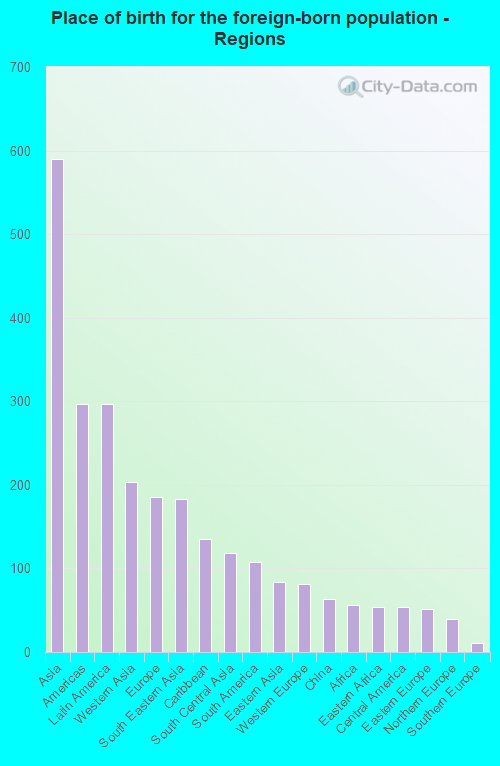
According to 2022 data, the most numerous races in Oxford, MS are White alone (17,124 residents), Black alone (6,449 residents), and Hispanic (498 residents). 96.2% of Oxford residents speak English at home. 4.4% of Oxford, MS residents are foreign-born (2.3% born in Asia, 1.1% born in Latin America, 0.7% born in Europe), which is 54.8% greater than the foreign-born rate of 2.0% across the entire state of Mississippi.
Race distribution in Oxford
2000 2022
1,727,908 60.7% White alone 1,028,473 36.2% Black alone 39,569 1.4% Hispanic 17,272 0.6% Two or more races 18,349 0.6% Asian alone 11,224 0.4% American Indian alone 1,294 0.05% Other race alone 569 0.02% Native Hawaiian and Other
1,625,979 55.3% White alone 1,072,962 36.5% Black alone 97,177 3.3% Hispanic 96,367 3.3% Two or more races 25,217 0.9% Asian alone 12,457 0.4% American Indian alone 9,501 0.3% Other race alone 397 0.01% Native Hawaiian and Other
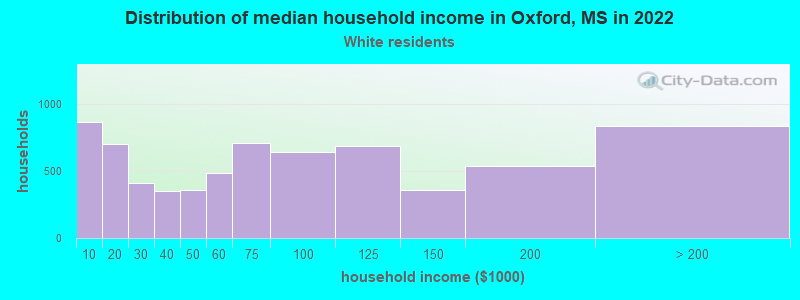
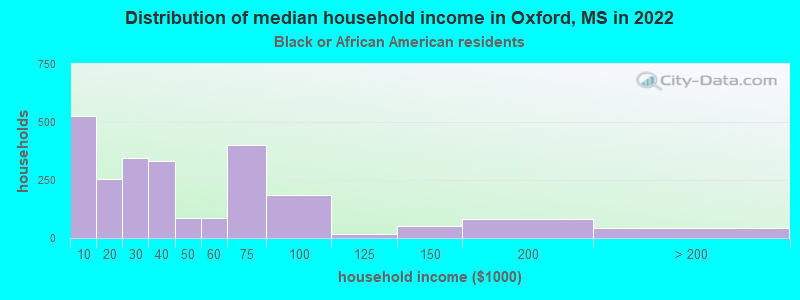
Income and house value in Oxford Median household income in 2022 $64,801 White non-Hispanic householders$34,418 Black householders$40,073 Asian householders$48,098 Two or more races householdersMedian 2022 house value $400,564 White Non-Hispanic householders$211,768 Black or African American householders$368,165 American Indian or Alaska Native householders $220,899 Asian householders$161,992 Two or more races householders
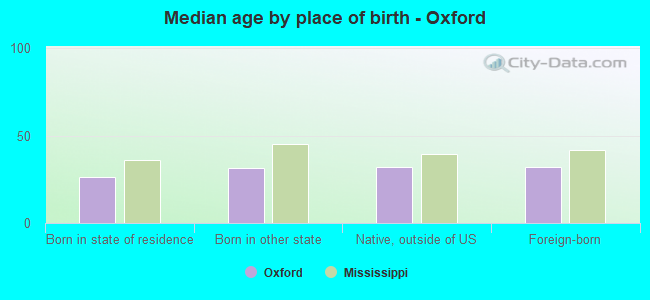
Median age by race in Oxford
30.2 Median age for White residents27.4 31.4 26.6 Median age for Black or African American residents24.9 27.6 -703,818,368.7 Median age for American Indian / Alaska Native residents-751,111,110.4 -710,601,718.5 28.4 Median age for Asian residents27.2 33.7 -666,666,666.0 Median age for Native Hawaiian / Pacific Islander residents-668,724,279.2 -670,599,802.7 33.4 Median age for Other race residents32.2 31.0 26.5 Median age for Two or more races residents19.5 28.0 30.2 Median age for White alone residents27.3 31.3 19.6 Median age for Hispanic or Latino residents6.6 31.0
Owner/renter occupied households by race in Oxford
House owners and renters - White residents 3,412 49.3% Owner occupied3,512 50.7% Renter occupiedHouse owners and renters - Black or African American residents 617 26.7% Owner occupied1,692 73.3% Renter occupiedHouse owners and renters - Asian residents 99 33.8% Owner occupied193 66.2% Renter occupiedHouse owners and renters - Other race residents 42 94.1% Owner occupied3 5.9% Renter occupiedHouse owners and renters - Two or more races residents 73 21.3% Owner occupied271 78.7% Renter occupiedHouse owners and renters - White alone residents 3,428 48.9% Owner occupied3,588 51.1% Renter occupiedHouse owners and renters - Hispanic or Latino residents 8 75.3% Owner occupied3 24.7% Renter occupied
Language usage in Oxford
English speakers - Total 96.2% of residents of Oxford speak English at home.
0.6% of residents speak Spanish at home 123 82.6% Speak English very well26 17.4% Speak English less than very well3.4% of residents speak other language at home 529 64.5% Speak English very well291 35.5% Speak English less than very well
English speakers - Born in the United States 98.2% of residents of Oxford speak English at home.
0.9% of residents speak Spanish at home 93 100.0% Speak English very well1.0% of residents speak other language at home 90 90.9% Speak English very well9 9.1% Speak English less than very well
English speakers - Native, born elsewhere 99.1% of residents of Oxford speak English at home.
English speakers - Foreign-born 35.8% of residents of Oxford speak English at home.
5.1% of residents speak Spanish at home 23 45.1% Speak English very well28 54.9% Speak English less than very well60.2% of residents speak other language at home 365 60.5% Speak English very well238 39.5% Speak English less than very well
White (Caucasian) - Speak only English Native:
99.3% (16,163)Foreign-born:
54.5% (125)
White (Caucasian) - Speak another language Native:
0.8% (133)Foreign-born:
49.9% (114)
Black or African American - Speak only English Native:
99.8% (5,833)Foreign-born:
67.1% (147)
Black or African American - Speak another language Native:
0.2% (9)Foreign-born:
29.4% (64)
Asian - Speak only English Native:
95.7% (159)Foreign-born:
29.2% (87)
Other race - Speak only English Native:
62.1% (105)Foreign-born:
22.2% (30)
Other race - Speak another language Native:
35.6% (60)Foreign-born:
84.2% (114)
Two or more races - Speak another language Native:
2.2% (16)Foreign-born:
100.0% (58)
White alone - Speak only English Native:
99.0% (16,098)Foreign-born:
37.8% (131)
White alone - Speak another language Native:
1.0% (169)Foreign-born:
63.3% (219)
Hispanic or Latino - Speak only English Native:
93.7% (305)Foreign-born:
16.8% (12)
Hispanic or Latino - Speak another language Native:
8.2% (27)Foreign-born:
72.8% (53)
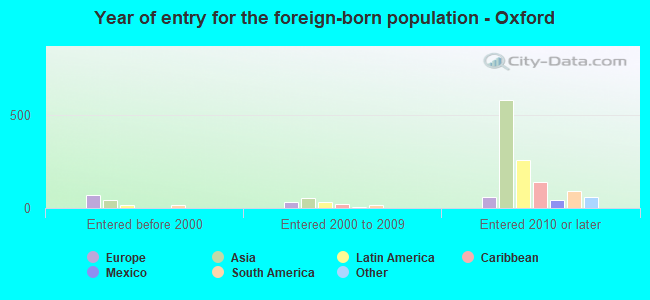
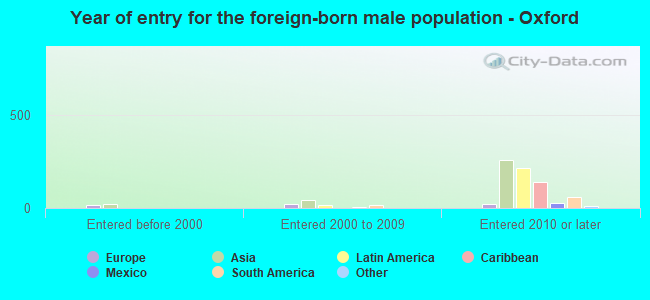
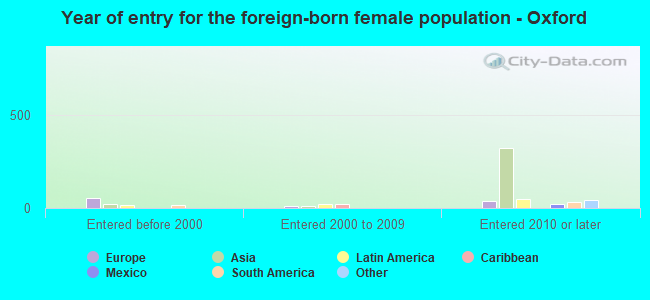
Foreign-born residents in Oxford 1,130 residents are foreign born (2.3% Asia , 1.1% Latin America , 0.7% Europe ).
This city:
4.4%Mississippi:
2.3%
Marital status for residents in Oxford Marital status - White (Caucasian) population 15 years and over
Males 58.7% Never married33.2% Now married0.4% Separated3.2% Widowed4.6% DivorcedFemales 44.4% Never married36.7% Now married1.0% Separated7.8% Widowed10.1% DivorcedWomen who gave birth in the past 12 months Now married:
100.0% (79)Unmarried:
0.0% (0)
Women who did not give birth in the past 12 months Now married:
28.2% (1,480)Unmarried:
71.8% (3,765)
Marital status - Black or African American population 15 years and over
Males 63.7% Never married26.1% Now married1.4% Separated0.7% Widowed8.0% DivorcedFemales 58.5% Never married23.2% Now married1.4% Separated5.8% Widowed11.1% DivorcedWomen who gave birth in the past 12 months Now married:
0.0% (0)Unmarried:
100.0% (117)
Women who did not give birth in the past 12 months Now married:
23.4% (508)Unmarried:
76.6% (1,662)
Marital status - American Indian / Alaska Native population 15 years and over
Males 100.0% Never married0.0% Now married0.0% Separated0.0% Widowed0.0% DivorcedFemales 0.0% Never married0.0% Now married0.0% Separated0.0% Widowed100.0% DivorcedMarital status - Asian population 15 years and over
Males 29.4% Never married70.6% Now married0.0% Separated0.0% Widowed0.0% DivorcedFemales 40.8% Never married59.2% Now married0.0% Separated0.0% Widowed0.0% DivorcedWomen who gave birth in the past 12 months Now married:
100.0% (25)Unmarried:
0.0% (0)
Women who did not give birth in the past 12 months Now married:
36.2% (47)Unmarried:
63.8% (82)
Marital status - Other race population 15 years and over
Males 52.4% Never married47.6% Now married0.0% Separated0.0% Widowed0.0% DivorcedFemales 68.2% Never married31.8% Now married0.0% Separated0.0% Widowed0.0% DivorcedWomen who gave birth in the past 12 months Now married:
0.0% (0)Unmarried:
100.0% (115)
Women who did not give birth in the past 12 months Now married:
66.2% (70)Unmarried:
33.8% (36)
Marital status - Two or more races population 15 years and over
Males 32.1% Never married61.6% Now married6.3% Separated0.0% Widowed0.0% DivorcedFemales 32.5% Never married63.6% Now married3.5% Separated0.0% Widowed0.4% DivorcedWomen who did not give birth in the past 12 months Now married:
64.1% (224)Unmarried:
35.9% (125)
Marital status - White alone, not Hispanic / Latino population 15 years and over
Males 58.7% Never married33.1% Now married0.4% Separated3.2% Widowed4.6% DivorcedFemales 44.5% Never married36.5% Now married1.0% Separated7.8% Widowed10.2% DivorcedWomen who gave birth in the past 12 months Now married:
100.0% (80)Unmarried:
0.0% (0)
Women who did not give birth in the past 12 months Now married:
27.8% (1,459)Unmarried:
72.2% (3,796)
Marital status - Hispanic or Latino population 15 years and over
Males 32.8% Never married67.2% Now married0.0% Separated0.0% Widowed0.0% DivorcedFemales 65.4% Never married34.6% Now married0.0% Separated0.0% Widowed0.0% DivorcedWomen who gave birth in the past 12 months Now married:
0.0% (0)Unmarried:
100.0% (87)
Women who did not give birth in the past 12 months Now married:
61.0% (69)Unmarried:
39.0% (44)
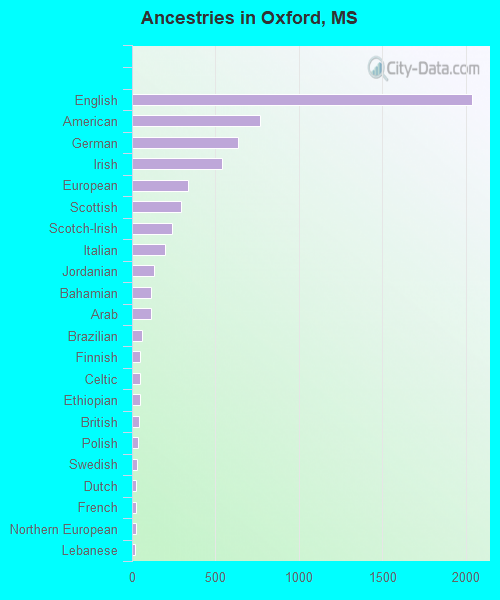
Ancestries in Oxford
2,036 18.0% English767 6.8% American634 5.6% German539 4.8% Irish338 3.0% European291 2.6% Scottish237 2.1% Scotch-Irish195 1.7% Italian132 1.2% Jordanian116 1.0% Bahamian112 1.0% Arab58 0.5% Brazilian49 0.4% Finnish46 0.4% Celtic45 0.4% Ethiopian39 0.3% British33 0.3% Polish27 0.2% Swedish26 0.2% Dutch26 0.2% French24 0.2% Northern European19 0.2% Lebanese15 0.1% Jamaican14 0.1% Ukrainian13 0.1% Eastern European12 0.1% Portuguese12 0.1% Kenyan11 0.10% Slovak8 0.07% Syrian7 0.06% Czech6 0.05% Armenian2 0.02% Welsh
Geographical mobility in Oxford Same house 1 year ago 12,502 73.4% White (Caucasian)4,969 77.1% Black or African American12 64.3% American Indian / Alaska Native446 81.2% Asian221 72.0% Other race444 53.9% Two or more races12,464 73.2% White alone, not Hispanic / Latino363 79.9% Hispanic or LatinoMoved within same county 2,430 14.3% White / Caucasian389 6.0% Black or African American3 0.6% Asian24 7.9% Other race120 14.6% Two or more races2,498 14.7% White alone, not Hispanic / Latino14 3.1% Hispanic or LatinoMoved within same state 784 4.6% White / Caucasian318 4.9% Black or African American6 34.4% American Indian / Alaska Native9 1.6% Asian191 23.2% Two or more races779 4.6% White alone, not Hispanic / LatinoMoved from different state 1,106 6.5% White / Caucasian524 8.1% Black or African American16 2.8% Asian16 5.2% Other race33 4.0% Two or more races1,089 6.4% White alone, not Hispanic / Latino47 10.4% Hispanic or LatinoMoved from abroad 118 0.7% White162 2.5% Black or African American127 23.1% Asian59 19.2% Other race124 0.7% White alone, not Hispanic / Latino52 11.5% Hispanic or Latino
Children Nativity (place of birth) in Oxford
Children under 6 years - Living with two parents Both parents native 830 98.1% Native16 1.9% Foreign-bornBoth parents foreign-born 42 52.1% Native39 47.9% Foreign-bornOne native, one foreign-born parent 132 100.0% NativeChildren under 6 years - Living with one parent Native parent 325 100.0% Native
Children 6 to 17 years - Living with two parents Both parents native 1,628 100.0% NativeOne native, one foreign-born parent 79 100.0% NativeChildren 6 to 17 years - Living with one parent Native parent 784 97.2% Native22 2.8% Foreign-bornForeign-born parent 8 100.0% Native
Grandparents responsible for own grandchildren in Oxford
Grandparents (30 to 59 years) Black or African American 55 100.0% Responsible for grandchildren
Grandparents (60 years and over) Black or African American 43 100.0% Responsible for grandchildren