Races in Ottumwa, Iowa (IA) Detailed Stats
Data:
Races - White alone (%)
Races - White alone (% change since 2000)
Races - Black alone (%)
Races - Black alone (% change since 2000)
Races - American Indian alone (%)
Races - American Indian alone (% change since 2000)
Races - Asian alone (%)
Races - Asian alone (% change since 2000)
Races - Hispanic (%)
Races - Hispanic (% change since 2000)
Races - Native Hawaiian and Other Pacific Islander alone (%)
Races - Native Hawaiian and Other Pacific Islander alone (% change since 2000)
Races - Two or more races(%)
Races - Two or more races(% change since 2000)
Races - Other race alone (%)
Races - Other race alone (% change since 2000)
Racial diversity
Place of birth - Born in state of residence (%)
Place of birth - Born in state of residence (%) - White
Place of birth - Born in state of residence (%) - Black or African American
Place of birth - Born in state of residence (%) - Asian
Place of birth - Born in state of residence (%) - Hispanic or Latino
Place of birth - Born in state of residence (%) - American Indian and Alaska Native
Place of birth - Born in state of residence (%) - Multirace
Place of birth - Born in state of residence (%) - Other Race
Place of birth - Born in other state (%)
Place of birth - Born in other state (%) - White
Place of birth - Born in other state (%) - Black or African American
Place of birth - Born in other state (%) - Asian
Place of birth - Born in other state (%) - Hispanic or Latino
Place of birth - Born in other state (%) - American Indian and Alaska Native
Place of birth - Born in other state (%) - Multirace
Place of birth - Born in other state (%) - Other Race
Place of birth - Native, outside of US (%)
Place of birth - Native, outside of US (%) - White
Place of birth - Native, outside of US (%) - Black or African American
Place of birth - Native, outside of US (%) - Asian
Place of birth - Native, outside of US (%) - Hispanic or Latino
Place of birth - Native, outside of US (%) - American Indian and Alaska Native
Place of birth - Native, outside of US (%) - Multirace
Place of birth - Native, outside of US (%) - Other Race
Place of birth - Foreign born (%)
Place of birth - Foreign born (%) - White
Place of birth - Foreign born (%) - Black or African American
Place of birth - Foreign born (%) - Asian
Place of birth - Foreign born (%) - Hispanic or Latino
Place of birth - Foreign born (%) - American Indian and Alaska Native
Place of birth - Foreign born (%) - Multirace
Place of birth - Foreign born (%) - Other Race
Residents speaking English at home (%)
Residents speaking English at home - Born in the United States (%)
Residents speaking English at home - Native, born elsewhere (%)
Residents speaking English at home - Foreign born (%)
Residents speaking Spanish at home (%)
Residents speaking Spanish at home - Born in the United States (%)
Residents speaking Spanish at home - Native, born elsewhere (%)
Residents speaking Spanish at home - Foreign born (%)
Residents speaking other language at home (%)
Residents speaking other language at home - Born in the United States (%)
Residents speaking other language at home - Native, born elsewhere (%)
Residents speaking other language at home - Foreign born (%)
Marital status - Never married (%)
Marital status - Now married (%)
Marital status - Separated (%)
Marital status - Widowed (%)
Marital status - Divorced (%)
Ancestries Reported - Arab (%)
Ancestries Reported - Czech (%)
Ancestries Reported - Danish (%)
Ancestries Reported - Dutch (%)
Ancestries Reported - English (%)
Ancestries Reported - French (%)
Ancestries Reported - French Canadian (%)
Ancestries Reported - German (%)
Ancestries Reported - Greek (%)
Ancestries Reported - Hungarian (%)
Ancestries Reported - Irish (%)
Ancestries Reported - Italian (%)
Ancestries Reported - Lithuanian (%)
Ancestries Reported - Norwegian (%)
Ancestries Reported - Polish (%)
Ancestries Reported - Portuguese (%)
Ancestries Reported - Russian (%)
Ancestries Reported - Scotch-Irish (%)
Ancestries Reported - Scottish (%)
Ancestries Reported - Slovak (%)
Ancestries Reported - Subsaharan African (%)
Ancestries Reported - Swedish (%)
Ancestries Reported - Swiss (%)
Ancestries Reported - Ukrainian (%)
Ancestries Reported - United States (%)
Ancestries Reported - Welsh (%)
Ancestries Reported - West Indian (%)
Ancestries Reported - Other (%)
Geographical mobility - Same house 1 year ago (%)
Geographical mobility - Same house 1 year ago (%) - White
Geographical mobility - Same house 1 year ago (%) - Black or African American
Geographical mobility - Same house 1 year ago (%) - Asian
Geographical mobility - Same house 1 year ago (%) - Hispanic or Latino
Geographical mobility - Same house 1 year ago (%) - American Indian and Alaska Native
Geographical mobility - Same house 1 year ago (%) - Multirace
Geographical mobility - Same house 1 year ago (%) - Other Race
Geographical mobility - Moved within same county (%)
Geographical mobility - Moved within same county (%) - White
Geographical mobility - Moved within same county (%) - Black or African American
Geographical mobility - Moved within same county (%) - Asian
Geographical mobility - Moved within same county (%) - Hispanic or Latino
Geographical mobility - Moved within same county (%) - American Indian and Alaska Native
Geographical mobility - Moved within same county (%) - Multirace
Geographical mobility - Moved within same county (%) - Other Race
Geographical mobility - Moved from different county within same state (%)
Geographical mobility - Moved from different county within same state (%) - White
Geographical mobility - Moved from different county within same state (%) - Black or African American
Geographical mobility - Moved from different county within same state (%) - Asian
Geographical mobility - Moved from different county within same state (%) - Hispanic or Latino
Geographical mobility - Moved from different county within same state (%) - American Indian and Alaska Native
Geographical mobility - Moved from different county within same state (%) - Multirace
Geographical mobility - Moved from different county within same state (%) - Other Race
Geographical mobility - Moved from different state (%)
Geographical mobility - Moved from different state (%) - White
Geographical mobility - Moved from different state (%) - Black or African American
Geographical mobility - Moved from different state (%) - Asian
Geographical mobility - Moved from different state (%) - Hispanic or Latino
Geographical mobility - Moved from different state (%) - American Indian and Alaska Native
Geographical mobility - Moved from different state (%) - Multirace
Geographical mobility - Moved from different state (%) - Other Race
Geographical mobility - Moved from abroad (%)
Geographical mobility - Moved from abroad (%) - White
Geographical mobility - Moved from abroad (%) - Black or African American
Geographical mobility - Moved from abroad (%) - Asian
Geographical mobility - Moved from abroad (%) - Hispanic or Latino
Geographical mobility - Moved from abroad (%) - American Indian and Alaska Native
Geographical mobility - Moved from abroad (%) - Multirace
Geographical mobility - Moved from abroad (%) - Other Race
Place of birth for the foreign-born population - Ireland (%)
Place of birth for the foreign-born population - Denmark (%)
Place of birth for the foreign-born population - Norway (%)
Place of birth for the foreign-born population - Sweden (%)
Place of birth for the foreign-born population - United Kingdom (%)
Place of birth for the foreign-born population - England (%)
Place of birth for the foreign-born population - Scotland (%)
Place of birth for the foreign-born population - Other Northern Europe (%)
Place of birth for the foreign-born population - Austria (%)
Place of birth for the foreign-born population - Belgium (%)
Place of birth for the foreign-born population - France (%)
Place of birth for the foreign-born population - Germany (%)
Place of birth for the foreign-born population - Netherlands (%)
Place of birth for the foreign-born population - Switzerland (%)
Place of birth for the foreign-born population - Other Western Europe (%)
Place of birth for the foreign-born population - Greece (%)
Place of birth for the foreign-born population - Italy (%)
Place of birth for the foreign-born population - Portugal (%)
Place of birth for the foreign-born population - Spain (%)
Place of birth for the foreign-born population - Other Southern Europe (%)
Place of birth for the foreign-born population - Albania (%)
Place of birth for the foreign-born population - Belarus (%)
Place of birth for the foreign-born population - Bosnia and Herzegovina (%)
Place of birth for the foreign-born population - Bulgaria (%)
Place of birth for the foreign-born population - Croatia (%)
Place of birth for the foreign-born population - Czechoslovakia (%)
Place of birth for the foreign-born population - Hungary (%)
Place of birth for the foreign-born population - Latvia (%)
Place of birth for the foreign-born population - Lithuania (%)
Place of birth for the foreign-born population - North Macedonia (Macedonia) (%)
Place of birth for the foreign-born population - Moldova (%)
Place of birth for the foreign-born population - Poland (%)
Place of birth for the foreign-born population - Romania (%)
Place of birth for the foreign-born population - Russia (%)
Place of birth for the foreign-born population - Serbia (%)
Place of birth for the foreign-born population - Ukraine (%)
Place of birth for the foreign-born population - Other Eastern Europe (%)
Place of birth for the foreign-born population - China (%)
Place of birth for the foreign-born population - Hong Kong (%)
Place of birth for the foreign-born population - Taiwan (%)
Place of birth for the foreign-born population - Japan (%)
Place of birth for the foreign-born population - Korea (%)
Place of birth for the foreign-born population - Other Eastern Asia (%)
Place of birth for the foreign-born population - Afghanistan (%)
Place of birth for the foreign-born population - Bangladesh (%)
Place of birth for the foreign-born population - India (%)
Place of birth for the foreign-born population - Iran (%)
Place of birth for the foreign-born population - Kazakhstan (%)
Place of birth for the foreign-born population - Nepal (%)
Place of birth for the foreign-born population - Pakistan (%)
Place of birth for the foreign-born population - Sri Lanka (%)
Place of birth for the foreign-born population - Uzbekistan (%)
Place of birth for the foreign-born population - Other South Central Asia (%)
Place of birth for the foreign-born population - Burma (%)
Place of birth for the foreign-born population - Cambodia (%)
Place of birth for the foreign-born population - Indonesia (%)
Place of birth for the foreign-born population - Laos (%)
Place of birth for the foreign-born population - Malaysia (%)
Place of birth for the foreign-born population - Philippines (%)
Place of birth for the foreign-born population - Singapore (%)
Place of birth for the foreign-born population - Thailand (%)
Place of birth for the foreign-born population - Vietnam (%)
Place of birth for the foreign-born population - Other South Eastern Asia (%)
Place of birth for the foreign-born population - Armenia (%)
Place of birth for the foreign-born population - Iraq (%)
Place of birth for the foreign-born population - Israel (%)
Place of birth for the foreign-born population - Jordan (%)
Place of birth for the foreign-born population - Kuwait (%)
Place of birth for the foreign-born population - Lebanon (%)
Place of birth for the foreign-born population - Saudi Arabia (%)
Place of birth for the foreign-born population - Syria (%)
Place of birth for the foreign-born population - Turkey (%)
Place of birth for the foreign-born population - Yemen (%)
Place of birth for the foreign-born population - Other Western Asia (%)
Place of birth for the foreign-born population - Eritrea (%)
Place of birth for the foreign-born population - Ethiopia (%)
Place of birth for the foreign-born population - Kenya (%)
Place of birth for the foreign-born population - Somalia (%)
Place of birth for the foreign-born population - Uganda (%)
Place of birth for the foreign-born population - Zimbabwe (%)
Place of birth for the foreign-born population - Other Eastern Africa (%)
Place of birth for the foreign-born population - Cameroon (%)
Place of birth for the foreign-born population - Congo (%)
Place of birth for the foreign-born population - Democratic Republic of Congo (Zaire) (%)
Place of birth for the foreign-born population - Other Middle Africa (%)
Place of birth for the foreign-born population - Egypt (%)
Place of birth for the foreign-born population - Morocco (%)
Place of birth for the foreign-born population - Sudan (%)
Place of birth for the foreign-born population - Other Northern Africa (%)
Place of birth for the foreign-born population - South Africa (%)
Place of birth for the foreign-born population - Other Southern Africa (%)
Place of birth for the foreign-born population - Cabo Verde (%)
Place of birth for the foreign-born population - Ghana (%)
Place of birth for the foreign-born population - Liberia (%)
Place of birth for the foreign-born population - Nigeria (%)
Place of birth for the foreign-born population - Senegal (%)
Place of birth for the foreign-born population - Sierra Leone (%)
Place of birth for the foreign-born population - Other Western Africa (%)
Place of birth for the foreign-born population - Australia (%)
Place of birth for the foreign-born population - New Zealand (%)
Place of birth for the foreign-born population - Fiji (%)
Place of birth for the foreign-born population - Micronesia (%)
Place of birth for the foreign-born population - Bahamas (%)
Place of birth for the foreign-born population - Barbados (%)
Place of birth for the foreign-born population - Cuba (%)
Place of birth for the foreign-born population - Dominica (%)
Place of birth for the foreign-born population - Dominican Republic (%)
Place of birth for the foreign-born population - Grenada (%)
Place of birth for the foreign-born population - Haiti (%)
Place of birth for the foreign-born population - Jamaica (%)
Place of birth for the foreign-born population - St. Vincent and the Grenadines (%)
Place of birth for the foreign-born population - Trinidad and Tobago (%)
Place of birth for the foreign-born population - West Indies (%)
Place of birth for the foreign-born population - Other Caribbean (%)
Place of birth for the foreign-born population - Belize (%)
Place of birth for the foreign-born population - Costa Rica (%)
Place of birth for the foreign-born population - El Salvador (%)
Place of birth for the foreign-born population - Guatemala (%)
Place of birth for the foreign-born population - Honduras (%)
Place of birth for the foreign-born population - Mexico (%)
Place of birth for the foreign-born population - Nicaragua (%)
Place of birth for the foreign-born population - Panama (%)
Place of birth for the foreign-born population - Other Central America (%)
Place of birth for the foreign-born population - Argentina (%)
Place of birth for the foreign-born population - Bolivia (%)
Place of birth for the foreign-born population - Brazil (%)
Place of birth for the foreign-born population - Chile (%)
Place of birth for the foreign-born population - Colombia (%)
Place of birth for the foreign-born population - Ecuador (%)
Place of birth for the foreign-born population - Guyana (%)
Place of birth for the foreign-born population - Peru (%)
Place of birth for the foreign-born population - Uruguay (%)
Place of birth for the foreign-born population - Venezuela (%)
Place of birth for the foreign-born population - Other South America (%)
Place of birth for the foreign-born population - Canada (%)
Place of birth for the foreign-born population - Other Northern America (%)
Place of birth for the foreign-born population - Other (%)
Latest news about races in Ottumwa, IA collected exclusively by city-data.com from local newspapers, TV, and radio stations
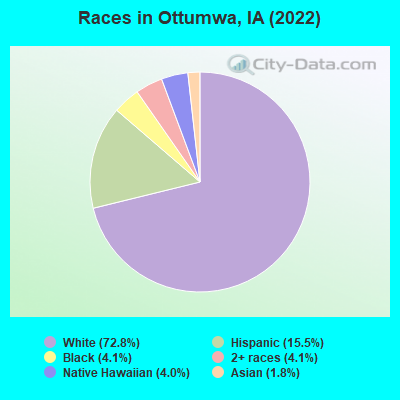
According to 2022 data, the most numerous races in Ottumwa, IA are White alone (18,532 residents), Hispanic (3,949 residents), and Black alone (1,043 residents). 84.2% of Ottumwa residents speak English at home. 11.4% of Ottumwa, IA residents are foreign-born (5.1% born in Latin America, 2.4% born in Africa, 2.1% born in Asia, 1.1% born in Oceania), which is 56.1% greater than the foreign-born rate of 5.0% across the entire state of Iowa.
Race distribution in Ottumwa
2000 2022
2,710,344 92.6% White alone 82,473 2.8% Hispanic 60,744 2.1% Black alone 36,345 1.2% Asian alone 25,472 0.9% Two or more races 7,955 0.3% American Indian alone 2,103 0.07% Other race alone 888 0.03% Native Hawaiian and Other
2,650,110 82.8% White alone 218,024 6.8% Hispanic 119,004 3.7% Black alone 115,286 3.6% Two or more races 74,892 2.3% Asian alone 9,260 0.3% Other race alone 8,595 0.3% Native Hawaiian and Other 5,346 0.2% American Indian alone
Income and house value in Ottumwa Median household income in 2022 $51,854 White non-Hispanic householders$29,745 Black householders$50,037 Native Hawaiian and other Pacific Islander householders$108,901 Some other race householders$93,571 Hispanic or Latino race householdersMedian 2022 house value $96,776 White Non-Hispanic householders$102,850 Black or African American householders$65,799 American Indian or Alaska Native householders $131,599 Asian householders$92,524 Some other race householders$131,599 Two or more races householders$123,096 Hispanic or Latino householders
Median age by race in Ottumwa
40.1 Median age for White residents38.3 42.3 28.6 Median age for Black or African American residents27.8 30.5 21.7 Median age for American Indian / Alaska Native residents21.4 41.7 37.3 Median age for Asian residents37.4 37.0 31.4 Median age for Native Hawaiian / Pacific Islander residents21.3 31.0 30.9 Median age for Other race residents27.1 36.1 30.0 Median age for Two or more races residents17.3 33.8 42.9 Median age for White alone residents41.1 44.2 26.0 Median age for Hispanic or Latino residents25.9 25.9
Owner/renter occupied households by race in Ottumwa
House owners and renters - White residents 5,688 62.5% Owner occupied3,410 37.5% Renter occupiedHouse owners and renters - Black or African American residents 50 12.9% Owner occupied337 87.1% Renter occupiedHouse owners and renters - American Indian / Alaska Native residents 41 100.0% Owner occupiedHouse owners and renters - Asian residents 71 35.8% Owner occupied126 64.2% Renter occupiedHouse owners and renters - Native Hawaiian / Pacific Islander residents 116 100.0% Renter occupiedHouse owners and renters - Other race residents 274 86.8% Owner occupied42 13.2% Renter occupiedHouse owners and renters - Two or more races residents 154 54.2% Owner occupied130 45.8% Renter occupiedHouse owners and renters - White alone residents 5,314 61.1% Owner occupied3,383 38.9% Renter occupiedHouse owners and renters - Hispanic or Latino residents 838 85.3% Owner occupied145 14.7% Renter occupied
Language usage in Ottumwa
English speakers - Total 84.2% of residents of Ottumwa speak English at home.
10.0% of residents speak Spanish at home 1,258 52.8% Speak English very well1,125 47.2% Speak English less than very well6.0% of residents speak other language at home 696 48.5% Speak English very well738 51.5% Speak English less than very well
English speakers - Born in the United States 83.5% of residents of Ottumwa speak English at home.
12.1% of residents speak Spanish at home 398 74.4% Speak English very well137 25.6% Speak English less than very well4.4% of residents speak other language at home 54 27.7% Speak English very well141 72.3% Speak English less than very well
English speakers - Native, born elsewhere 85.2% of residents of Ottumwa speak English at home.
16.0% of residents speak Spanish at home 8 61.5% Speak English very well5 38.5% Speak English less than very well
English speakers - Foreign-born 16.3% of residents of Ottumwa speak English at home.
45.7% of residents speak Spanish at home 413 30.1% Speak English very well957 69.9% Speak English less than very well38.8% of residents speak other language at home 638 54.9% Speak English very well524 45.1% Speak English less than very well
White (Caucasian) - Speak only English Native:
96.3% (17,822)Foreign-born:
11.7% (54)
White (Caucasian) - Speak another language Native:
3.3% (615)Foreign-born:
84.4% (389)
Black or African American - Speak only English Native:
81.2% (290)Foreign-born:
26.8% (167)
Black or African American - Speak another language Native:
18.6% (66)Foreign-born:
66.8% (417)
American Indian / Alaska Native - Speak another language Native:
74.7% (9)Foreign-born:
93.5% (127)
Asian - Speak only English Native:
100.0% (64)Foreign-born:
28.0% (118)
Native Hawaiian / Pacific Islander - Speak only English Native:
27.7% (78)Foreign-born:
7.8% (54)
Native Hawaiian / Pacific Islander - Speak another language Native:
53.9% (151)Foreign-born:
75.3% (514)
Other race - Speak only English Native:
35.9% (148)Foreign-born:
0.1% (1)
Other race - Speak another language Native:
59.8% (247)Foreign-born:
100.0% (841)
Two or more races - Speak only English Native:
88.2% (1,250)Foreign-born:
16.3% (59)
Two or more races - Speak another language Native:
10.1% (144)Foreign-born:
84.1% (303)
White alone - Speak only English Native:
99.3% (17,224)Foreign-born:
20.8% (38)
White alone - Speak another language Native:
0.7% (122)Foreign-born:
79.3% (144)
Hispanic or Latino - Speak only English Native:
55.1% (1,213)Foreign-born:
3.7% (51)
Hispanic or Latino - Speak another language Native:
44.3% (974)Foreign-born:
96.9% (1,329)
Foreign-born residents in Ottumwa 2,897 residents are foreign born (5.1% Latin America , 2.4% Africa , 2.1% Asia , 1.1% Oceania ).
Marital status for residents in Ottumwa Marital status - White (Caucasian) population 15 years and over
Males 38.8% Never married42.5% Now married2.0% Separated4.2% Widowed12.4% DivorcedFemales 28.8% Never married41.8% Now married1.5% Separated10.9% Widowed16.9% DivorcedWomen who gave birth in the past 12 months Now married:
52.9% (167)Unmarried:
47.1% (148)
Women who did not give birth in the past 12 months Now married:
35.7% (1,490)Unmarried:
64.3% (2,687)
Marital status - Black or African American population 15 years and over
Males 53.2% Never married42.5% Now married0.0% Separated0.0% Widowed4.3% DivorcedFemales 46.0% Never married46.8% Now married0.0% Separated0.0% Widowed7.2% DivorcedWomen who gave birth in the past 12 months Now married:
100.0% (6)Unmarried:
0.0% (0)
Women who did not give birth in the past 12 months Now married:
49.2% (115)Unmarried:
50.8% (119)
Marital status - American Indian / Alaska Native population 15 years and over
Males 58.5% Never married41.5% Now married0.0% Separated0.0% Widowed0.0% DivorcedFemales 39.1% Never married30.4% Now married0.0% Separated0.0% Widowed30.4% DivorcedWomen who did not give birth in the past 12 months Now married:
43.8% (7)Unmarried:
56.2% (9)
Marital status - Asian population 15 years and over
Males 58.5% Never married41.5% Now married0.0% Separated0.0% Widowed0.0% DivorcedFemales 49.8% Never married43.7% Now married0.0% Separated6.5% Widowed0.0% DivorcedWomen who did not give birth in the past 12 months Now married:
43.2% (99)Unmarried:
56.8% (130)
Marital status - Native Hawaiian / Pacific Islander population 15 years and over
Males 81.5% Never married18.5% Now married0.0% Separated0.0% Widowed0.0% DivorcedFemales 54.8% Never married36.5% Now married7.9% Separated0.0% Widowed0.8% DivorcedWomen who gave birth in the past 12 months Now married:
66.7% (80)Unmarried:
33.3% (40)
Women who did not give birth in the past 12 months Now married:
17.5% (17)Unmarried:
82.5% (81)
Marital status - Other race population 15 years and over
Males 29.4% Never married64.9% Now married0.0% Separated0.0% Widowed5.7% DivorcedFemales 18.6% Never married71.7% Now married5.9% Separated0.0% Widowed3.7% DivorcedWomen who gave birth in the past 12 months Now married:
100.0% (49)Unmarried:
0.0% (0)
Women who did not give birth in the past 12 months Now married:
66.2% (183)Unmarried:
33.8% (93)
Marital status - Two or more races population 15 years and over
Males 66.1% Never married33.9% Now married0.0% Separated0.0% Widowed0.0% DivorcedFemales 35.1% Never married31.2% Now married0.0% Separated7.3% Widowed26.4% DivorcedWomen who gave birth in the past 12 months Now married:
0.0% (0)Unmarried:
100.0% (31)
Women who did not give birth in the past 12 months Now married:
39.9% (169)Unmarried:
60.1% (254)
Marital status - White alone, not Hispanic / Latino population 15 years and over
Males 37.9% Never married42.6% Now married1.8% Separated4.6% Widowed13.1% DivorcedFemales 28.1% Never married42.1% Now married1.3% Separated11.2% Widowed17.3% DivorcedWomen who gave birth in the past 12 months Now married:
55.9% (159)Unmarried:
44.1% (126)
Women who did not give birth in the past 12 months Now married:
34.6% (1,316)Unmarried:
65.4% (2,485)
Marital status - Hispanic or Latino population 15 years and over
Males 44.6% Never married48.8% Now married2.0% Separated0.0% Widowed4.7% DivorcedFemales 29.4% Never married44.7% Now married3.5% Separated3.5% Widowed18.9% DivorcedWomen who gave birth in the past 12 months Now married:
51.1% (53)Unmarried:
48.9% (50)
Women who did not give birth in the past 12 months Now married:
53.6% (437)Unmarried:
46.4% (378)
Ancestries in Ottumwa
2,070 16.0% English1,755 13.5% American1,607 12.4% German612 4.7% Irish322 2.5% African280 2.2% Dutch266 2.1% Swedish186 1.4% Scottish174 1.3% Sudanese101 0.8% Italian87 0.7% European77 0.6% Northern European75 0.6% Norwegian71 0.5% Greek55 0.4% British55 0.4% Macedonian51 0.4% Moroccan48 0.4% Scotch-Irish36 0.3% Haitian29 0.2% French24 0.2% Belgian23 0.2% Czech20 0.2% Jamaican15 0.1% French Canadian9 0.07% Slovak8 0.06% Eastern European8 0.06% Russian6 0.05% Danish4 0.03% Slavic4 0.03% Welsh3 0.02% Pennsylvania German1 0.01% Egyptian
Geographical mobility in Ottumwa Same house 1 year ago 16,979 85.3% White (Caucasian)845 77.5% Black or African American104 100.0% American Indian / Alaska Native455 91.5% Asian558 100.0% Native Hawaiian / Pacific Islander994 79.9% Other race1,588 78.7% Two or more races15,709 85.8% White alone, not Hispanic / Latino3,134 82.2% Hispanic or LatinoMoved within same county 1,784 9.0% White / Caucasian85 7.8% Black or African American189 15.2% Other race329 16.3% Two or more races1,562 8.5% White alone, not Hispanic / Latino506 13.3% Hispanic or LatinoMoved within same state 692 3.5% White / Caucasian230 21.1% Black or African American24 1.2% Two or more races687 3.8% White alone, not Hispanic / Latino16 0.4% Hispanic or LatinoMoved from different state 195 1.0% White / Caucasian6 0.5% Black or African American36 7.3% Asian25 1.2% Two or more races200 1.1% White alone, not Hispanic / LatinoMoved from abroad 99 0.5% White14 1.1% Other race21 1.0% Two or more races60 0.3% White alone, not Hispanic / Latino197 5.2% Hispanic or Latino
Children Nativity (place of birth) in Ottumwa
Children under 6 years - Living with two parents Both parents native 708 99.9% Native0 0.1% Foreign-bornBoth parents foreign-born 194 92.6% Native16 7.4% Foreign-bornOne native, one foreign-born parent 72 100.0% NativeChildren under 6 years - Living with one parent Native parent 762 100.0% NativeForeign-born parent 130 100.0% NativeChildren 6 to 17 years - Living with two parents Both parents native 1,051 100.0% NativeBoth parents foreign-born 256 72.4% Native97 27.6% Foreign-bornOne native, one foreign-born parent 338 100.0% NativeChildren 6 to 17 years - Living with one parent Native parent 1,585 100.0% NativeForeign-born parent 188 60.3% Native124 39.7% Foreign-born
Grandparents responsible for own grandchildren in Ottumwa
Grandparents (30 to 59 years) White / Caucasian 107 65.9% Responsible for grandchildren56 34.1% Not responsible for grandchildrenBlack or African American 23 100.0% Not responsible for grandchildrenWhite alone, not Hispanic / Latino 89 58.3% Responsible for grandchildren64 41.7% Not responsible for grandchildrenHispanic or Latino 22 100.0% Responsible for grandchildrenGrandparents (60 years and over) White / Caucasian 214 67.1% Responsible for grandchildren105 32.9% Not responsible for grandchildrenWhite alone, not Hispanic / Latino 200 64.8% Responsible for grandchildren109 35.2% Not responsible for grandchildrenHispanic or Latino 7 88.1% Responsible for grandchildren1 11.9% Not responsible for grandchildren