Races in Ottawa, Illinois (IL) Detailed Stats
Data:
Races - White alone (%)
Races - White alone (% change since 2000)
Races - Black alone (%)
Races - Black alone (% change since 2000)
Races - American Indian alone (%)
Races - American Indian alone (% change since 2000)
Races - Asian alone (%)
Races - Asian alone (% change since 2000)
Races - Hispanic (%)
Races - Hispanic (% change since 2000)
Races - Native Hawaiian and Other Pacific Islander alone (%)
Races - Native Hawaiian and Other Pacific Islander alone (% change since 2000)
Races - Two or more races(%)
Races - Two or more races(% change since 2000)
Races - Other race alone (%)
Races - Other race alone (% change since 2000)
Racial diversity
Place of birth - Born in state of residence (%)
Place of birth - Born in state of residence (%) - White
Place of birth - Born in state of residence (%) - Black or African American
Place of birth - Born in state of residence (%) - Asian
Place of birth - Born in state of residence (%) - Hispanic or Latino
Place of birth - Born in state of residence (%) - American Indian and Alaska Native
Place of birth - Born in state of residence (%) - Multirace
Place of birth - Born in state of residence (%) - Other Race
Place of birth - Born in other state (%)
Place of birth - Born in other state (%) - White
Place of birth - Born in other state (%) - Black or African American
Place of birth - Born in other state (%) - Asian
Place of birth - Born in other state (%) - Hispanic or Latino
Place of birth - Born in other state (%) - American Indian and Alaska Native
Place of birth - Born in other state (%) - Multirace
Place of birth - Born in other state (%) - Other Race
Place of birth - Native, outside of US (%)
Place of birth - Native, outside of US (%) - White
Place of birth - Native, outside of US (%) - Black or African American
Place of birth - Native, outside of US (%) - Asian
Place of birth - Native, outside of US (%) - Hispanic or Latino
Place of birth - Native, outside of US (%) - American Indian and Alaska Native
Place of birth - Native, outside of US (%) - Multirace
Place of birth - Native, outside of US (%) - Other Race
Place of birth - Foreign born (%)
Place of birth - Foreign born (%) - White
Place of birth - Foreign born (%) - Black or African American
Place of birth - Foreign born (%) - Asian
Place of birth - Foreign born (%) - Hispanic or Latino
Place of birth - Foreign born (%) - American Indian and Alaska Native
Place of birth - Foreign born (%) - Multirace
Place of birth - Foreign born (%) - Other Race
Residents speaking English at home (%)
Residents speaking English at home - Born in the United States (%)
Residents speaking English at home - Native, born elsewhere (%)
Residents speaking English at home - Foreign born (%)
Residents speaking Spanish at home (%)
Residents speaking Spanish at home - Born in the United States (%)
Residents speaking Spanish at home - Native, born elsewhere (%)
Residents speaking Spanish at home - Foreign born (%)
Residents speaking other language at home (%)
Residents speaking other language at home - Born in the United States (%)
Residents speaking other language at home - Native, born elsewhere (%)
Residents speaking other language at home - Foreign born (%)
Marital status - Never married (%)
Marital status - Now married (%)
Marital status - Separated (%)
Marital status - Widowed (%)
Marital status - Divorced (%)
Ancestries Reported - Arab (%)
Ancestries Reported - Czech (%)
Ancestries Reported - Danish (%)
Ancestries Reported - Dutch (%)
Ancestries Reported - English (%)
Ancestries Reported - French (%)
Ancestries Reported - French Canadian (%)
Ancestries Reported - German (%)
Ancestries Reported - Greek (%)
Ancestries Reported - Hungarian (%)
Ancestries Reported - Irish (%)
Ancestries Reported - Italian (%)
Ancestries Reported - Lithuanian (%)
Ancestries Reported - Norwegian (%)
Ancestries Reported - Polish (%)
Ancestries Reported - Portuguese (%)
Ancestries Reported - Russian (%)
Ancestries Reported - Scotch-Irish (%)
Ancestries Reported - Scottish (%)
Ancestries Reported - Slovak (%)
Ancestries Reported - Subsaharan African (%)
Ancestries Reported - Swedish (%)
Ancestries Reported - Swiss (%)
Ancestries Reported - Ukrainian (%)
Ancestries Reported - United States (%)
Ancestries Reported - Welsh (%)
Ancestries Reported - West Indian (%)
Ancestries Reported - Other (%)
Geographical mobility - Same house 1 year ago (%)
Geographical mobility - Same house 1 year ago (%) - White
Geographical mobility - Same house 1 year ago (%) - Black or African American
Geographical mobility - Same house 1 year ago (%) - Asian
Geographical mobility - Same house 1 year ago (%) - Hispanic or Latino
Geographical mobility - Same house 1 year ago (%) - American Indian and Alaska Native
Geographical mobility - Same house 1 year ago (%) - Multirace
Geographical mobility - Same house 1 year ago (%) - Other Race
Geographical mobility - Moved within same county (%)
Geographical mobility - Moved within same county (%) - White
Geographical mobility - Moved within same county (%) - Black or African American
Geographical mobility - Moved within same county (%) - Asian
Geographical mobility - Moved within same county (%) - Hispanic or Latino
Geographical mobility - Moved within same county (%) - American Indian and Alaska Native
Geographical mobility - Moved within same county (%) - Multirace
Geographical mobility - Moved within same county (%) - Other Race
Geographical mobility - Moved from different county within same state (%)
Geographical mobility - Moved from different county within same state (%) - White
Geographical mobility - Moved from different county within same state (%) - Black or African American
Geographical mobility - Moved from different county within same state (%) - Asian
Geographical mobility - Moved from different county within same state (%) - Hispanic or Latino
Geographical mobility - Moved from different county within same state (%) - American Indian and Alaska Native
Geographical mobility - Moved from different county within same state (%) - Multirace
Geographical mobility - Moved from different county within same state (%) - Other Race
Geographical mobility - Moved from different state (%)
Geographical mobility - Moved from different state (%) - White
Geographical mobility - Moved from different state (%) - Black or African American
Geographical mobility - Moved from different state (%) - Asian
Geographical mobility - Moved from different state (%) - Hispanic or Latino
Geographical mobility - Moved from different state (%) - American Indian and Alaska Native
Geographical mobility - Moved from different state (%) - Multirace
Geographical mobility - Moved from different state (%) - Other Race
Geographical mobility - Moved from abroad (%)
Geographical mobility - Moved from abroad (%) - White
Geographical mobility - Moved from abroad (%) - Black or African American
Geographical mobility - Moved from abroad (%) - Asian
Geographical mobility - Moved from abroad (%) - Hispanic or Latino
Geographical mobility - Moved from abroad (%) - American Indian and Alaska Native
Geographical mobility - Moved from abroad (%) - Multirace
Geographical mobility - Moved from abroad (%) - Other Race
Place of birth for the foreign-born population - Ireland (%)
Place of birth for the foreign-born population - Denmark (%)
Place of birth for the foreign-born population - Norway (%)
Place of birth for the foreign-born population - Sweden (%)
Place of birth for the foreign-born population - United Kingdom (%)
Place of birth for the foreign-born population - England (%)
Place of birth for the foreign-born population - Scotland (%)
Place of birth for the foreign-born population - Other Northern Europe (%)
Place of birth for the foreign-born population - Austria (%)
Place of birth for the foreign-born population - Belgium (%)
Place of birth for the foreign-born population - France (%)
Place of birth for the foreign-born population - Germany (%)
Place of birth for the foreign-born population - Netherlands (%)
Place of birth for the foreign-born population - Switzerland (%)
Place of birth for the foreign-born population - Other Western Europe (%)
Place of birth for the foreign-born population - Greece (%)
Place of birth for the foreign-born population - Italy (%)
Place of birth for the foreign-born population - Portugal (%)
Place of birth for the foreign-born population - Spain (%)
Place of birth for the foreign-born population - Other Southern Europe (%)
Place of birth for the foreign-born population - Albania (%)
Place of birth for the foreign-born population - Belarus (%)
Place of birth for the foreign-born population - Bosnia and Herzegovina (%)
Place of birth for the foreign-born population - Bulgaria (%)
Place of birth for the foreign-born population - Croatia (%)
Place of birth for the foreign-born population - Czechoslovakia (%)
Place of birth for the foreign-born population - Hungary (%)
Place of birth for the foreign-born population - Latvia (%)
Place of birth for the foreign-born population - Lithuania (%)
Place of birth for the foreign-born population - North Macedonia (Macedonia) (%)
Place of birth for the foreign-born population - Moldova (%)
Place of birth for the foreign-born population - Poland (%)
Place of birth for the foreign-born population - Romania (%)
Place of birth for the foreign-born population - Russia (%)
Place of birth for the foreign-born population - Serbia (%)
Place of birth for the foreign-born population - Ukraine (%)
Place of birth for the foreign-born population - Other Eastern Europe (%)
Place of birth for the foreign-born population - China (%)
Place of birth for the foreign-born population - Hong Kong (%)
Place of birth for the foreign-born population - Taiwan (%)
Place of birth for the foreign-born population - Japan (%)
Place of birth for the foreign-born population - Korea (%)
Place of birth for the foreign-born population - Other Eastern Asia (%)
Place of birth for the foreign-born population - Afghanistan (%)
Place of birth for the foreign-born population - Bangladesh (%)
Place of birth for the foreign-born population - India (%)
Place of birth for the foreign-born population - Iran (%)
Place of birth for the foreign-born population - Kazakhstan (%)
Place of birth for the foreign-born population - Nepal (%)
Place of birth for the foreign-born population - Pakistan (%)
Place of birth for the foreign-born population - Sri Lanka (%)
Place of birth for the foreign-born population - Uzbekistan (%)
Place of birth for the foreign-born population - Other South Central Asia (%)
Place of birth for the foreign-born population - Burma (%)
Place of birth for the foreign-born population - Cambodia (%)
Place of birth for the foreign-born population - Indonesia (%)
Place of birth for the foreign-born population - Laos (%)
Place of birth for the foreign-born population - Malaysia (%)
Place of birth for the foreign-born population - Philippines (%)
Place of birth for the foreign-born population - Singapore (%)
Place of birth for the foreign-born population - Thailand (%)
Place of birth for the foreign-born population - Vietnam (%)
Place of birth for the foreign-born population - Other South Eastern Asia (%)
Place of birth for the foreign-born population - Armenia (%)
Place of birth for the foreign-born population - Iraq (%)
Place of birth for the foreign-born population - Israel (%)
Place of birth for the foreign-born population - Jordan (%)
Place of birth for the foreign-born population - Kuwait (%)
Place of birth for the foreign-born population - Lebanon (%)
Place of birth for the foreign-born population - Saudi Arabia (%)
Place of birth for the foreign-born population - Syria (%)
Place of birth for the foreign-born population - Turkey (%)
Place of birth for the foreign-born population - Yemen (%)
Place of birth for the foreign-born population - Other Western Asia (%)
Place of birth for the foreign-born population - Eritrea (%)
Place of birth for the foreign-born population - Ethiopia (%)
Place of birth for the foreign-born population - Kenya (%)
Place of birth for the foreign-born population - Somalia (%)
Place of birth for the foreign-born population - Uganda (%)
Place of birth for the foreign-born population - Zimbabwe (%)
Place of birth for the foreign-born population - Other Eastern Africa (%)
Place of birth for the foreign-born population - Cameroon (%)
Place of birth for the foreign-born population - Congo (%)
Place of birth for the foreign-born population - Democratic Republic of Congo (Zaire) (%)
Place of birth for the foreign-born population - Other Middle Africa (%)
Place of birth for the foreign-born population - Egypt (%)
Place of birth for the foreign-born population - Morocco (%)
Place of birth for the foreign-born population - Sudan (%)
Place of birth for the foreign-born population - Other Northern Africa (%)
Place of birth for the foreign-born population - South Africa (%)
Place of birth for the foreign-born population - Other Southern Africa (%)
Place of birth for the foreign-born population - Cabo Verde (%)
Place of birth for the foreign-born population - Ghana (%)
Place of birth for the foreign-born population - Liberia (%)
Place of birth for the foreign-born population - Nigeria (%)
Place of birth for the foreign-born population - Senegal (%)
Place of birth for the foreign-born population - Sierra Leone (%)
Place of birth for the foreign-born population - Other Western Africa (%)
Place of birth for the foreign-born population - Australia (%)
Place of birth for the foreign-born population - New Zealand (%)
Place of birth for the foreign-born population - Fiji (%)
Place of birth for the foreign-born population - Micronesia (%)
Place of birth for the foreign-born population - Bahamas (%)
Place of birth for the foreign-born population - Barbados (%)
Place of birth for the foreign-born population - Cuba (%)
Place of birth for the foreign-born population - Dominica (%)
Place of birth for the foreign-born population - Dominican Republic (%)
Place of birth for the foreign-born population - Grenada (%)
Place of birth for the foreign-born population - Haiti (%)
Place of birth for the foreign-born population - Jamaica (%)
Place of birth for the foreign-born population - St. Vincent and the Grenadines (%)
Place of birth for the foreign-born population - Trinidad and Tobago (%)
Place of birth for the foreign-born population - West Indies (%)
Place of birth for the foreign-born population - Other Caribbean (%)
Place of birth for the foreign-born population - Belize (%)
Place of birth for the foreign-born population - Costa Rica (%)
Place of birth for the foreign-born population - El Salvador (%)
Place of birth for the foreign-born population - Guatemala (%)
Place of birth for the foreign-born population - Honduras (%)
Place of birth for the foreign-born population - Mexico (%)
Place of birth for the foreign-born population - Nicaragua (%)
Place of birth for the foreign-born population - Panama (%)
Place of birth for the foreign-born population - Other Central America (%)
Place of birth for the foreign-born population - Argentina (%)
Place of birth for the foreign-born population - Bolivia (%)
Place of birth for the foreign-born population - Brazil (%)
Place of birth for the foreign-born population - Chile (%)
Place of birth for the foreign-born population - Colombia (%)
Place of birth for the foreign-born population - Ecuador (%)
Place of birth for the foreign-born population - Guyana (%)
Place of birth for the foreign-born population - Peru (%)
Place of birth for the foreign-born population - Uruguay (%)
Place of birth for the foreign-born population - Venezuela (%)
Place of birth for the foreign-born population - Other South America (%)
Place of birth for the foreign-born population - Canada (%)
Place of birth for the foreign-born population - Other Northern America (%)
Place of birth for the foreign-born population - Other (%)
Latest news about races in Ottawa, IL collected exclusively by city-data.com from local newspapers, TV, and radio stations
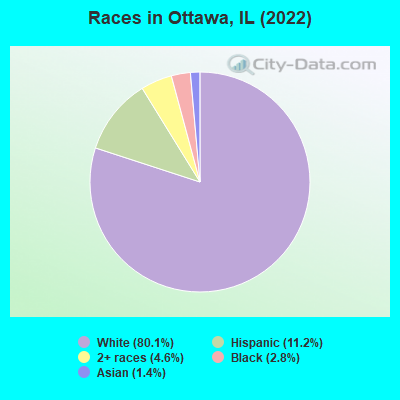
According to 2022 data, the most numerous races in Ottawa, IL are White alone (14,794 residents), Hispanic (2,065 residents), and Black alone (525 residents). 92.5% of Ottawa residents speak English at home. 3.4% of Ottawa, IL residents are foreign-born (2.0% born in Latin America, 1.1% born in Asia), which is 313.0% less than the foreign-born rate of 14.0% across the entire state of Illinois.
Race distribution in Ottawa
2000 2022
8,424,140 67.8% White alone 1,856,152 14.9% Black alone 1,530,262 12.3% Hispanic 419,916 3.4% Asian alone 153,996 1.2% Two or more races 13,479 0.1% Other race alone 18,232 0.1% American Indian alone 3,116 0.03% Native Hawaiian and Other
7,356,301 58.5% White alone 2,299,726 18.3% Hispanic 1,660,423 13.2% Black alone 747,296 5.9% Asian alone 458,599 3.6% Two or more races 45,386 0.4% Other race alone 10,405 0.08% American Indian alone 3,896 0.03% Native Hawaiian and Other
Income and house value in Ottawa Median household income in 2022 $67,001 White non-Hispanic householders$26,953 Black householders$33,848 Some other race householders$62,457 Two or more races householders$39,430 Hispanic or Latino race householdersMedian 2022 house value $149,596 White Non-Hispanic householders$97,518 Black or African American householders $202,184 Asian householders$136,151 Some other race householders$151,468 Two or more races householders$117,770 Hispanic or Latino householders
Median age by race in Ottawa
42.1 Median age for White residents40.6 43.6 33.6 Median age for Black or African American residents36.8 47.5 -672,816,727.5 Median age for American Indian / Alaska Native residents-720,238,094.5 -666,666,666.0 29.1 Median age for Asian residents39.1 37.6 -593,236,714.4 Median age for Native Hawaiian / Pacific Islander residents-666,666,666.0 -576,015,108.0 31.7 Median age for Other race residents30.8 32.9 25.4 Median age for Two or more races residents18.2 39.8 43.8 Median age for White alone residents43.3 44.1 29.1 Median age for Hispanic or Latino residents25.2 33.1
Owner/renter occupied households by race in Ottawa
House owners and renters - White residents 4,865 71.1% Owner occupied1,973 28.9% Renter occupiedHouse owners and renters - Black or African American residents 4 3.6% Owner occupied103 96.4% Renter occupiedHouse owners and renters - American Indian / Alaska Native residents 5 100.0% Renter occupiedHouse owners and renters - Asian residents 82 64.4% Owner occupied46 35.6% Renter occupiedHouse owners and renters - Other race residents 73 65.9% Owner occupied38 34.1% Renter occupiedHouse owners and renters - Two or more races residents 367 80.2% Owner occupied91 19.8% Renter occupiedHouse owners and renters - White alone residents 4,738 72.0% Owner occupied1,843 28.0% Renter occupiedHouse owners and renters - Hispanic or Latino residents 291 59.7% Owner occupied196 40.3% Renter occupied
Language usage in Ottawa
English speakers - Total 92.5% of residents of Ottawa speak English at home.
5.6% of residents speak Spanish at home 614 63.0% Speak English very well360 37.0% Speak English less than very well1.9% of residents speak other language at home 281 85.2% Speak English very well49 14.8% Speak English less than very well
All residents speak only English at home
English speakers - Native, born elsewhere 97.7% of residents of Ottawa speak English at home.
2.3% of residents speak other language at home 2 100.0% Speak English very well
English speakers - Foreign-born 14.1% of residents of Ottawa speak English at home.
62.5% of residents speak Spanish at home 261 54.4% Speak English very well219 45.6% Speak English less than very well25.5% of residents speak other language at home 146 74.5% Speak English very well50 25.5% Speak English less than very well
White (Caucasian) - Speak only English Native:
97.2% (14,250)Foreign-born:
20.4% (54)
White (Caucasian) - Speak another language Native:
2.2% (326)Foreign-born:
78.1% (208)
Black or African American - Speak only English Native:
99.9% (556)Foreign-born:
10.1% (1)
Black or African American - Speak another language Native:
0.2% (1)Foreign-born:
86.5% (9)
Asian - Speak only English Native:
70.7% (45)Foreign-born:
16.0% (33)
Asian - Speak another language Native:
28.8% (18)Foreign-born:
83.2% (170)
Other race - Speak another language Native:
17.2% (53)Foreign-born:
97.6% (218)
White alone - Speak only English Native:
99.4% (13,808)Foreign-born:
46.0% (30)
White alone - Speak another language Native:
0.6% (87)Foreign-born:
21.8% (14)
Hispanic or Latino - Speak only English Native:
63.5% (845)Foreign-born:
5.3% (26)
Hispanic or Latino - Speak another language Native:
37.0% (492)Foreign-born:
94.5% (464)
Foreign-born residents in Ottawa 626 residents are foreign born (2.0% Latin America , 1.1% Asia ).
This city:
3.4%Illinois:
14.1%
Marital status for residents in Ottawa Marital status - White (Caucasian) population 15 years and over
Males 32.5% Never married47.9% Now married4.2% Separated1.9% Widowed13.4% DivorcedFemales 28.3% Never married43.5% Now married0.5% Separated13.0% Widowed14.6% DivorcedWomen who gave birth in the past 12 months Now married:
60.4% (164)Unmarried:
39.6% (107)
Women who did not give birth in the past 12 months Now married:
39.2% (1,118)Unmarried:
60.8% (1,736)
Marital status - Black or African American population 15 years and over
Males 74.8% Never married14.8% Now married0.0% Separated7.1% Widowed3.3% DivorcedFemales 52.3% Never married4.6% Now married4.6% Separated0.0% Widowed38.5% DivorcedWomen who did not give birth in the past 12 months Now married:
0.0% (0)Unmarried:
100.0% (67)
Marital status - Asian population 15 years and over
Males 62.2% Never married37.8% Now married0.0% Separated0.0% Widowed0.0% DivorcedFemales 16.5% Never married46.3% Now married0.0% Separated37.2% Widowed0.0% DivorcedWomen who gave birth in the past 12 months Now married:
100.0% (12)Unmarried:
0.0% (0)
Women who did not give birth in the past 12 months Now married:
3.0% (2)Unmarried:
97.0% (66)
Marital status - Other race population 15 years and over
Males 64.9% Never married35.1% Now married0.0% Separated0.0% Widowed0.0% DivorcedFemales 53.5% Never married30.2% Now married0.0% Separated8.4% Widowed8.0% DivorcedWomen who did not give birth in the past 12 months Now married:
26.5% (62)Unmarried:
73.5% (171)
Marital status - Two or more races population 15 years and over
Males 65.0% Never married35.0% Now married0.0% Separated0.0% Widowed0.0% DivorcedFemales 43.5% Never married22.1% Now married6.9% Separated18.9% Widowed8.5% DivorcedWomen who gave birth in the past 12 months Now married:
8.3% (6)Unmarried:
91.7% (70)
Women who did not give birth in the past 12 months Now married:
37.2% (61)Unmarried:
62.8% (103)
Marital status - White alone, not Hispanic / Latino population 15 years and over
Males 31.5% Never married48.1% Now married4.3% Separated2.0% Widowed14.1% DivorcedFemales 27.8% Never married42.9% Now married0.6% Separated13.2% Widowed15.5% DivorcedWomen who gave birth in the past 12 months Now married:
58.1% (152)Unmarried:
41.9% (109)
Women who did not give birth in the past 12 months Now married:
38.4% (1,037)Unmarried:
61.6% (1,662)
Marital status - Hispanic or Latino population 15 years and over
Males 53.3% Never married42.7% Now married2.2% Separated0.0% Widowed1.7% DivorcedFemales 43.1% Never married45.7% Now married0.0% Separated8.4% Widowed2.9% DivorcedWomen who gave birth in the past 12 months Now married:
37.3% (22)Unmarried:
62.7% (38)
Women who did not give birth in the past 12 months Now married:
41.2% (187)Unmarried:
58.8% (267)
Ancestries in Ottawa
925 15.4% German868 14.4% Irish683 11.3% American534 8.9% English266 4.4% Italian175 2.9% Norwegian169 2.8% Polish147 2.4% European58 1.0% Slovak50 0.8% Scottish43 0.7% Scotch-Irish39 0.6% Scandinavian35 0.6% French32 0.5% Greek25 0.4% Austrian24 0.4% African21 0.3% Dutch20 0.3% Romanian18 0.3% Czech16 0.3% Eastern European14 0.2% Northern European14 0.2% Haitian10 0.2% Iranian9 0.1% British8 0.1% Hungarian7 0.1% Canadian7 0.1% Danish7 0.1% Swedish7 0.1% Swiss7 0.1% Welsh4 0.07% Yugoslavian2 0.03% Macedonian
Geographical mobility in Ottawa Same house 1 year ago 13,468 86.4% White (Caucasian)411 72.9% Black or African American5 99.7% American Indian / Alaska Native152 56.9% Asian3 100.0% Native Hawaiian / Pacific Islander489 95.1% Other race827 79.4% Two or more races12,468 85.9% White alone, not Hispanic / Latino1,771 87.7% Hispanic or LatinoMoved within same county 1,132 7.3% White / Caucasian2 0.3% Black or African American68 25.3% Asian23 4.5% Other race59 5.7% Two or more races1,121 7.7% White alone, not Hispanic / Latino33 1.6% Hispanic or LatinoMoved within same state 871 5.6% White / Caucasian166 29.5% Black or African American35 12.9% Asian134 12.9% Two or more races878 6.0% White alone, not Hispanic / Latino123 6.1% Hispanic or LatinoMoved from different state 162 1.0% White / Caucasian10 1.8% Black or African American18 6.5% Asian1 0.3% Other race5 0.5% Two or more races112 0.8% White alone, not Hispanic / Latino71 3.5% Hispanic or LatinoMoved from abroad 3 0.0% White4 0.0% White alone, not Hispanic / Latino
Children Nativity (place of birth) in Ottawa
Children under 6 years - Living with two parents Both parents native 668 100.0% NativeOne native, one foreign-born parent 16 100.0% NativeChildren under 6 years - Living with one parent Native parent 593 100.0% NativeForeign-born parent 16 100.0% NativeChildren 6 to 17 years - Living with two parents Both parents native 1,183 100.0% NativeBoth parents foreign-born 5 100.0% Foreign-bornOne native, one foreign-born parent 81 59.1% Native56 40.9% Foreign-bornChildren 6 to 17 years - Living with one parent Native parent 1,278 100.0% NativeForeign-born parent 60 49.8% Native60 50.2% Foreign-born
Grandparents responsible for own grandchildren in Ottawa
Grandparents (30 to 59 years) White / Caucasian 59 43.7% Responsible for grandchildren76 56.3% Not responsible for grandchildrenOther race 20 100.0% Not responsible for grandchildrenTwo or more races 44 82.2% Responsible for grandchildren9 17.8% Not responsible for grandchildrenWhite alone, not Hispanic / Latino 59 45.5% Responsible for grandchildren71 54.5% Not responsible for grandchildrenHispanic or Latino 29 51.7% Responsible for grandchildren27 48.3% Not responsible for grandchildrenGrandparents (60 years and over) White / Caucasian 139 89.2% Responsible for grandchildren17 10.8% Not responsible for grandchildrenOther race 17 100.0% Not responsible for grandchildrenWhite alone, not Hispanic / Latino 139 89.0% Responsible for grandchildren17 11.0% Not responsible for grandchildrenHispanic or Latino 18 100.0% Not responsible for grandchildren