Races in Orange City, Florida (FL) Detailed Stats
Data:
Races - White alone (%)
Races - White alone (% change since 2000)
Races - Black alone (%)
Races - Black alone (% change since 2000)
Races - American Indian alone (%)
Races - American Indian alone (% change since 2000)
Races - Asian alone (%)
Races - Asian alone (% change since 2000)
Races - Hispanic (%)
Races - Hispanic (% change since 2000)
Races - Native Hawaiian and Other Pacific Islander alone (%)
Races - Native Hawaiian and Other Pacific Islander alone (% change since 2000)
Races - Two or more races(%)
Races - Two or more races(% change since 2000)
Races - Other race alone (%)
Races - Other race alone (% change since 2000)
Racial diversity
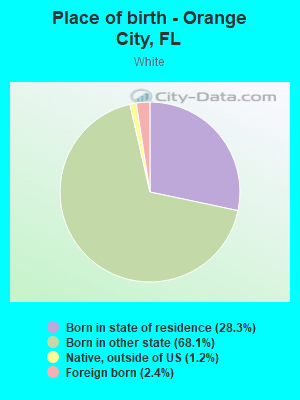
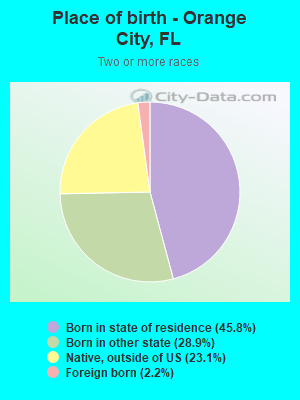
Place of birth - Born in state of residence (%)
Place of birth - Born in state of residence (%) - White
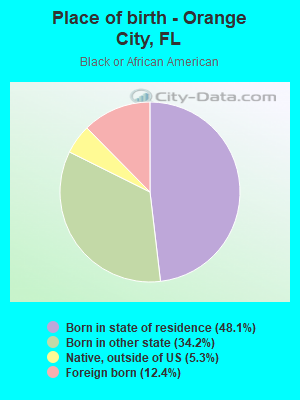
Place of birth - Born in state of residence (%) - Black or African American
Place of birth - Born in state of residence (%) - Asian
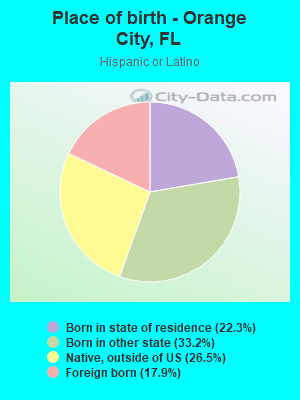
Place of birth - Born in state of residence (%) - Hispanic or Latino
Place of birth - Born in state of residence (%) - American Indian and Alaska Native
Place of birth - Born in state of residence (%) - Multirace
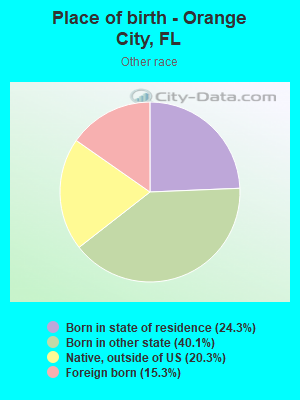
Place of birth - Born in state of residence (%) - Other Race
Place of birth - Born in other state (%)
Place of birth - Born in other state (%) - White
Place of birth - Born in other state (%) - Black or African American
Place of birth - Born in other state (%) - Asian
Place of birth - Born in other state (%) - Hispanic or Latino
Place of birth - Born in other state (%) - American Indian and Alaska Native
Place of birth - Born in other state (%) - Multirace
Place of birth - Born in other state (%) - Other Race
Place of birth - Native, outside of US (%)
Place of birth - Native, outside of US (%) - White
Place of birth - Native, outside of US (%) - Black or African American
Place of birth - Native, outside of US (%) - Asian
Place of birth - Native, outside of US (%) - Hispanic or Latino
Place of birth - Native, outside of US (%) - American Indian and Alaska Native
Place of birth - Native, outside of US (%) - Multirace
Place of birth - Native, outside of US (%) - Other Race
Place of birth - Foreign born (%)
Place of birth - Foreign born (%) - White
Place of birth - Foreign born (%) - Black or African American
Place of birth - Foreign born (%) - Asian
Place of birth - Foreign born (%) - Hispanic or Latino
Place of birth - Foreign born (%) - American Indian and Alaska Native
Place of birth - Foreign born (%) - Multirace
Place of birth - Foreign born (%) - Other Race
Residents speaking English at home (%)
Residents speaking English at home - Born in the United States (%)
Residents speaking English at home - Native, born elsewhere (%)
Residents speaking English at home - Foreign born (%)
Residents speaking Spanish at home (%)
Residents speaking Spanish at home - Born in the United States (%)
Residents speaking Spanish at home - Native, born elsewhere (%)
Residents speaking Spanish at home - Foreign born (%)
Residents speaking other language at home (%)
Residents speaking other language at home - Born in the United States (%)
Residents speaking other language at home - Native, born elsewhere (%)
Residents speaking other language at home - Foreign born (%)
Marital status - Never married (%)
Marital status - Now married (%)
Marital status - Separated (%)
Marital status - Widowed (%)
Marital status - Divorced (%)
Ancestries Reported - Arab (%)
Ancestries Reported - Czech (%)
Ancestries Reported - Danish (%)
Ancestries Reported - Dutch (%)
Ancestries Reported - English (%)
Ancestries Reported - French (%)
Ancestries Reported - French Canadian (%)
Ancestries Reported - German (%)
Ancestries Reported - Greek (%)
Ancestries Reported - Hungarian (%)
Ancestries Reported - Irish (%)
Ancestries Reported - Italian (%)
Ancestries Reported - Lithuanian (%)
Ancestries Reported - Norwegian (%)
Ancestries Reported - Polish (%)
Ancestries Reported - Portuguese (%)
Ancestries Reported - Russian (%)
Ancestries Reported - Scotch-Irish (%)
Ancestries Reported - Scottish (%)
Ancestries Reported - Slovak (%)
Ancestries Reported - Subsaharan African (%)
Ancestries Reported - Swedish (%)
Ancestries Reported - Swiss (%)
Ancestries Reported - Ukrainian (%)
Ancestries Reported - United States (%)
Ancestries Reported - Welsh (%)
Ancestries Reported - West Indian (%)
Ancestries Reported - Other (%)
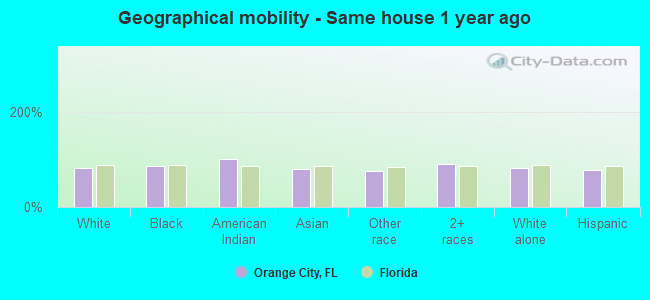
Geographical mobility - Same house 1 year ago (%)
Geographical mobility - Same house 1 year ago (%) - White
Geographical mobility - Same house 1 year ago (%) - Black or African American
Geographical mobility - Same house 1 year ago (%) - Asian
Geographical mobility - Same house 1 year ago (%) - Hispanic or Latino
Geographical mobility - Same house 1 year ago (%) - American Indian and Alaska Native
Geographical mobility - Same house 1 year ago (%) - Multirace
Geographical mobility - Same house 1 year ago (%) - Other Race
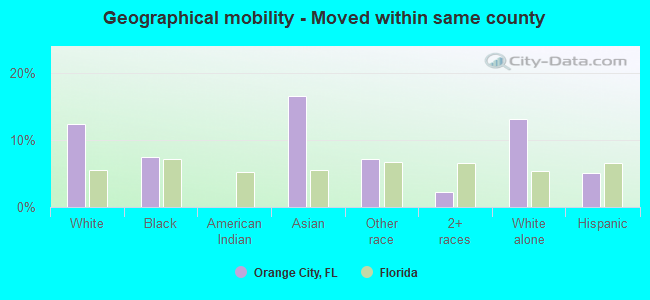
Geographical mobility - Moved within same county (%)
Geographical mobility - Moved within same county (%) - White
Geographical mobility - Moved within same county (%) - Black or African American
Geographical mobility - Moved within same county (%) - Asian
Geographical mobility - Moved within same county (%) - Hispanic or Latino
Geographical mobility - Moved within same county (%) - American Indian and Alaska Native
Geographical mobility - Moved within same county (%) - Multirace
Geographical mobility - Moved within same county (%) - Other Race
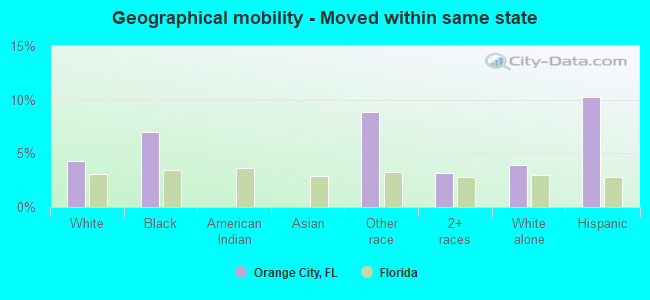
Geographical mobility - Moved from different county within same state (%)
Geographical mobility - Moved from different county within same state (%) - White
Geographical mobility - Moved from different county within same state (%) - Black or African American
Geographical mobility - Moved from different county within same state (%) - Asian
Geographical mobility - Moved from different county within same state (%) - Hispanic or Latino
Geographical mobility - Moved from different county within same state (%) - American Indian and Alaska Native
Geographical mobility - Moved from different county within same state (%) - Multirace
Geographical mobility - Moved from different county within same state (%) - Other Race
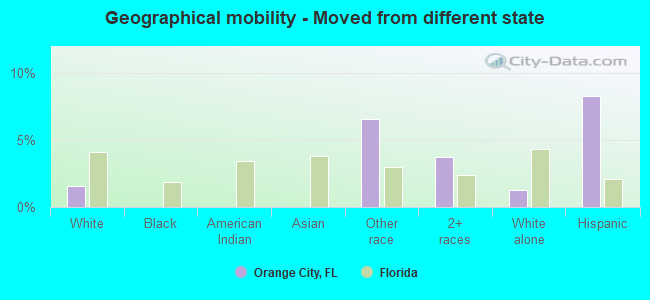
Geographical mobility - Moved from different state (%)
Geographical mobility - Moved from different state (%) - White
Geographical mobility - Moved from different state (%) - Black or African American
Geographical mobility - Moved from different state (%) - Asian
Geographical mobility - Moved from different state (%) - Hispanic or Latino
Geographical mobility - Moved from different state (%) - American Indian and Alaska Native
Geographical mobility - Moved from different state (%) - Multirace
Geographical mobility - Moved from different state (%) - Other Race
Geographical mobility - Moved from abroad (%)
Geographical mobility - Moved from abroad (%) - White
Geographical mobility - Moved from abroad (%) - Black or African American
Geographical mobility - Moved from abroad (%) - Asian
Geographical mobility - Moved from abroad (%) - Hispanic or Latino
Geographical mobility - Moved from abroad (%) - American Indian and Alaska Native
Geographical mobility - Moved from abroad (%) - Multirace
Geographical mobility - Moved from abroad (%) - Other Race
Place of birth for the foreign-born population - Ireland (%)
Place of birth for the foreign-born population - Denmark (%)
Place of birth for the foreign-born population - Norway (%)
Place of birth for the foreign-born population - Sweden (%)
Place of birth for the foreign-born population - United Kingdom (%)
Place of birth for the foreign-born population - England (%)
Place of birth for the foreign-born population - Scotland (%)
Place of birth for the foreign-born population - Other Northern Europe (%)
Place of birth for the foreign-born population - Austria (%)
Place of birth for the foreign-born population - Belgium (%)
Place of birth for the foreign-born population - France (%)
Place of birth for the foreign-born population - Germany (%)
Place of birth for the foreign-born population - Netherlands (%)
Place of birth for the foreign-born population - Switzerland (%)
Place of birth for the foreign-born population - Other Western Europe (%)
Place of birth for the foreign-born population - Greece (%)
Place of birth for the foreign-born population - Italy (%)
Place of birth for the foreign-born population - Portugal (%)
Place of birth for the foreign-born population - Spain (%)
Place of birth for the foreign-born population - Other Southern Europe (%)
Place of birth for the foreign-born population - Albania (%)
Place of birth for the foreign-born population - Belarus (%)
Place of birth for the foreign-born population - Bosnia and Herzegovina (%)
Place of birth for the foreign-born population - Bulgaria (%)
Place of birth for the foreign-born population - Croatia (%)
Place of birth for the foreign-born population - Czechoslovakia (%)
Place of birth for the foreign-born population - Hungary (%)
Place of birth for the foreign-born population - Latvia (%)
Place of birth for the foreign-born population - Lithuania (%)
Place of birth for the foreign-born population - North Macedonia (Macedonia) (%)
Place of birth for the foreign-born population - Moldova (%)
Place of birth for the foreign-born population - Poland (%)
Place of birth for the foreign-born population - Romania (%)
Place of birth for the foreign-born population - Russia (%)
Place of birth for the foreign-born population - Serbia (%)
Place of birth for the foreign-born population - Ukraine (%)
Place of birth for the foreign-born population - Other Eastern Europe (%)
Place of birth for the foreign-born population - China (%)
Place of birth for the foreign-born population - Hong Kong (%)
Place of birth for the foreign-born population - Taiwan (%)
Place of birth for the foreign-born population - Japan (%)
Place of birth for the foreign-born population - Korea (%)
Place of birth for the foreign-born population - Other Eastern Asia (%)
Place of birth for the foreign-born population - Afghanistan (%)
Place of birth for the foreign-born population - Bangladesh (%)
Place of birth for the foreign-born population - India (%)
Place of birth for the foreign-born population - Iran (%)
Place of birth for the foreign-born population - Kazakhstan (%)
Place of birth for the foreign-born population - Nepal (%)
Place of birth for the foreign-born population - Pakistan (%)
Place of birth for the foreign-born population - Sri Lanka (%)
Place of birth for the foreign-born population - Uzbekistan (%)
Place of birth for the foreign-born population - Other South Central Asia (%)
Place of birth for the foreign-born population - Burma (%)
Place of birth for the foreign-born population - Cambodia (%)
Place of birth for the foreign-born population - Indonesia (%)
Place of birth for the foreign-born population - Laos (%)
Place of birth for the foreign-born population - Malaysia (%)
Place of birth for the foreign-born population - Philippines (%)
Place of birth for the foreign-born population - Singapore (%)
Place of birth for the foreign-born population - Thailand (%)
Place of birth for the foreign-born population - Vietnam (%)
Place of birth for the foreign-born population - Other South Eastern Asia (%)
Place of birth for the foreign-born population - Armenia (%)
Place of birth for the foreign-born population - Iraq (%)
Place of birth for the foreign-born population - Israel (%)
Place of birth for the foreign-born population - Jordan (%)
Place of birth for the foreign-born population - Kuwait (%)
Place of birth for the foreign-born population - Lebanon (%)
Place of birth for the foreign-born population - Saudi Arabia (%)
Place of birth for the foreign-born population - Syria (%)
Place of birth for the foreign-born population - Turkey (%)
Place of birth for the foreign-born population - Yemen (%)
Place of birth for the foreign-born population - Other Western Asia (%)
Place of birth for the foreign-born population - Eritrea (%)
Place of birth for the foreign-born population - Ethiopia (%)
Place of birth for the foreign-born population - Kenya (%)
Place of birth for the foreign-born population - Somalia (%)
Place of birth for the foreign-born population - Uganda (%)
Place of birth for the foreign-born population - Zimbabwe (%)
Place of birth for the foreign-born population - Other Eastern Africa (%)
Place of birth for the foreign-born population - Cameroon (%)
Place of birth for the foreign-born population - Congo (%)
Place of birth for the foreign-born population - Democratic Republic of Congo (Zaire) (%)
Place of birth for the foreign-born population - Other Middle Africa (%)
Place of birth for the foreign-born population - Egypt (%)
Place of birth for the foreign-born population - Morocco (%)
Place of birth for the foreign-born population - Sudan (%)
Place of birth for the foreign-born population - Other Northern Africa (%)
Place of birth for the foreign-born population - South Africa (%)
Place of birth for the foreign-born population - Other Southern Africa (%)
Place of birth for the foreign-born population - Cabo Verde (%)
Place of birth for the foreign-born population - Ghana (%)
Place of birth for the foreign-born population - Liberia (%)
Place of birth for the foreign-born population - Nigeria (%)
Place of birth for the foreign-born population - Senegal (%)
Place of birth for the foreign-born population - Sierra Leone (%)
Place of birth for the foreign-born population - Other Western Africa (%)
Place of birth for the foreign-born population - Australia (%)
Place of birth for the foreign-born population - New Zealand (%)
Place of birth for the foreign-born population - Fiji (%)
Place of birth for the foreign-born population - Micronesia (%)
Place of birth for the foreign-born population - Bahamas (%)
Place of birth for the foreign-born population - Barbados (%)
Place of birth for the foreign-born population - Cuba (%)
Place of birth for the foreign-born population - Dominica (%)
Place of birth for the foreign-born population - Dominican Republic (%)
Place of birth for the foreign-born population - Grenada (%)
Place of birth for the foreign-born population - Haiti (%)
Place of birth for the foreign-born population - Jamaica (%)
Place of birth for the foreign-born population - St. Vincent and the Grenadines (%)
Place of birth for the foreign-born population - Trinidad and Tobago (%)
Place of birth for the foreign-born population - West Indies (%)
Place of birth for the foreign-born population - Other Caribbean (%)
Place of birth for the foreign-born population - Belize (%)
Place of birth for the foreign-born population - Costa Rica (%)
Place of birth for the foreign-born population - El Salvador (%)
Place of birth for the foreign-born population - Guatemala (%)
Place of birth for the foreign-born population - Honduras (%)
Place of birth for the foreign-born population - Mexico (%)
Place of birth for the foreign-born population - Nicaragua (%)
Place of birth for the foreign-born population - Panama (%)
Place of birth for the foreign-born population - Other Central America (%)
Place of birth for the foreign-born population - Argentina (%)
Place of birth for the foreign-born population - Bolivia (%)
Place of birth for the foreign-born population - Brazil (%)
Place of birth for the foreign-born population - Chile (%)
Place of birth for the foreign-born population - Colombia (%)
Place of birth for the foreign-born population - Ecuador (%)
Place of birth for the foreign-born population - Guyana (%)
Place of birth for the foreign-born population - Peru (%)
Place of birth for the foreign-born population - Uruguay (%)
Place of birth for the foreign-born population - Venezuela (%)
Place of birth for the foreign-born population - Other South America (%)
Place of birth for the foreign-born population - Canada (%)
Place of birth for the foreign-born population - Other Northern America (%)
Place of birth for the foreign-born population - Other (%)
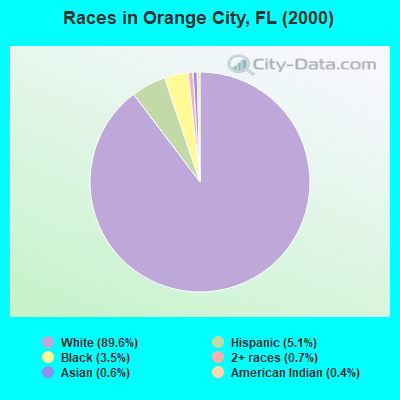
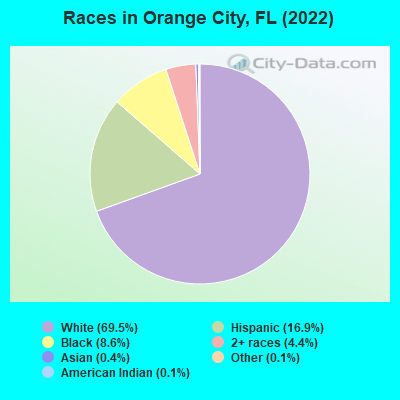
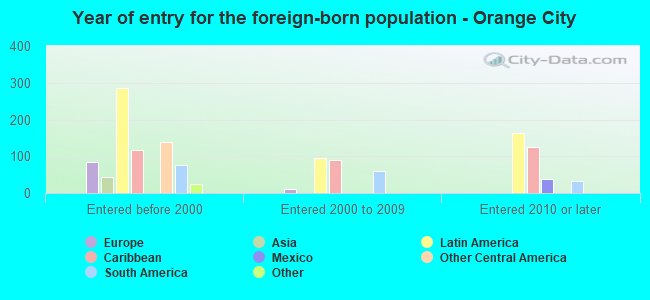
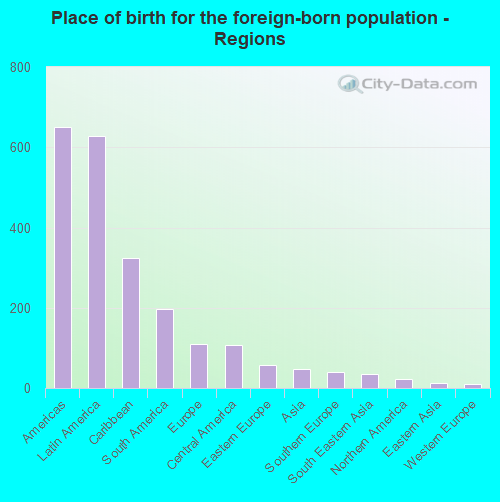
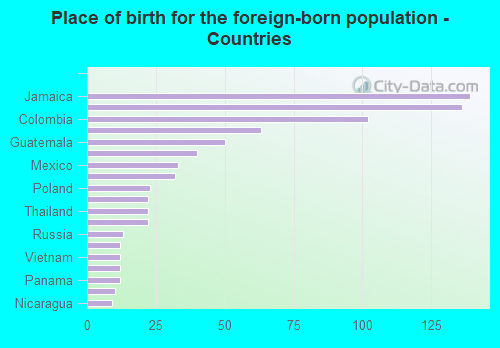
According to 2022 data, the most numerous races in Orange City, FL are White alone (9,554 residents), Hispanic (2,322 residents), and Black alone (1,184 residents). 86.1% of Orange City residents speak English at home. 5.9% of Orange City, FL residents are foreign-born (4.5% born in Latin America, 0.8% born in Europe), which is 257.2% less than the foreign-born rate of 21.0% across the entire state of Florida.
Race distribution in Orange City
2000 2022
10,458,509 65.4% White alone 2,682,715 16.8% Hispanic 2,264,268 14.2% Black alone 261,693 1.6% Asian alone 236,954 1.5% Two or more races 42,358 0.3% American Indian alone 28,994 0.2% Other race alone 6,887 0.04% Native Hawaiian and Other
11,309,403 50.8% White alone 6,025,039 27.1% Hispanic 3,241,015 14.6% Black alone 861,630 3.9% Two or more races 623,692 2.8% Asian alone 152,054 0.7% Other race alone 22,504 0.1% American Indian alone 9,486 0.04% Native Hawaiian and Other
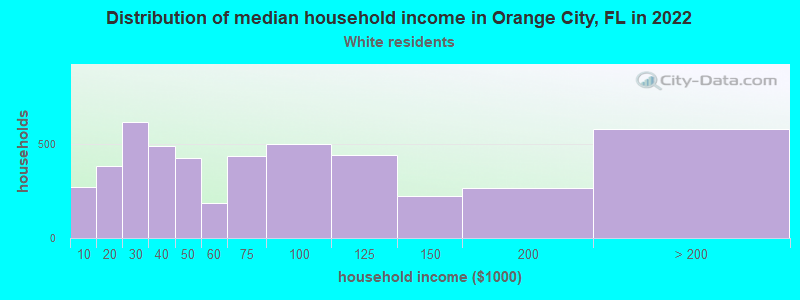
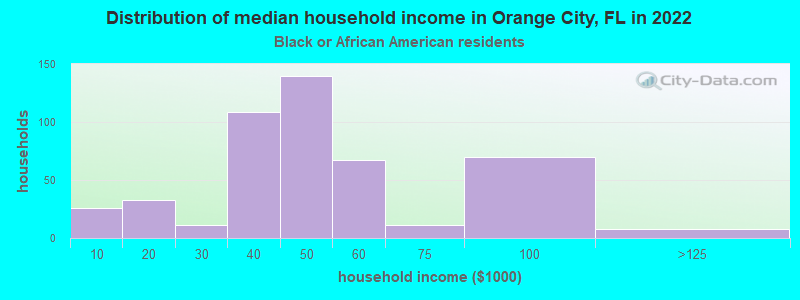
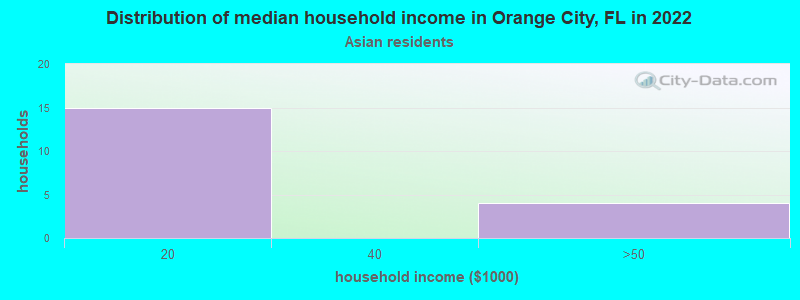
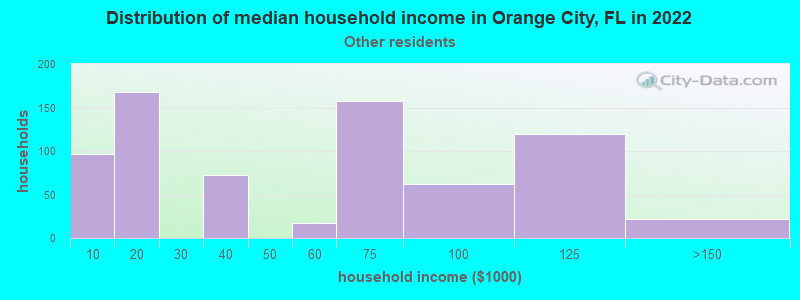
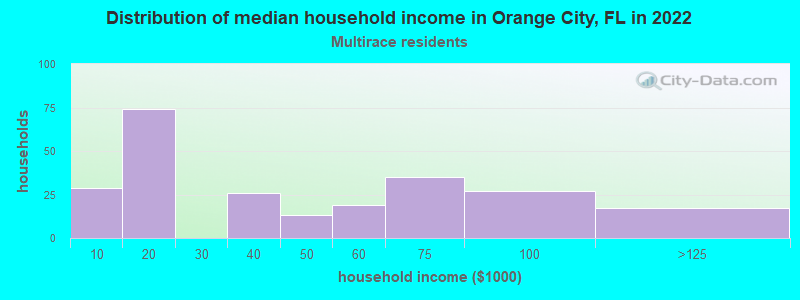
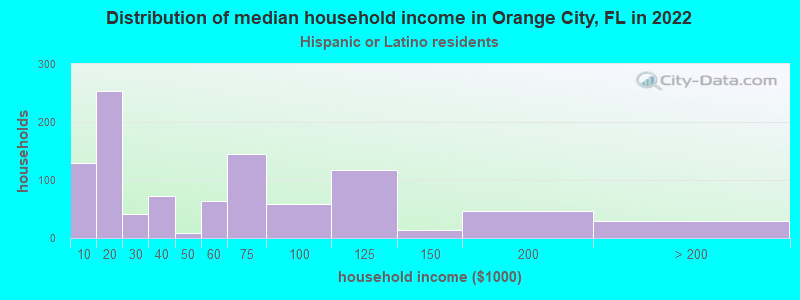
Income and house value in Orange City Median household income in 2022 $60,103 White non-Hispanic householders$51,460 Black householders$33,113 Two or more races householders$35,236 Hispanic or Latino race householdersMedian 2022 house value $316,363 White Non-Hispanic householders$150,380 Black or African American householders$349,732 American Indian or Alaska Native householders$334,131 Hispanic or Latino householders
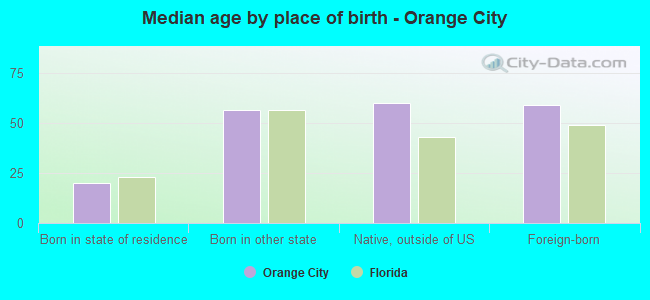
Median age by race in Orange City
50.1 Median age for White residents46.3 52.9 25.9 Median age for Black or African American residents19.5 38.3 -495,279,592.8 Median age for American Indian / Alaska Native residents-455,981,940.9 -459,143,968.4 72.7 Median age for Asian residents-699,912,510.2 78.5 -668,922,729.2 Median age for Native Hawaiian / Pacific Islander residents-668,922,729.2 -443,298,968.6 31.3 Median age for Other race residents29.6 35.4 29.3 Median age for Two or more races residents26.6 32.7 49.7 Median age for White alone residents45.5 52.3 44.1 Median age for Hispanic or Latino residents34.8 47.8
Owner/renter occupied households by race in Orange City
House owners and renters - White residents 3,032 63.8% Owner occupied1,720 36.2% Renter occupiedHouse owners and renters - Black or African American residents 121 22.9% Owner occupied407 77.1% Renter occupiedHouse owners and renters - American Indian / Alaska Native residents 11 100.0% Owner occupiedHouse owners and renters - Asian residents 7 38.8% Owner occupied10 61.2% Renter occupiedHouse owners and renters - Other race residents 125 19.9% Owner occupied505 80.1% Renter occupiedHouse owners and renters - Two or more races residents 115 47.5% Owner occupied127 52.5% Renter occupiedHouse owners and renters - White alone residents 2,926 63.7% Owner occupied1,668 36.3% Renter occupiedHouse owners and renters - Hispanic or Latino residents 296 33.2% Owner occupied597 66.8% Renter occupied
Language usage in Orange City
English speakers - Total 86.1% of residents of Orange City speak English at home.
12.6% of residents speak Spanish at home 1,310 78.1% Speak English very well367 21.9% Speak English less than very well1.3% of residents speak other language at home 91 50.8% Speak English very well88 49.2% Speak English less than very well
English speakers - Born in the United States 92.2% of residents of Orange City speak English at home.
7.3% of residents speak Spanish at home 555 94.1% Speak English very well35 5.9% Speak English less than very well0.4% of residents speak other language at home 22 64.7% Speak English very well12 35.3% Speak English less than very well
English speakers - Native, born elsewhere 13.6% of residents of Orange City speak English at home.
88.7% of residents speak Spanish at home 409 70.5% Speak English very well171 29.5% Speak English less than very well
English speakers - Foreign-born 28.4% of residents of Orange City speak English at home.
52.3% of residents speak Spanish at home 273 69.6% Speak English very well119 30.4% Speak English less than very well17.0% of residents speak other language at home 52 40.9% Speak English very well75 59.1% Speak English less than very well
White (Caucasian) - Speak only English Native:
96.6% (9,080)Foreign-born:
9.9% (24)
White (Caucasian) - Speak another language Native:
3.3% (306)Foreign-born:
72.3% (175)
Black or African American - Speak only English Native:
98.9% (1,011)Foreign-born:
100.0% (147)
Other race - Speak another language Native:
62.8% (815)Foreign-born:
98.8% (261)
Two or more races - Speak another language Native:
21.3% (185)Foreign-born:
100.0% (20)
White alone - Speak only English Native:
97.1% (8,914)Foreign-born:
28.3% (25)
White alone - Speak another language Native:
2.9% (265)Foreign-born:
61.1% (54)
Hispanic or Latino - Speak another language Native:
59.8% (1,030)Foreign-born:
99.4% (413)
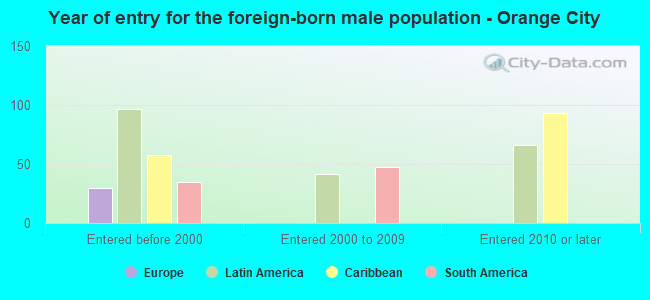
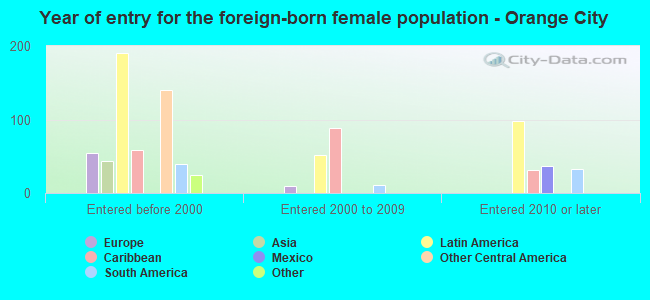
Foreign-born residents in Orange City 808 residents are foreign born (4.5% Latin America , 0.8% Europe ).
This city:
5.9%Florida:
21.1%
Marital status for residents in Orange City Marital status - White (Caucasian) population 15 years and over
Males 23.9% Never married55.9% Now married3.6% Separated5.0% Widowed11.7% DivorcedFemales 21.1% Never married45.9% Now married1.0% Separated12.6% Widowed19.4% DivorcedWomen who gave birth in the past 12 months Now married:
16.0% (13)Unmarried:
84.0% (66)
Women who did not give birth in the past 12 months Now married:
43.4% (886)Unmarried:
56.6% (1,157)
Marital status - Black or African American population 15 years and over
Males 49.0% Never married30.9% Now married0.0% Separated8.7% Widowed11.4% DivorcedFemales 30.6% Never married34.0% Now married7.5% Separated2.5% Widowed25.4% DivorcedWomen who did not give birth in the past 12 months Now married:
45.3% (183)Unmarried:
54.7% (221)
Marital status - Other race population 15 years and over
Males 11.5% Never married75.2% Now married0.0% Separated0.0% Widowed13.2% DivorcedFemales 44.1% Never married42.8% Now married0.0% Separated5.6% Widowed7.6% DivorcedWomen who gave birth in the past 12 months Now married:
0.0% (0)Unmarried:
100.0% (71)
Women who did not give birth in the past 12 months Now married:
43.0% (216)Unmarried:
57.0% (287)
Marital status - Two or more races population 15 years and over
Males 33.3% Never married45.3% Now married0.0% Separated0.0% Widowed21.3% DivorcedFemales 35.3% Never married23.3% Now married6.8% Separated21.8% Widowed12.8% DivorcedWomen who did not give birth in the past 12 months Now married:
24.7% (46)Unmarried:
75.3% (141)
Marital status - White alone, not Hispanic / Latino population 15 years and over
Males 24.4% Never married55.5% Now married3.1% Separated4.7% Widowed12.4% DivorcedFemales 21.2% Never married45.6% Now married0.8% Separated13.3% Widowed19.0% DivorcedWomen who gave birth in the past 12 months Now married:
16.0% (13)Unmarried:
84.0% (69)
Women who did not give birth in the past 12 months Now married:
42.3% (857)Unmarried:
57.7% (1,167)
Marital status - Hispanic or Latino population 15 years and over
Males 16.6% Never married63.0% Now married3.6% Separated3.8% Widowed13.1% DivorcedFemales 32.2% Never married44.9% Now married1.0% Separated8.8% Widowed13.2% DivorcedWomen who gave birth in the past 12 months Now married:
0.0% (0)Unmarried:
100.0% (53)
Women who did not give birth in the past 12 months Now married:
47.5% (243)Unmarried:
52.5% (269)
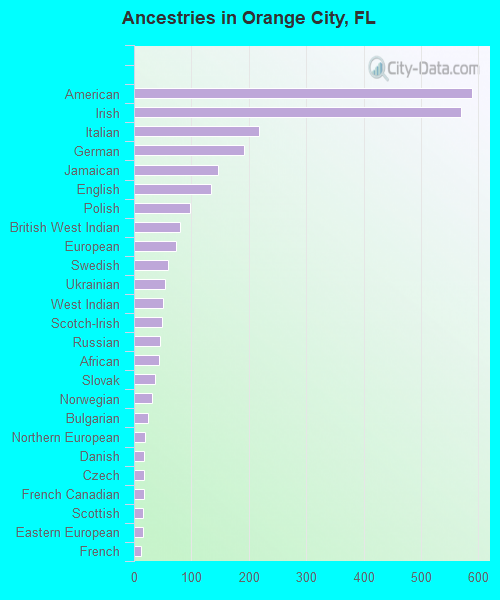
Ancestries in Orange City
589 9.0% American570 8.7% Irish218 3.3% Italian192 2.9% German146 2.2% Jamaican135 2.1% English98 1.5% Polish81 1.2% British West Indian74 1.1% European60 0.9% Swedish54 0.8% Ukrainian50 0.8% West Indian49 0.7% Scotch-Irish46 0.7% Russian44 0.7% African36 0.5% Slovak31 0.5% Norwegian24 0.4% Bulgarian19 0.3% Northern European18 0.3% Danish17 0.3% Czech17 0.3% French Canadian16 0.2% Scottish15 0.2% Eastern European12 0.2% French
Geographical mobility in Orange City Same house 1 year ago 7,959 81.0% White (Caucasian)999 84.6% Black or African American21 100.0% American Indian / Alaska Native41 79.3% Asian1,241 75.3% Other race791 89.8% Two or more races7,684 80.9% White alone, not Hispanic / Latino1,736 77.8% Hispanic or LatinoMoved within same county 1,221 12.4% White / Caucasian88 7.4% Black or African American9 16.6% Asian117 7.1% Other race20 2.3% Two or more races1,250 13.2% White alone, not Hispanic / Latino112 5.0% Hispanic or LatinoMoved within same state 420 4.3% White / Caucasian82 7.0% Black or African American146 8.8% Other race28 3.2% Two or more races370 3.9% White alone, not Hispanic / Latino229 10.3% Hispanic or LatinoMoved from different state 151 1.5% White / Caucasian108 6.6% Other race33 3.7% Two or more races121 1.3% White alone, not Hispanic / Latino185 8.3% Hispanic or Latino
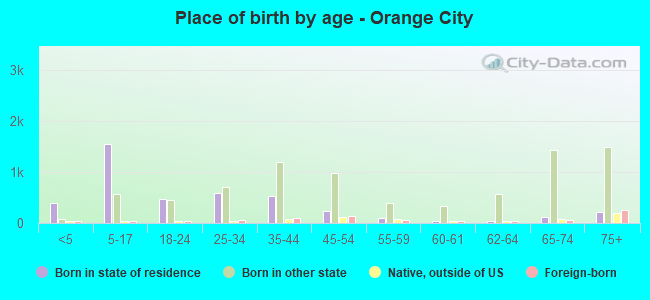
Children Nativity (place of birth) in Orange City
Children under 6 years - Living with two parents Both parents native 183 100.0% NativeOne native, one foreign-born parent 46 100.0% NativeChildren under 6 years - Living with one parent Native parent 314 100.0% NativeChildren 6 to 17 years - Living with two parents Both parents native 809 100.0% NativeBoth parents foreign-born 40 100.0% NativeOne native, one foreign-born parent 101 100.0% NativeChildren 6 to 17 years - Living with one parent Native parent 1,000 100.0% NativeForeign-born parent 154 58.7% Native109 41.3% Foreign-born