Races in Olivette, Missouri (MO) Detailed Stats
Data:
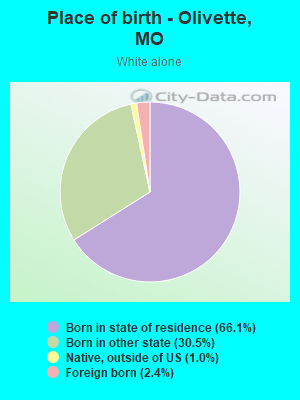
Races - White alone (%)
Races - White alone (% change since 2000)
Races - Black alone (%)
Races - Black alone (% change since 2000)
Races - American Indian alone (%)
Races - American Indian alone (% change since 2000)
Races - Asian alone (%)
Races - Asian alone (% change since 2000)
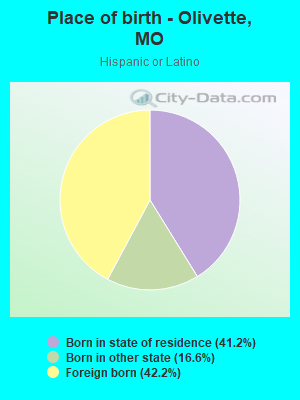
Races - Hispanic (%)
Races - Hispanic (% change since 2000)
Races - Native Hawaiian and Other Pacific Islander alone (%)
Races - Native Hawaiian and Other Pacific Islander alone (% change since 2000)
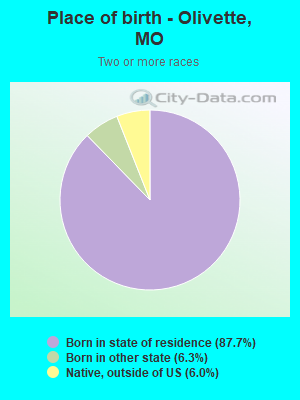
Races - Two or more races(%)
Races - Two or more races(% change since 2000)
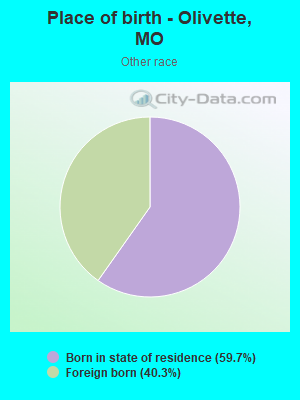
Races - Other race alone (%)
Races - Other race alone (% change since 2000)
Racial diversity
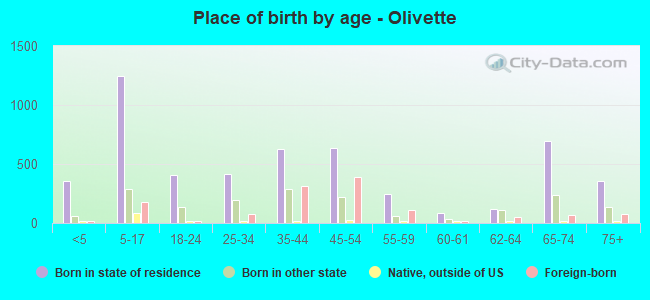
Place of birth - Born in state of residence (%)
Place of birth - Born in state of residence (%) - White
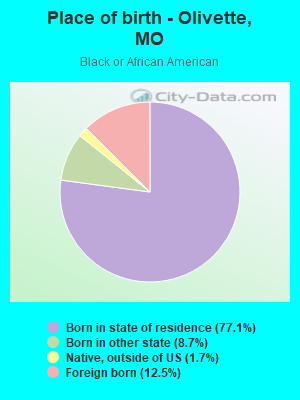
Place of birth - Born in state of residence (%) - Black or African American
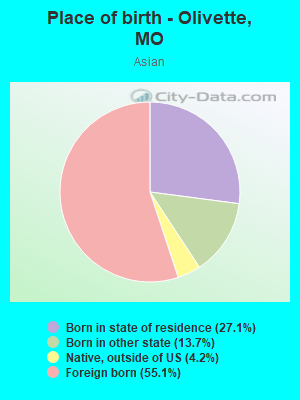
Place of birth - Born in state of residence (%) - Asian
Place of birth - Born in state of residence (%) - Hispanic or Latino
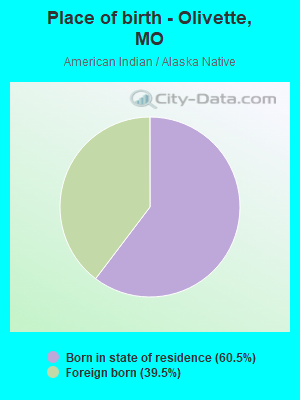
Place of birth - Born in state of residence (%) - American Indian and Alaska Native
Place of birth - Born in state of residence (%) - Multirace
Place of birth - Born in state of residence (%) - Other Race
Place of birth - Born in other state (%)
Place of birth - Born in other state (%) - White
Place of birth - Born in other state (%) - Black or African American
Place of birth - Born in other state (%) - Asian
Place of birth - Born in other state (%) - Hispanic or Latino
Place of birth - Born in other state (%) - American Indian and Alaska Native
Place of birth - Born in other state (%) - Multirace
Place of birth - Born in other state (%) - Other Race
Place of birth - Native, outside of US (%)
Place of birth - Native, outside of US (%) - White
Place of birth - Native, outside of US (%) - Black or African American
Place of birth - Native, outside of US (%) - Asian
Place of birth - Native, outside of US (%) - Hispanic or Latino
Place of birth - Native, outside of US (%) - American Indian and Alaska Native
Place of birth - Native, outside of US (%) - Multirace
Place of birth - Native, outside of US (%) - Other Race
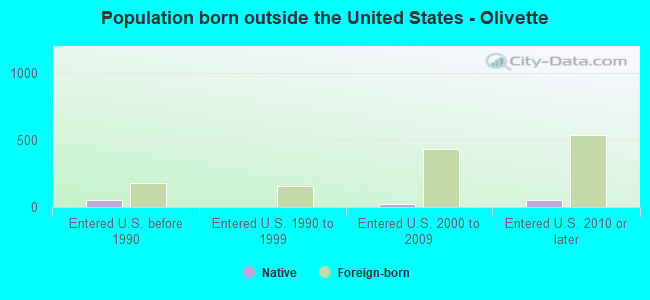
Place of birth - Foreign born (%)
Place of birth - Foreign born (%) - White
Place of birth - Foreign born (%) - Black or African American
Place of birth - Foreign born (%) - Asian
Place of birth - Foreign born (%) - Hispanic or Latino
Place of birth - Foreign born (%) - American Indian and Alaska Native
Place of birth - Foreign born (%) - Multirace
Place of birth - Foreign born (%) - Other Race
Residents speaking English at home (%)
Residents speaking English at home - Born in the United States (%)
Residents speaking English at home - Native, born elsewhere (%)
Residents speaking English at home - Foreign born (%)
Residents speaking Spanish at home (%)
Residents speaking Spanish at home - Born in the United States (%)
Residents speaking Spanish at home - Native, born elsewhere (%)
Residents speaking Spanish at home - Foreign born (%)
Residents speaking other language at home (%)
Residents speaking other language at home - Born in the United States (%)
Residents speaking other language at home - Native, born elsewhere (%)
Residents speaking other language at home - Foreign born (%)
Marital status - Never married (%)
Marital status - Now married (%)
Marital status - Separated (%)
Marital status - Widowed (%)
Marital status - Divorced (%)
Ancestries Reported - Arab (%)
Ancestries Reported - Czech (%)
Ancestries Reported - Danish (%)
Ancestries Reported - Dutch (%)
Ancestries Reported - English (%)
Ancestries Reported - French (%)
Ancestries Reported - French Canadian (%)
Ancestries Reported - German (%)
Ancestries Reported - Greek (%)
Ancestries Reported - Hungarian (%)
Ancestries Reported - Irish (%)
Ancestries Reported - Italian (%)
Ancestries Reported - Lithuanian (%)
Ancestries Reported - Norwegian (%)
Ancestries Reported - Polish (%)
Ancestries Reported - Portuguese (%)
Ancestries Reported - Russian (%)
Ancestries Reported - Scotch-Irish (%)
Ancestries Reported - Scottish (%)
Ancestries Reported - Slovak (%)
Ancestries Reported - Subsaharan African (%)
Ancestries Reported - Swedish (%)
Ancestries Reported - Swiss (%)
Ancestries Reported - Ukrainian (%)
Ancestries Reported - United States (%)
Ancestries Reported - Welsh (%)
Ancestries Reported - West Indian (%)
Ancestries Reported - Other (%)
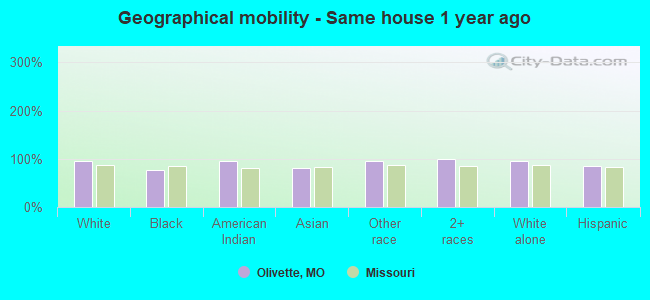
Geographical mobility - Same house 1 year ago (%)
Geographical mobility - Same house 1 year ago (%) - White
Geographical mobility - Same house 1 year ago (%) - Black or African American
Geographical mobility - Same house 1 year ago (%) - Asian
Geographical mobility - Same house 1 year ago (%) - Hispanic or Latino
Geographical mobility - Same house 1 year ago (%) - American Indian and Alaska Native
Geographical mobility - Same house 1 year ago (%) - Multirace
Geographical mobility - Same house 1 year ago (%) - Other Race
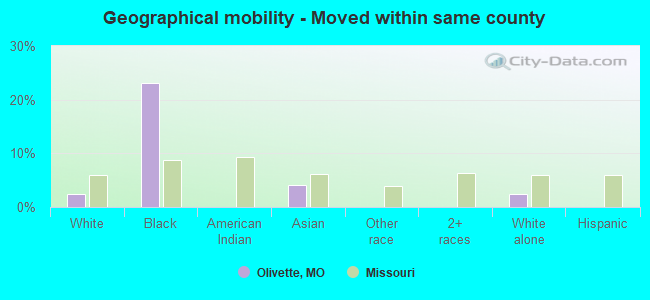
Geographical mobility - Moved within same county (%)
Geographical mobility - Moved within same county (%) - White
Geographical mobility - Moved within same county (%) - Black or African American
Geographical mobility - Moved within same county (%) - Asian
Geographical mobility - Moved within same county (%) - Hispanic or Latino
Geographical mobility - Moved within same county (%) - American Indian and Alaska Native
Geographical mobility - Moved within same county (%) - Multirace
Geographical mobility - Moved within same county (%) - Other Race
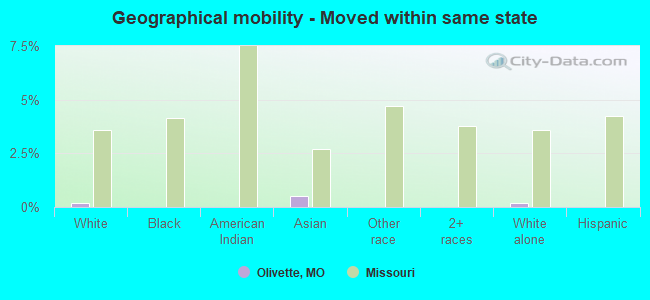
Geographical mobility - Moved from different county within same state (%)
Geographical mobility - Moved from different county within same state (%) - White
Geographical mobility - Moved from different county within same state (%) - Black or African American
Geographical mobility - Moved from different county within same state (%) - Asian
Geographical mobility - Moved from different county within same state (%) - Hispanic or Latino
Geographical mobility - Moved from different county within same state (%) - American Indian and Alaska Native
Geographical mobility - Moved from different county within same state (%) - Multirace
Geographical mobility - Moved from different county within same state (%) - Other Race
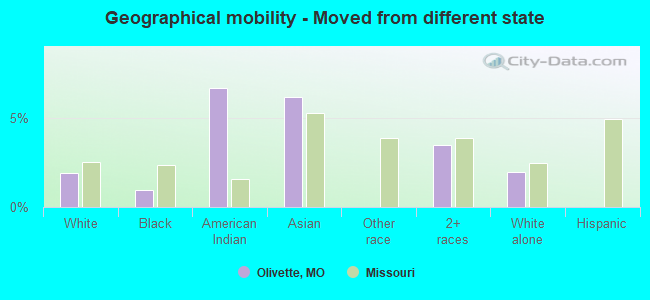
Geographical mobility - Moved from different state (%)
Geographical mobility - Moved from different state (%) - White
Geographical mobility - Moved from different state (%) - Black or African American
Geographical mobility - Moved from different state (%) - Asian
Geographical mobility - Moved from different state (%) - Hispanic or Latino
Geographical mobility - Moved from different state (%) - American Indian and Alaska Native
Geographical mobility - Moved from different state (%) - Multirace
Geographical mobility - Moved from different state (%) - Other Race
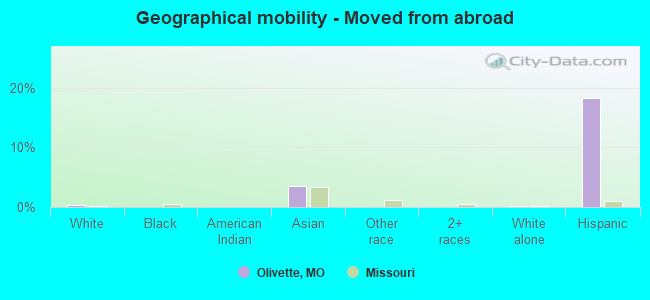
Geographical mobility - Moved from abroad (%)
Geographical mobility - Moved from abroad (%) - White
Geographical mobility - Moved from abroad (%) - Black or African American
Geographical mobility - Moved from abroad (%) - Asian
Geographical mobility - Moved from abroad (%) - Hispanic or Latino
Geographical mobility - Moved from abroad (%) - American Indian and Alaska Native
Geographical mobility - Moved from abroad (%) - Multirace
Geographical mobility - Moved from abroad (%) - Other Race
Place of birth for the foreign-born population - Ireland (%)
Place of birth for the foreign-born population - Denmark (%)
Place of birth for the foreign-born population - Norway (%)
Place of birth for the foreign-born population - Sweden (%)
Place of birth for the foreign-born population - United Kingdom (%)
Place of birth for the foreign-born population - England (%)
Place of birth for the foreign-born population - Scotland (%)
Place of birth for the foreign-born population - Other Northern Europe (%)
Place of birth for the foreign-born population - Austria (%)
Place of birth for the foreign-born population - Belgium (%)
Place of birth for the foreign-born population - France (%)
Place of birth for the foreign-born population - Germany (%)
Place of birth for the foreign-born population - Netherlands (%)
Place of birth for the foreign-born population - Switzerland (%)
Place of birth for the foreign-born population - Other Western Europe (%)
Place of birth for the foreign-born population - Greece (%)
Place of birth for the foreign-born population - Italy (%)
Place of birth for the foreign-born population - Portugal (%)
Place of birth for the foreign-born population - Spain (%)
Place of birth for the foreign-born population - Other Southern Europe (%)
Place of birth for the foreign-born population - Albania (%)
Place of birth for the foreign-born population - Belarus (%)
Place of birth for the foreign-born population - Bosnia and Herzegovina (%)
Place of birth for the foreign-born population - Bulgaria (%)
Place of birth for the foreign-born population - Croatia (%)
Place of birth for the foreign-born population - Czechoslovakia (%)
Place of birth for the foreign-born population - Hungary (%)
Place of birth for the foreign-born population - Latvia (%)
Place of birth for the foreign-born population - Lithuania (%)
Place of birth for the foreign-born population - North Macedonia (Macedonia) (%)
Place of birth for the foreign-born population - Moldova (%)
Place of birth for the foreign-born population - Poland (%)
Place of birth for the foreign-born population - Romania (%)
Place of birth for the foreign-born population - Russia (%)
Place of birth for the foreign-born population - Serbia (%)
Place of birth for the foreign-born population - Ukraine (%)
Place of birth for the foreign-born population - Other Eastern Europe (%)
Place of birth for the foreign-born population - China (%)
Place of birth for the foreign-born population - Hong Kong (%)
Place of birth for the foreign-born population - Taiwan (%)
Place of birth for the foreign-born population - Japan (%)
Place of birth for the foreign-born population - Korea (%)
Place of birth for the foreign-born population - Other Eastern Asia (%)
Place of birth for the foreign-born population - Afghanistan (%)
Place of birth for the foreign-born population - Bangladesh (%)
Place of birth for the foreign-born population - India (%)
Place of birth for the foreign-born population - Iran (%)
Place of birth for the foreign-born population - Kazakhstan (%)
Place of birth for the foreign-born population - Nepal (%)
Place of birth for the foreign-born population - Pakistan (%)
Place of birth for the foreign-born population - Sri Lanka (%)
Place of birth for the foreign-born population - Uzbekistan (%)
Place of birth for the foreign-born population - Other South Central Asia (%)
Place of birth for the foreign-born population - Burma (%)
Place of birth for the foreign-born population - Cambodia (%)
Place of birth for the foreign-born population - Indonesia (%)
Place of birth for the foreign-born population - Laos (%)
Place of birth for the foreign-born population - Malaysia (%)
Place of birth for the foreign-born population - Philippines (%)
Place of birth for the foreign-born population - Singapore (%)
Place of birth for the foreign-born population - Thailand (%)
Place of birth for the foreign-born population - Vietnam (%)
Place of birth for the foreign-born population - Other South Eastern Asia (%)
Place of birth for the foreign-born population - Armenia (%)
Place of birth for the foreign-born population - Iraq (%)
Place of birth for the foreign-born population - Israel (%)
Place of birth for the foreign-born population - Jordan (%)
Place of birth for the foreign-born population - Kuwait (%)
Place of birth for the foreign-born population - Lebanon (%)
Place of birth for the foreign-born population - Saudi Arabia (%)
Place of birth for the foreign-born population - Syria (%)
Place of birth for the foreign-born population - Turkey (%)
Place of birth for the foreign-born population - Yemen (%)
Place of birth for the foreign-born population - Other Western Asia (%)
Place of birth for the foreign-born population - Eritrea (%)
Place of birth for the foreign-born population - Ethiopia (%)
Place of birth for the foreign-born population - Kenya (%)
Place of birth for the foreign-born population - Somalia (%)
Place of birth for the foreign-born population - Uganda (%)
Place of birth for the foreign-born population - Zimbabwe (%)
Place of birth for the foreign-born population - Other Eastern Africa (%)
Place of birth for the foreign-born population - Cameroon (%)
Place of birth for the foreign-born population - Congo (%)
Place of birth for the foreign-born population - Democratic Republic of Congo (Zaire) (%)
Place of birth for the foreign-born population - Other Middle Africa (%)
Place of birth for the foreign-born population - Egypt (%)
Place of birth for the foreign-born population - Morocco (%)
Place of birth for the foreign-born population - Sudan (%)
Place of birth for the foreign-born population - Other Northern Africa (%)
Place of birth for the foreign-born population - South Africa (%)
Place of birth for the foreign-born population - Other Southern Africa (%)
Place of birth for the foreign-born population - Cabo Verde (%)
Place of birth for the foreign-born population - Ghana (%)
Place of birth for the foreign-born population - Liberia (%)
Place of birth for the foreign-born population - Nigeria (%)
Place of birth for the foreign-born population - Senegal (%)
Place of birth for the foreign-born population - Sierra Leone (%)
Place of birth for the foreign-born population - Other Western Africa (%)
Place of birth for the foreign-born population - Australia (%)
Place of birth for the foreign-born population - New Zealand (%)
Place of birth for the foreign-born population - Fiji (%)
Place of birth for the foreign-born population - Micronesia (%)
Place of birth for the foreign-born population - Bahamas (%)
Place of birth for the foreign-born population - Barbados (%)
Place of birth for the foreign-born population - Cuba (%)
Place of birth for the foreign-born population - Dominica (%)
Place of birth for the foreign-born population - Dominican Republic (%)
Place of birth for the foreign-born population - Grenada (%)
Place of birth for the foreign-born population - Haiti (%)
Place of birth for the foreign-born population - Jamaica (%)
Place of birth for the foreign-born population - St. Vincent and the Grenadines (%)
Place of birth for the foreign-born population - Trinidad and Tobago (%)
Place of birth for the foreign-born population - West Indies (%)
Place of birth for the foreign-born population - Other Caribbean (%)
Place of birth for the foreign-born population - Belize (%)
Place of birth for the foreign-born population - Costa Rica (%)
Place of birth for the foreign-born population - El Salvador (%)
Place of birth for the foreign-born population - Guatemala (%)
Place of birth for the foreign-born population - Honduras (%)
Place of birth for the foreign-born population - Mexico (%)
Place of birth for the foreign-born population - Nicaragua (%)
Place of birth for the foreign-born population - Panama (%)
Place of birth for the foreign-born population - Other Central America (%)
Place of birth for the foreign-born population - Argentina (%)
Place of birth for the foreign-born population - Bolivia (%)
Place of birth for the foreign-born population - Brazil (%)
Place of birth for the foreign-born population - Chile (%)
Place of birth for the foreign-born population - Colombia (%)
Place of birth for the foreign-born population - Ecuador (%)
Place of birth for the foreign-born population - Guyana (%)
Place of birth for the foreign-born population - Peru (%)
Place of birth for the foreign-born population - Uruguay (%)
Place of birth for the foreign-born population - Venezuela (%)
Place of birth for the foreign-born population - Other South America (%)
Place of birth for the foreign-born population - Canada (%)
Place of birth for the foreign-born population - Other Northern America (%)
Place of birth for the foreign-born population - Other (%)
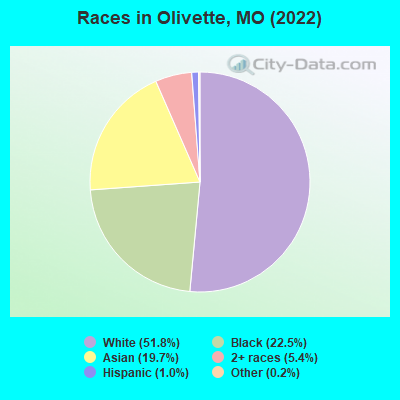
According to 2022 data, the most numerous races in Olivette, MO are White alone (4,327 residents), Black alone (1,879 residents), and Two or more races (454 residents). 77.5% of Olivette residents speak English at home. 15.3% of Olivette, MO residents are foreign-born (11.4% born in Asia, 2.3% born in Africa), which is 73.9% greater than the foreign-born rate of 4.0% across the entire state of Missouri.
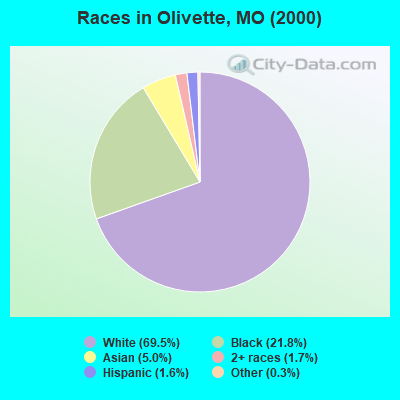
Race distribution in Olivette
2000 2022
4,686,474 83.8% White alone 625,667 11.2% Black alone 118,592 2.1% Hispanic 71,905 1.3% Two or more races 61,041 1.1% Asian alone 23,302 0.4% American Indian alone 5,291 0.09% Other race alone 2,939 0.05% Native Hawaiian and Other
4,733,411 76.6% White alone 656,739 10.6% Black alone 316,300 5.1% Two or more races 291,763 4.7% Hispanic 132,436 2.1% Asian alone 27,467 0.4% Other race alone 12,313 0.2% American Indian alone 7,528 0.1% Native Hawaiian and Other
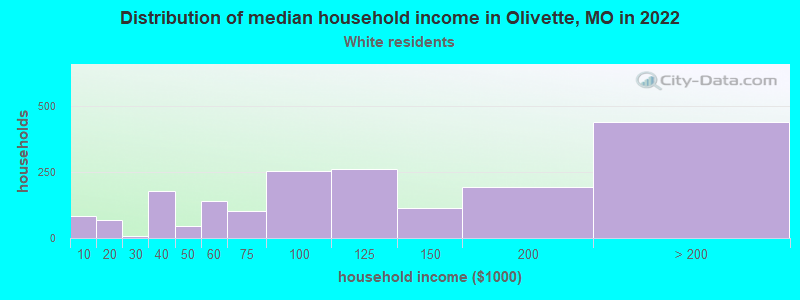
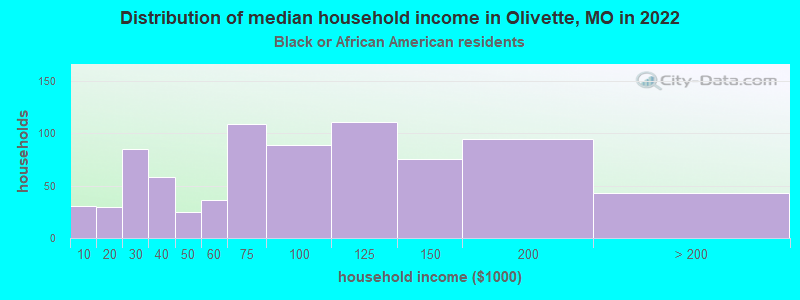
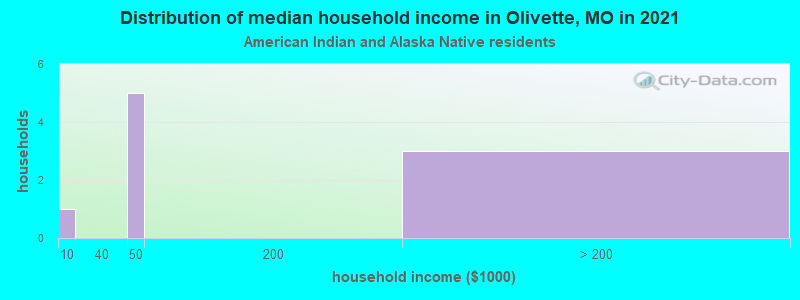
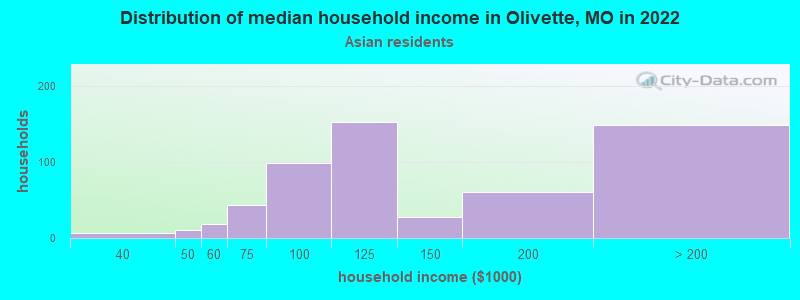
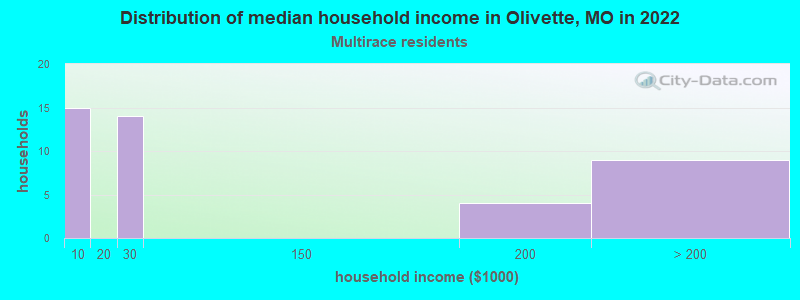
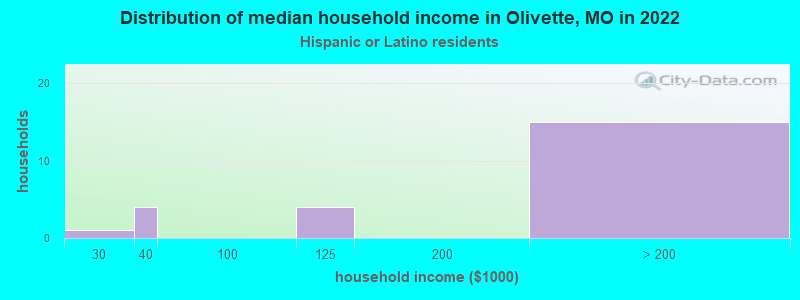
Income and house value in Olivette Median household income in 2022 $110,132 White non-Hispanic householders$80,870 Black householders$101,054 Asian householdersover $200,000 Hispanic or Latino race householdersMedian 2022 house value $558,052 White Non-Hispanic householders$330,389 Black or African American householders $504,375 Asian householders$424,168 Hispanic or Latino householders
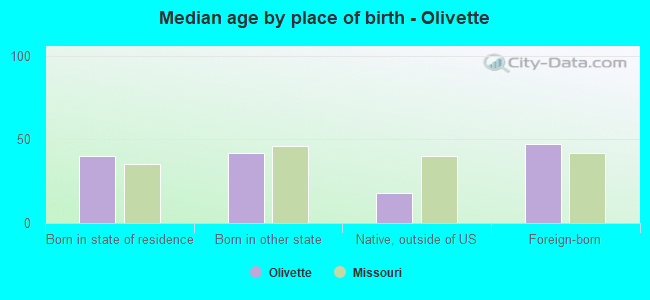
Median age by race in Olivette
45.9 Median age for White residents47.3 44.5 44.4 Median age for Black or African American residents32.5 47.0 36.3 Median age for American Indian / Alaska Native residents-644,003,776.5 -505,494,505.0 39.2 Median age for Asian residents32.1 42.0 -710,303,029.6 Median age for Native Hawaiian / Pacific Islander residents-1,449,781,657.9 -752,136,751.4 18.4 Median age for Other race residents18.5 -652,431,790.6 15.8 Median age for Two or more races residents17.4 14.6 45.9 Median age for White alone residents47.0 44.7 41.1 Median age for Hispanic or Latino residents54.7 32.2
Owner/renter occupied households by race in Olivette
House owners and renters - White residents 1,536 81.9% Owner occupied339 18.1% Renter occupiedHouse owners and renters - Black or African American residents 334 42.6% Owner occupied451 57.4% Renter occupiedHouse owners and renters - American Indian / Alaska Native residents 1 55.8% Owner occupied1 44.2% Renter occupiedHouse owners and renters - Asian residents 466 79.3% Owner occupied122 20.7% Renter occupiedHouse owners and renters - Other race residents 4 100.0% Owner occupiedHouse owners and renters - Two or more races residents 27 70.2% Owner occupied12 29.8% Renter occupiedHouse owners and renters - White alone residents 1,521 81.6% Owner occupied343 18.4% Renter occupiedHouse owners and renters - Hispanic or Latino residents 27 100.0% Owner occupied
Language usage in Olivette
English speakers - Total 77.5% of residents of Olivette speak English at home.
0.6% of residents speak Spanish at home 13 29.5% Speak English very well31 70.5% Speak English less than very well22.2% of residents speak other language at home 1,170 66.3% Speak English very well595 33.7% Speak English less than very well
English speakers - Born in the United States 84.6% of residents of Olivette speak English at home.
0.5% of residents speak Spanish at home 9 100.0% Speak English less than very well17.0% of residents speak other language at home 287 100.0% Speak English very well
English speakers - Native, born elsewhere 78.4% of residents of Olivette speak English at home.
32.4% of residents speak other language at home 48 100.0% Speak English very well
English speakers - Foreign-born 9.1% of residents of Olivette speak English at home.
1.9% of residents speak Spanish at home 25 100.0% Speak English less than very well86.8% of residents speak other language at home 597 53.0% Speak English very well529 47.0% Speak English less than very well
White (Caucasian) - Speak only English Native:
95.5% (3,811)Foreign-born:
43.9% (50)
White (Caucasian) - Speak another language Native:
4.4% (175)Foreign-born:
51.5% (59)
Black or African American - Speak only English Native:
97.5% (1,598)Foreign-born:
3.0% (7)
Black or African American - Speak another language Native:
2.6% (42)Foreign-born:
89.4% (209)
American Indian / Alaska Native - Speak only English Native:
91.2% (8)Foreign-born:
100.0% (5)
Asian - Speak only English Native:
38.7% (257)Foreign-born:
4.7% (44)
Asian - Speak another language Native:
56.9% (377)Foreign-born:
92.0% (867)
Other race - Speak another language Native:
12.3% (2)Foreign-born:
90.6% (11)
White alone - Speak only English Native:
95.6% (3,811)Foreign-born:
44.9% (47)
White alone - Speak another language Native:
4.4% (175)Foreign-born:
50.3% (53)
Hispanic or Latino - Speak only English Native:
73.0% (36)Foreign-born:
32.5% (12)
Hispanic or Latino - Speak another language Native:
28.5% (14)Foreign-born:
62.7% (23)
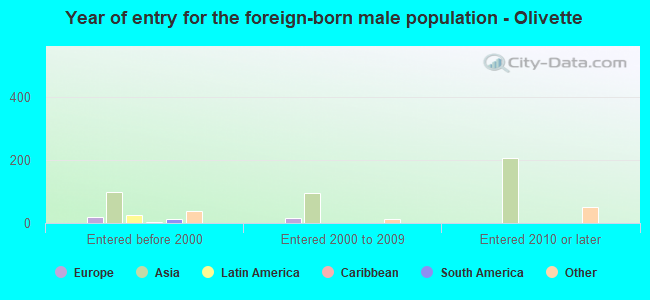
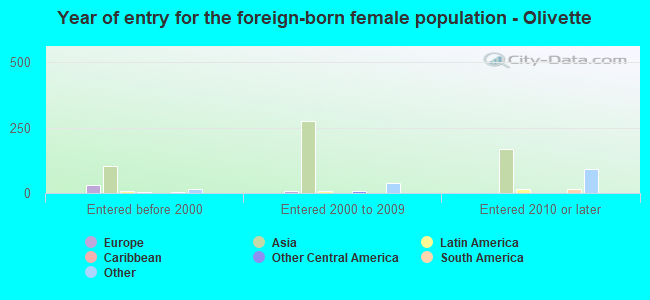
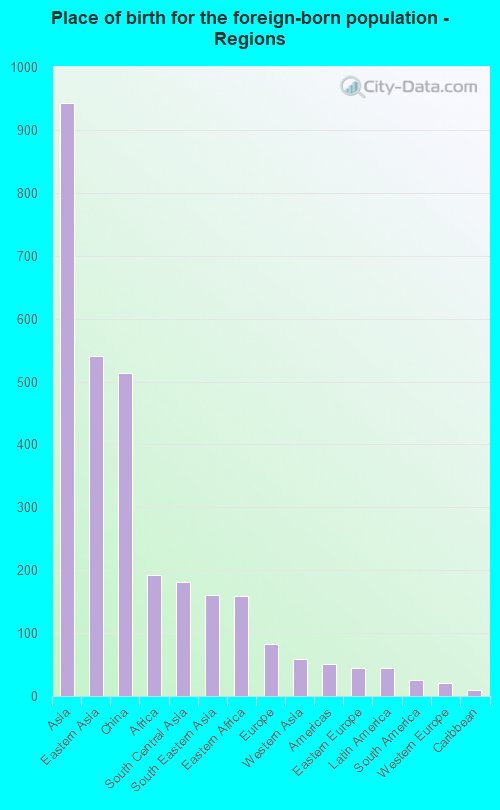
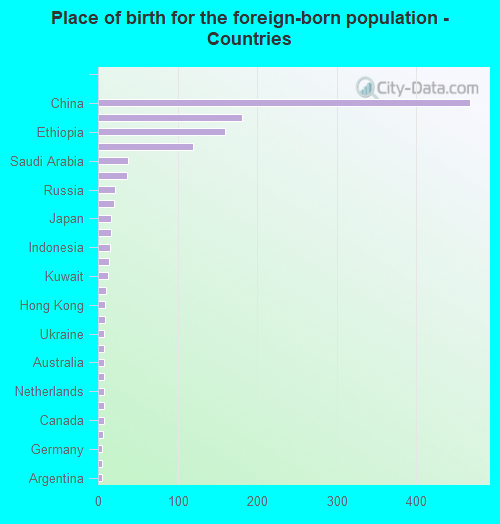
Foreign-born residents in Olivette 1,278 residents are foreign born (11.4% Asia , 2.3% Africa ).
This city:
15.3%Missouri:
4.2%
Marital status for residents in Olivette Marital status - White (Caucasian) population 15 years and over
Males 30.6% Never married59.4% Now married0.0% Separated1.7% Widowed8.3% DivorcedFemales 17.0% Never married58.6% Now married0.8% Separated6.2% Widowed17.3% DivorcedWomen who gave birth in the past 12 months Now married:
100.0% (29)Unmarried:
0.0% (0)
Women who did not give birth in the past 12 months Now married:
50.9% (458)Unmarried:
49.1% (442)
Marital status - Black or African American population 15 years and over
Males 48.8% Never married41.6% Now married0.0% Separated1.7% Widowed7.9% DivorcedFemales 28.4% Never married33.7% Now married13.3% Separated6.0% Widowed18.6% DivorcedWomen who gave birth in the past 12 months Now married:
28.0% (7)Unmarried:
72.0% (17)
Women who did not give birth in the past 12 months Now married:
40.0% (224)Unmarried:
60.0% (336)
Marital status - American Indian / Alaska Native population 15 years and over
Males 87.5% Never married12.5% Now married0.0% Separated0.0% Widowed0.0% DivorcedFemales 0.0% Never married0.0% Now married0.0% Separated0.0% Widowed100.0% DivorcedWomen who did not give birth in the past 12 months Now married:
0.0% (0)Unmarried:
97.9% (1)
Marital status - Asian population 15 years and over
Males 20.8% Never married71.5% Now married0.0% Separated5.5% Widowed2.1% DivorcedFemales 10.9% Never married57.7% Now married0.0% Separated25.9% Widowed5.6% DivorcedWomen who gave birth in the past 12 months Now married:
100.0% (11)Unmarried:
0.0% (0)
Women who did not give birth in the past 12 months Now married:
46.3% (214)Unmarried:
53.7% (248)
Marital status - Other race population 15 years and over
Males 52.9% Never married47.1% Now married0.0% Separated0.0% Widowed0.0% DivorcedFemales 0.0% Never married100.0% Now married0.0% Separated0.0% Widowed0.0% DivorcedWomen who did not give birth in the past 12 months Now married:
100.0% (4)Unmarried:
0.0% (0)
Marital status - Two or more races population 15 years and over
Males 97.2% Never married2.8% Now married0.0% Separated0.0% Widowed0.0% DivorcedFemales 77.0% Never married9.7% Now married7.1% Separated0.0% Widowed6.2% DivorcedWomen who did not give birth in the past 12 months Now married:
16.8% (25)Unmarried:
83.2% (124)
Marital status - White alone, not Hispanic / Latino population 15 years and over
Males 30.8% Never married59.4% Now married0.0% Separated1.3% Widowed8.4% DivorcedFemales 16.8% Never married58.5% Now married0.8% Separated6.3% Widowed17.5% DivorcedWomen who gave birth in the past 12 months Now married:
100.0% (29)Unmarried:
0.0% (0)
Women who did not give birth in the past 12 months Now married:
50.3% (443)Unmarried:
49.7% (437)
Marital status - Hispanic or Latino population 15 years and over
Males 37.1% Never married45.7% Now married0.0% Separated17.1% Widowed0.0% DivorcedFemales 25.0% Never married75.0% Now married0.0% Separated0.0% Widowed0.0% DivorcedWomen who did not give birth in the past 12 months Now married:
75.0% (29)Unmarried:
25.0% (10)
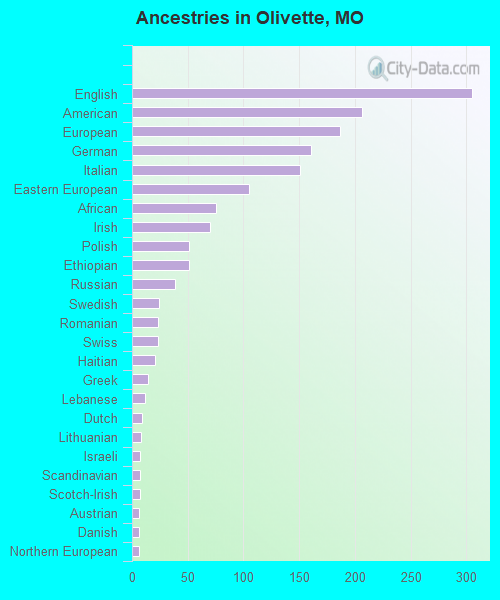
Ancestries in Olivette
305 7.6% English206 5.1% American187 4.6% European161 4.0% German151 3.7% Italian105 2.6% Eastern European75 1.9% African70 1.7% Irish51 1.3% Polish51 1.3% Ethiopian39 1.0% Russian24 0.6% Swedish23 0.6% Romanian23 0.6% Swiss21 0.5% Haitian14 0.3% Greek12 0.3% Lebanese9 0.2% Dutch8 0.2% Lithuanian7 0.2% Israeli7 0.2% Scandinavian7 0.2% Scotch-Irish6 0.1% Austrian6 0.1% Danish6 0.1% Northern European4 0.10% Australian
Children Nativity (place of birth) in Olivette
Children under 6 years - Living with two parents Both parents native 332 99.6% Native1 0.4% Foreign-bornBoth parents foreign-born 91 96.7% Native3 3.3% Foreign-bornOne native, one foreign-born parent 23 100.0% NativeChildren under 6 years - Living with one parent Native parent 30 100.0% NativeChildren 6 to 17 years - Living with two parents Both parents native 497 100.0% Native0 0.0% Foreign-bornBoth parents foreign-born 153 47.0% Native172 53.0% Foreign-bornOne native, one foreign-born parent 110 88.3% Native15 11.7% Foreign-bornChildren 6 to 17 years - Living with one parent Native parent 612 100.0% NativeForeign-born parent 174 48.6% Native184 51.4% Foreign-born
Grandparents responsible for own grandchildren in Olivette
Grandparents (30 to 59 years) White / Caucasian 5 100.0% Responsible for grandchildrenWhite alone, not Hispanic / Latino 5 100.0% Responsible for grandchildren
Grandparents (60 years and over) White / Caucasian 6 100.0% Responsible for grandchildrenWhite alone, not Hispanic / Latino 6 100.0% Responsible for grandchildren