Races in Odenton, Maryland (MD) Detailed Stats
Data:
Races - White alone (%)
Races - White alone (% change since 2000)
Races - Black alone (%)
Races - Black alone (% change since 2000)
Races - American Indian alone (%)
Races - American Indian alone (% change since 2000)
Races - Asian alone (%)
Races - Asian alone (% change since 2000)
Races - Hispanic (%)
Races - Hispanic (% change since 2000)
Races - Native Hawaiian and Other Pacific Islander alone (%)
Races - Native Hawaiian and Other Pacific Islander alone (% change since 2000)
Races - Two or more races(%)
Races - Two or more races(% change since 2000)
Races - Other race alone (%)
Races - Other race alone (% change since 2000)
Racial diversity
Place of birth - Born in state of residence (%)
Place of birth - Born in state of residence (%) - White
Place of birth - Born in state of residence (%) - Black or African American
Place of birth - Born in state of residence (%) - Asian
Place of birth - Born in state of residence (%) - Hispanic or Latino
Place of birth - Born in state of residence (%) - American Indian and Alaska Native
Place of birth - Born in state of residence (%) - Multirace
Place of birth - Born in state of residence (%) - Other Race
Place of birth - Born in other state (%)
Place of birth - Born in other state (%) - White
Place of birth - Born in other state (%) - Black or African American
Place of birth - Born in other state (%) - Asian
Place of birth - Born in other state (%) - Hispanic or Latino
Place of birth - Born in other state (%) - American Indian and Alaska Native
Place of birth - Born in other state (%) - Multirace
Place of birth - Born in other state (%) - Other Race
Place of birth - Native, outside of US (%)
Place of birth - Native, outside of US (%) - White
Place of birth - Native, outside of US (%) - Black or African American
Place of birth - Native, outside of US (%) - Asian
Place of birth - Native, outside of US (%) - Hispanic or Latino
Place of birth - Native, outside of US (%) - American Indian and Alaska Native
Place of birth - Native, outside of US (%) - Multirace
Place of birth - Native, outside of US (%) - Other Race
Place of birth - Foreign born (%)
Place of birth - Foreign born (%) - White
Place of birth - Foreign born (%) - Black or African American
Place of birth - Foreign born (%) - Asian
Place of birth - Foreign born (%) - Hispanic or Latino
Place of birth - Foreign born (%) - American Indian and Alaska Native
Place of birth - Foreign born (%) - Multirace
Place of birth - Foreign born (%) - Other Race
Residents speaking English at home (%)
Residents speaking English at home - Born in the United States (%)
Residents speaking English at home - Native, born elsewhere (%)
Residents speaking English at home - Foreign born (%)
Residents speaking Spanish at home (%)
Residents speaking Spanish at home - Born in the United States (%)
Residents speaking Spanish at home - Native, born elsewhere (%)
Residents speaking Spanish at home - Foreign born (%)
Residents speaking other language at home (%)
Residents speaking other language at home - Born in the United States (%)
Residents speaking other language at home - Native, born elsewhere (%)
Residents speaking other language at home - Foreign born (%)
Marital status - Never married (%)
Marital status - Now married (%)
Marital status - Separated (%)
Marital status - Widowed (%)
Marital status - Divorced (%)
Ancestries Reported - Arab (%)
Ancestries Reported - Czech (%)
Ancestries Reported - Danish (%)
Ancestries Reported - Dutch (%)
Ancestries Reported - English (%)
Ancestries Reported - French (%)
Ancestries Reported - French Canadian (%)
Ancestries Reported - German (%)
Ancestries Reported - Greek (%)
Ancestries Reported - Hungarian (%)
Ancestries Reported - Irish (%)
Ancestries Reported - Italian (%)
Ancestries Reported - Lithuanian (%)
Ancestries Reported - Norwegian (%)
Ancestries Reported - Polish (%)
Ancestries Reported - Portuguese (%)
Ancestries Reported - Russian (%)
Ancestries Reported - Scotch-Irish (%)
Ancestries Reported - Scottish (%)
Ancestries Reported - Slovak (%)
Ancestries Reported - Subsaharan African (%)
Ancestries Reported - Swedish (%)
Ancestries Reported - Swiss (%)
Ancestries Reported - Ukrainian (%)
Ancestries Reported - United States (%)
Ancestries Reported - Welsh (%)
Ancestries Reported - West Indian (%)
Ancestries Reported - Other (%)
Geographical mobility - Same house 1 year ago (%)
Geographical mobility - Same house 1 year ago (%) - White
Geographical mobility - Same house 1 year ago (%) - Black or African American
Geographical mobility - Same house 1 year ago (%) - Asian
Geographical mobility - Same house 1 year ago (%) - Hispanic or Latino
Geographical mobility - Same house 1 year ago (%) - American Indian and Alaska Native
Geographical mobility - Same house 1 year ago (%) - Multirace
Geographical mobility - Same house 1 year ago (%) - Other Race
Geographical mobility - Moved within same county (%)
Geographical mobility - Moved within same county (%) - White
Geographical mobility - Moved within same county (%) - Black or African American
Geographical mobility - Moved within same county (%) - Asian
Geographical mobility - Moved within same county (%) - Hispanic or Latino
Geographical mobility - Moved within same county (%) - American Indian and Alaska Native
Geographical mobility - Moved within same county (%) - Multirace
Geographical mobility - Moved within same county (%) - Other Race
Geographical mobility - Moved from different county within same state (%)
Geographical mobility - Moved from different county within same state (%) - White
Geographical mobility - Moved from different county within same state (%) - Black or African American
Geographical mobility - Moved from different county within same state (%) - Asian
Geographical mobility - Moved from different county within same state (%) - Hispanic or Latino
Geographical mobility - Moved from different county within same state (%) - American Indian and Alaska Native
Geographical mobility - Moved from different county within same state (%) - Multirace
Geographical mobility - Moved from different county within same state (%) - Other Race
Geographical mobility - Moved from different state (%)
Geographical mobility - Moved from different state (%) - White
Geographical mobility - Moved from different state (%) - Black or African American
Geographical mobility - Moved from different state (%) - Asian
Geographical mobility - Moved from different state (%) - Hispanic or Latino
Geographical mobility - Moved from different state (%) - American Indian and Alaska Native
Geographical mobility - Moved from different state (%) - Multirace
Geographical mobility - Moved from different state (%) - Other Race
Geographical mobility - Moved from abroad (%)
Geographical mobility - Moved from abroad (%) - White
Geographical mobility - Moved from abroad (%) - Black or African American
Geographical mobility - Moved from abroad (%) - Asian
Geographical mobility - Moved from abroad (%) - Hispanic or Latino
Geographical mobility - Moved from abroad (%) - American Indian and Alaska Native
Geographical mobility - Moved from abroad (%) - Multirace
Geographical mobility - Moved from abroad (%) - Other Race
Place of birth for the foreign-born population - Ireland (%)
Place of birth for the foreign-born population - Denmark (%)
Place of birth for the foreign-born population - Norway (%)
Place of birth for the foreign-born population - Sweden (%)
Place of birth for the foreign-born population - United Kingdom (%)
Place of birth for the foreign-born population - England (%)
Place of birth for the foreign-born population - Scotland (%)
Place of birth for the foreign-born population - Other Northern Europe (%)
Place of birth for the foreign-born population - Austria (%)
Place of birth for the foreign-born population - Belgium (%)
Place of birth for the foreign-born population - France (%)
Place of birth for the foreign-born population - Germany (%)
Place of birth for the foreign-born population - Netherlands (%)
Place of birth for the foreign-born population - Switzerland (%)
Place of birth for the foreign-born population - Other Western Europe (%)
Place of birth for the foreign-born population - Greece (%)
Place of birth for the foreign-born population - Italy (%)
Place of birth for the foreign-born population - Portugal (%)
Place of birth for the foreign-born population - Spain (%)
Place of birth for the foreign-born population - Other Southern Europe (%)
Place of birth for the foreign-born population - Albania (%)
Place of birth for the foreign-born population - Belarus (%)
Place of birth for the foreign-born population - Bosnia and Herzegovina (%)
Place of birth for the foreign-born population - Bulgaria (%)
Place of birth for the foreign-born population - Croatia (%)
Place of birth for the foreign-born population - Czechoslovakia (%)
Place of birth for the foreign-born population - Hungary (%)
Place of birth for the foreign-born population - Latvia (%)
Place of birth for the foreign-born population - Lithuania (%)
Place of birth for the foreign-born population - North Macedonia (Macedonia) (%)
Place of birth for the foreign-born population - Moldova (%)
Place of birth for the foreign-born population - Poland (%)
Place of birth for the foreign-born population - Romania (%)
Place of birth for the foreign-born population - Russia (%)
Place of birth for the foreign-born population - Serbia (%)
Place of birth for the foreign-born population - Ukraine (%)
Place of birth for the foreign-born population - Other Eastern Europe (%)
Place of birth for the foreign-born population - China (%)
Place of birth for the foreign-born population - Hong Kong (%)
Place of birth for the foreign-born population - Taiwan (%)
Place of birth for the foreign-born population - Japan (%)
Place of birth for the foreign-born population - Korea (%)
Place of birth for the foreign-born population - Other Eastern Asia (%)
Place of birth for the foreign-born population - Afghanistan (%)
Place of birth for the foreign-born population - Bangladesh (%)
Place of birth for the foreign-born population - India (%)
Place of birth for the foreign-born population - Iran (%)
Place of birth for the foreign-born population - Kazakhstan (%)
Place of birth for the foreign-born population - Nepal (%)
Place of birth for the foreign-born population - Pakistan (%)
Place of birth for the foreign-born population - Sri Lanka (%)
Place of birth for the foreign-born population - Uzbekistan (%)
Place of birth for the foreign-born population - Other South Central Asia (%)
Place of birth for the foreign-born population - Burma (%)
Place of birth for the foreign-born population - Cambodia (%)
Place of birth for the foreign-born population - Indonesia (%)
Place of birth for the foreign-born population - Laos (%)
Place of birth for the foreign-born population - Malaysia (%)
Place of birth for the foreign-born population - Philippines (%)
Place of birth for the foreign-born population - Singapore (%)
Place of birth for the foreign-born population - Thailand (%)
Place of birth for the foreign-born population - Vietnam (%)
Place of birth for the foreign-born population - Other South Eastern Asia (%)
Place of birth for the foreign-born population - Armenia (%)
Place of birth for the foreign-born population - Iraq (%)
Place of birth for the foreign-born population - Israel (%)
Place of birth for the foreign-born population - Jordan (%)
Place of birth for the foreign-born population - Kuwait (%)
Place of birth for the foreign-born population - Lebanon (%)
Place of birth for the foreign-born population - Saudi Arabia (%)
Place of birth for the foreign-born population - Syria (%)
Place of birth for the foreign-born population - Turkey (%)
Place of birth for the foreign-born population - Yemen (%)
Place of birth for the foreign-born population - Other Western Asia (%)
Place of birth for the foreign-born population - Eritrea (%)
Place of birth for the foreign-born population - Ethiopia (%)
Place of birth for the foreign-born population - Kenya (%)
Place of birth for the foreign-born population - Somalia (%)
Place of birth for the foreign-born population - Uganda (%)
Place of birth for the foreign-born population - Zimbabwe (%)
Place of birth for the foreign-born population - Other Eastern Africa (%)
Place of birth for the foreign-born population - Cameroon (%)
Place of birth for the foreign-born population - Congo (%)
Place of birth for the foreign-born population - Democratic Republic of Congo (Zaire) (%)
Place of birth for the foreign-born population - Other Middle Africa (%)
Place of birth for the foreign-born population - Egypt (%)
Place of birth for the foreign-born population - Morocco (%)
Place of birth for the foreign-born population - Sudan (%)
Place of birth for the foreign-born population - Other Northern Africa (%)
Place of birth for the foreign-born population - South Africa (%)
Place of birth for the foreign-born population - Other Southern Africa (%)
Place of birth for the foreign-born population - Cabo Verde (%)
Place of birth for the foreign-born population - Ghana (%)
Place of birth for the foreign-born population - Liberia (%)
Place of birth for the foreign-born population - Nigeria (%)
Place of birth for the foreign-born population - Senegal (%)
Place of birth for the foreign-born population - Sierra Leone (%)
Place of birth for the foreign-born population - Other Western Africa (%)
Place of birth for the foreign-born population - Australia (%)
Place of birth for the foreign-born population - New Zealand (%)
Place of birth for the foreign-born population - Fiji (%)
Place of birth for the foreign-born population - Micronesia (%)
Place of birth for the foreign-born population - Bahamas (%)
Place of birth for the foreign-born population - Barbados (%)
Place of birth for the foreign-born population - Cuba (%)
Place of birth for the foreign-born population - Dominica (%)
Place of birth for the foreign-born population - Dominican Republic (%)
Place of birth for the foreign-born population - Grenada (%)
Place of birth for the foreign-born population - Haiti (%)
Place of birth for the foreign-born population - Jamaica (%)
Place of birth for the foreign-born population - St. Vincent and the Grenadines (%)
Place of birth for the foreign-born population - Trinidad and Tobago (%)
Place of birth for the foreign-born population - West Indies (%)
Place of birth for the foreign-born population - Other Caribbean (%)
Place of birth for the foreign-born population - Belize (%)
Place of birth for the foreign-born population - Costa Rica (%)
Place of birth for the foreign-born population - El Salvador (%)
Place of birth for the foreign-born population - Guatemala (%)
Place of birth for the foreign-born population - Honduras (%)
Place of birth for the foreign-born population - Mexico (%)
Place of birth for the foreign-born population - Nicaragua (%)
Place of birth for the foreign-born population - Panama (%)
Place of birth for the foreign-born population - Other Central America (%)
Place of birth for the foreign-born population - Argentina (%)
Place of birth for the foreign-born population - Bolivia (%)
Place of birth for the foreign-born population - Brazil (%)
Place of birth for the foreign-born population - Chile (%)
Place of birth for the foreign-born population - Colombia (%)
Place of birth for the foreign-born population - Ecuador (%)
Place of birth for the foreign-born population - Guyana (%)
Place of birth for the foreign-born population - Peru (%)
Place of birth for the foreign-born population - Uruguay (%)
Place of birth for the foreign-born population - Venezuela (%)
Place of birth for the foreign-born population - Other South America (%)
Place of birth for the foreign-born population - Canada (%)
Place of birth for the foreign-born population - Other Northern America (%)
Place of birth for the foreign-born population - Other (%)
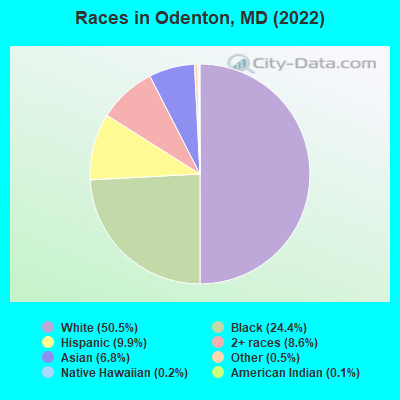
According to 2022 data, the most numerous races in Odenton, MD are White alone (22,919 residents), Black alone (11,069 residents), and Hispanic (4,499 residents). 83.7% of Odenton residents speak English at home. 10.7% of Odenton, MD residents are foreign-born (4.6% born in Asia, 2.3% born in Latin America, 1.5% born in Europe, 1.5% born in Africa), which is 49.1% less than the foreign-born rate of 16.0% across the entire state of Maryland.
Race distribution in Odenton
2000 2022
3,286,547 62.1% White alone 1,464,735 27.7% Black alone 227,916 4.3% Hispanic 209,738 4.0% Asian alone 82,946 1.6% Two or more races 13,312 0.3% American Indian alone 9,379 0.2% Other race alone 1,913 0.04% Native Hawaiian and Other
2,906,492 47.1% White alone 1,800,914 29.2% Black alone 705,842 11.4% Hispanic 401,818 6.5% Asian alone 291,317 4.7% Two or more races 46,930 0.8% Other race alone 8,930 0.1% American Indian alone 2,417 0.04% Native Hawaiian and Other
Income and house value in Odenton Median household income in 2022 $117,894 White non-Hispanic householders$101,948 Black householders$106,781 Asian householders$169,760 Some other race householders$116,869 Two or more races householders$177,446 Hispanic or Latino race householdersMedian 2022 house value $420,186 White Non-Hispanic householders$429,332 Black or African American householders$381,105 American Indian or Alaska Native householders $376,670 Asian householders$724,516 Some other race householders$433,213 Two or more races householders$437,925 Hispanic or Latino householders
Median age by race in Odenton
40.2 Median age for White residents39.1 41.8 37.5 Median age for Black or African American residents33.2 39.6 54.7 Median age for American Indian / Alaska Native residents44.2 -1,072,276,158.6 38.6 Median age for Asian residents29.4 39.4 -534,101,824.6 Median age for Native Hawaiian / Pacific Islander residents-720,061,021.4 -760,942,760.2 39.6 Median age for Other race residents35.0 38.7 25.2 Median age for Two or more races residents16.6 30.4 40.3 Median age for White alone residents39.1 41.4 29.8 Median age for Hispanic or Latino residents29.6 30.3
Owner/renter occupied households by race in Odenton
House owners and renters - White residents 7,263 68.4% Owner occupied3,362 31.6% Renter occupiedHouse owners and renters - Black or African American residents 2,933 56.7% Owner occupied2,236 43.3% Renter occupiedHouse owners and renters - American Indian / Alaska Native residents 1 100.0% Owner occupiedHouse owners and renters - Asian residents 674 77.6% Owner occupied195 22.4% Renter occupiedHouse owners and renters - Other race residents 261 94.3% Owner occupied16 5.7% Renter occupiedHouse owners and renters - Two or more races residents 952 57.1% Owner occupied715 42.9% Renter occupiedHouse owners and renters - White alone residents 7,074 68.1% Owner occupied3,317 31.9% Renter occupiedHouse owners and renters - Hispanic or Latino residents 724 73.8% Owner occupied257 26.2% Renter occupied
Language usage in Odenton
English speakers - Total 83.7% of residents of Odenton speak English at home.
6.9% of residents speak Spanish at home 2,151 71.5% Speak English very well857 28.5% Speak English less than very well9.5% of residents speak other language at home 3,173 76.5% Speak English very well975 23.5% Speak English less than very well
English speakers - Born in the United States 91.7% of residents of Odenton speak English at home.
4.3% of residents speak Spanish at home 655 66.8% Speak English very well326 33.2% Speak English less than very well3.9% of residents speak other language at home 808 90.1% Speak English very well89 9.9% Speak English less than very well
English speakers - Native, born elsewhere 49.0% of residents of Odenton speak English at home.
46.9% of residents speak Spanish at home 707 98.9% Speak English very well8 1.1% Speak English less than very well9.5% of residents speak other language at home 145 100.0% Speak English very well
English speakers - Foreign-born 25.9% of residents of Odenton speak English at home.
13.7% of residents speak Spanish at home 443 68.5% Speak English very well204 31.5% Speak English less than very well58.1% of residents speak other language at home 2,054 74.8% Speak English very well693 25.2% Speak English less than very well
White (Caucasian) - Speak only English Native:
95.4% (21,172)Foreign-born:
46.0% (183)
White (Caucasian) - Speak another language Native:
4.1% (906)Foreign-born:
55.2% (219)
Black or African American - Speak only English Native:
94.5% (9,204)Foreign-born:
32.3% (407)
Black or African American - Speak another language Native:
5.6% (549)Foreign-born:
69.0% (869)
American Indian / Alaska Native - Speak only English Native:
80.3% (48)Foreign-born:
42.1% (12)
Asian - Speak only English Native:
54.1% (354)Foreign-born:
25.9% (587)
Asian - Speak another language Native:
46.1% (302)Foreign-born:
73.0% (1,652)
Other race - Speak only English Native:
51.8% (602)Foreign-born:
2.8% (11)
Other race - Speak another language Native:
46.4% (539)Foreign-born:
100.0% (410)
Two or more races - Speak only English Native:
72.2% (4,178)Foreign-born:
35.7% (221)
Two or more races - Speak another language Native:
31.9% (1,843)Foreign-born:
68.4% (423)
White alone - Speak only English Native:
96.7% (20,887)Foreign-born:
39.2% (186)
White alone - Speak another language Native:
3.1% (678)Foreign-born:
60.8% (288)
Hispanic or Latino - Speak only English Native:
43.3% (1,551)Foreign-born:
5.3% (42)
Hispanic or Latino - Speak another language Native:
56.2% (2,010)Foreign-born:
96.2% (765)
Foreign-born residents in Odenton 4,873 residents are foreign born (4.6% Asia , 2.3% Latin America , 1.5% Europe , 1.5% Africa ).
This city:
10.7%Maryland:
15.7%
Marital status for residents in Odenton Marital status - White (Caucasian) population 15 years and over
Males 30.9% Never married55.3% Now married0.9% Separated2.2% Widowed10.7% DivorcedFemales 25.1% Never married50.5% Now married1.8% Separated8.4% Widowed14.1% DivorcedWomen who gave birth in the past 12 months Now married:
97.8% (299)Unmarried:
2.2% (7)
Women who did not give birth in the past 12 months Now married:
50.8% (2,902)Unmarried:
49.2% (2,814)
Marital status - Black or African American population 15 years and over
Males 54.7% Never married41.5% Now married0.0% Separated0.9% Widowed3.0% DivorcedFemales 39.8% Never married34.1% Now married4.5% Separated4.2% Widowed17.4% DivorcedWomen who gave birth in the past 12 months Now married:
100.0% (64)Unmarried:
0.0% (0)
Women who did not give birth in the past 12 months Now married:
30.5% (891)Unmarried:
69.5% (2,027)
Marital status - American Indian / Alaska Native population 15 years and over
Males 0.0% Never married98.1% Now married0.0% Separated0.0% Widowed1.9% DivorcedFemales 100.0% Never married0.0% Now married0.0% Separated0.0% Widowed0.0% DivorcedWomen who did not give birth in the past 12 months Now married:
0.0% (0)Unmarried:
100.0% (16)
Marital status - Asian population 15 years and over
Males 47.5% Never married50.9% Now married0.0% Separated0.0% Widowed1.5% DivorcedFemales 24.6% Never married52.5% Now married1.2% Separated7.6% Widowed14.2% DivorcedWomen who gave birth in the past 12 months Now married:
89.2% (66)Unmarried:
10.8% (8)
Women who did not give birth in the past 12 months Now married:
47.9% (463)Unmarried:
52.1% (503)
Marital status - Other race population 15 years and over
Males 27.8% Never married62.0% Now married0.0% Separated0.0% Widowed10.1% DivorcedFemales 1.3% Never married93.7% Now married0.0% Separated0.0% Widowed5.0% DivorcedWomen who gave birth in the past 12 months Now married:
100.0% (189)Unmarried:
0.0% (0)
Women who did not give birth in the past 12 months Now married:
91.0% (471)Unmarried:
9.0% (46)
Marital status - Two or more races population 15 years and over
Males 36.2% Never married50.2% Now married0.0% Separated1.7% Widowed11.9% DivorcedFemales 35.8% Never married46.6% Now married0.3% Separated2.5% Widowed14.9% DivorcedWomen who gave birth in the past 12 months Now married:
47.1% (33)Unmarried:
52.9% (37)
Women who did not give birth in the past 12 months Now married:
40.8% (784)Unmarried:
59.2% (1,137)
Marital status - White alone, not Hispanic / Latino population 15 years and over
Males 30.9% Never married54.7% Now married1.0% Separated2.3% Widowed11.1% DivorcedFemales 24.5% Never married50.7% Now married1.8% Separated8.5% Widowed14.5% DivorcedWomen who gave birth in the past 12 months Now married:
97.8% (307)Unmarried:
2.2% (7)
Women who did not give birth in the past 12 months Now married:
50.9% (2,867)Unmarried:
49.1% (2,766)
Marital status - Hispanic or Latino population 15 years and over
Males 26.5% Never married60.0% Now married0.0% Separated0.7% Widowed12.9% DivorcedFemales 23.6% Never married62.9% Now married0.9% Separated1.3% Widowed11.4% DivorcedWomen who gave birth in the past 12 months Now married:
100.0% (190)Unmarried:
0.0% (0)
Women who did not give birth in the past 12 months Now married:
55.5% (778)Unmarried:
44.5% (625)
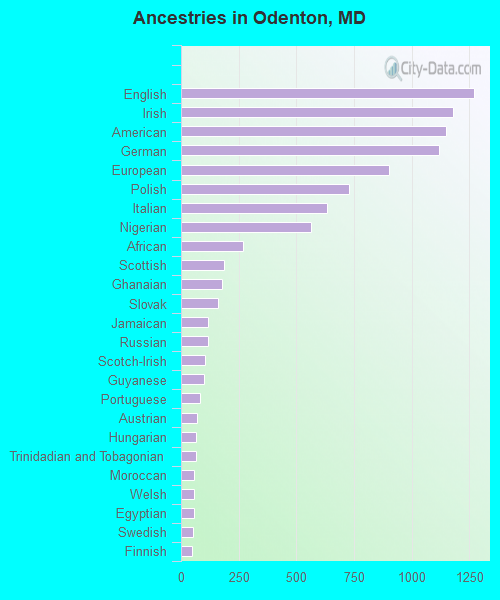
Ancestries in Odenton
1,271 6.3% English1,179 5.8% Irish1,147 5.7% American1,116 5.5% German903 4.5% European729 3.6% Polish634 3.1% Italian565 2.8% Nigerian267 1.3% African185 0.9% Scottish179 0.9% Ghanaian160 0.8% Slovak118 0.6% Jamaican116 0.6% Russian102 0.5% Scotch-Irish100 0.5% Guyanese82 0.4% Portuguese68 0.3% Austrian67 0.3% Hungarian65 0.3% Trinidadian and Tobagonian58 0.3% Moroccan57 0.3% Welsh56 0.3% Egyptian52 0.3% Swedish49 0.2% Finnish43 0.2% Swiss41 0.2% French40 0.2% British38 0.2% Palestinian35 0.2% Dutch32 0.2% Slovene25 0.1% Bulgarian24 0.1% Brazilian22 0.1% Norwegian19 0.09% Lithuanian16 0.08% French Canadian16 0.08% Cape Verdean15 0.07% Czechoslovakian11 0.05% Ukrainian3 0.01% Canadian
Geographical mobility in Odenton Same house 1 year ago 19,291 82.8% White (Caucasian)10,208 89.1% Black or African American40 43.3% American Indian / Alaska Native2,215 72.6% Asian64 100.0% Native Hawaiian / Pacific Islander1,197 73.9% Other race5,593 83.1% Two or more races18,837 82.7% White alone, not Hispanic / Latino3,589 79.7% Hispanic or LatinoMoved within same county 2,341 10.0% White / Caucasian798 7.0% Black or African American52 55.8% American Indian / Alaska Native94 3.1% Asian510 7.6% Two or more races2,202 9.7% White alone, not Hispanic / Latino395 8.8% Hispanic or LatinoMoved within same state 520 2.2% White / Caucasian211 1.8% Black or African American247 8.1% Asian38 2.4% Other race109 1.6% Two or more races563 2.5% White alone, not Hispanic / Latino57 1.3% Hispanic or LatinoMoved from different state 1,016 4.4% White / Caucasian260 2.3% Black or African American191 6.3% Asian155 9.6% Other race271 4.0% Two or more races1,008 4.4% White alone, not Hispanic / Latino309 6.9% Hispanic or LatinoMoved from abroad 141 0.6% White46 1.5% Asian195 2.9% Two or more races152 0.7% White alone, not Hispanic / Latino68 1.5% Hispanic or Latino
Children Nativity (place of birth) in Odenton
Children under 6 years - Living with two parents Both parents native 1,233 100.0% NativeBoth parents foreign-born 218 100.0% NativeOne native, one foreign-born parent 131 100.0% NativeChildren under 6 years - Living with one parent Native parent 532 100.0% NativeChildren 6 to 17 years - Living with two parents Both parents native 4,376 98.3% Native75 1.7% Foreign-bornBoth parents foreign-born 784 85.9% Native129 14.1% Foreign-bornOne native, one foreign-born parent 602 95.6% Native27 4.4% Foreign-bornChildren 6 to 17 years - Living with one parent Native parent 1,953 100.0% NativeForeign-born parent 168 52.0% Native156 48.0% Foreign-born
Grandparents responsible for own grandchildren in Odenton
Grandparents (30 to 59 years) White / Caucasian 22 27.7% Responsible for grandchildren58 72.3% Not responsible for grandchildrenBlack or African American 74 81.0% Responsible for grandchildren17 19.0% Not responsible for grandchildrenAsian 59 100.0% Not responsible for grandchildrenTwo or more races 5 100.0% Not responsible for grandchildrenWhite alone, not Hispanic / Latino 22 27.1% Responsible for grandchildren59 72.9% Not responsible for grandchildrenGrandparents (60 years and over) White / Caucasian 6 2.4% Responsible for grandchildren230 97.6% Not responsible for grandchildrenBlack or African American 106 41.9% Responsible for grandchildren147 58.1% Not responsible for grandchildrenAsian 32 37.2% Responsible for grandchildren54 62.8% Not responsible for grandchildrenTwo or more races 209 100.0% Not responsible for grandchildrenWhite alone, not Hispanic / Latino 6 2.6% Responsible for grandchildren222 97.4% Not responsible for grandchildren