Races in Ocean City, New Jersey (NJ) Detailed Stats
Data:
Races - White alone (%)
Races - White alone (% change since 2000)
Races - Black alone (%)
Races - Black alone (% change since 2000)
Races - American Indian alone (%)
Races - American Indian alone (% change since 2000)
Races - Asian alone (%)
Races - Asian alone (% change since 2000)
Races - Hispanic (%)
Races - Hispanic (% change since 2000)
Races - Native Hawaiian and Other Pacific Islander alone (%)
Races - Native Hawaiian and Other Pacific Islander alone (% change since 2000)
Races - Two or more races(%)
Races - Two or more races(% change since 2000)
Races - Other race alone (%)
Races - Other race alone (% change since 2000)
Racial diversity
Place of birth - Born in state of residence (%)
Place of birth - Born in state of residence (%) - White
Place of birth - Born in state of residence (%) - Black or African American
Place of birth - Born in state of residence (%) - Asian
Place of birth - Born in state of residence (%) - Hispanic or Latino
Place of birth - Born in state of residence (%) - American Indian and Alaska Native
Place of birth - Born in state of residence (%) - Multirace
Place of birth - Born in state of residence (%) - Other Race
Place of birth - Born in other state (%)
Place of birth - Born in other state (%) - White
Place of birth - Born in other state (%) - Black or African American
Place of birth - Born in other state (%) - Asian
Place of birth - Born in other state (%) - Hispanic or Latino
Place of birth - Born in other state (%) - American Indian and Alaska Native
Place of birth - Born in other state (%) - Multirace
Place of birth - Born in other state (%) - Other Race
Place of birth - Native, outside of US (%)
Place of birth - Native, outside of US (%) - White
Place of birth - Native, outside of US (%) - Black or African American
Place of birth - Native, outside of US (%) - Asian
Place of birth - Native, outside of US (%) - Hispanic or Latino
Place of birth - Native, outside of US (%) - American Indian and Alaska Native
Place of birth - Native, outside of US (%) - Multirace
Place of birth - Native, outside of US (%) - Other Race
Place of birth - Foreign born (%)
Place of birth - Foreign born (%) - White
Place of birth - Foreign born (%) - Black or African American
Place of birth - Foreign born (%) - Asian
Place of birth - Foreign born (%) - Hispanic or Latino
Place of birth - Foreign born (%) - American Indian and Alaska Native
Place of birth - Foreign born (%) - Multirace
Place of birth - Foreign born (%) - Other Race
Residents speaking English at home (%)
Residents speaking English at home - Born in the United States (%)
Residents speaking English at home - Native, born elsewhere (%)
Residents speaking English at home - Foreign born (%)
Residents speaking Spanish at home (%)
Residents speaking Spanish at home - Born in the United States (%)
Residents speaking Spanish at home - Native, born elsewhere (%)
Residents speaking Spanish at home - Foreign born (%)
Residents speaking other language at home (%)
Residents speaking other language at home - Born in the United States (%)
Residents speaking other language at home - Native, born elsewhere (%)
Residents speaking other language at home - Foreign born (%)
Marital status - Never married (%)
Marital status - Now married (%)
Marital status - Separated (%)
Marital status - Widowed (%)
Marital status - Divorced (%)
Ancestries Reported - Arab (%)
Ancestries Reported - Czech (%)
Ancestries Reported - Danish (%)
Ancestries Reported - Dutch (%)
Ancestries Reported - English (%)
Ancestries Reported - French (%)
Ancestries Reported - French Canadian (%)
Ancestries Reported - German (%)
Ancestries Reported - Greek (%)
Ancestries Reported - Hungarian (%)
Ancestries Reported - Irish (%)
Ancestries Reported - Italian (%)
Ancestries Reported - Lithuanian (%)
Ancestries Reported - Norwegian (%)
Ancestries Reported - Polish (%)
Ancestries Reported - Portuguese (%)
Ancestries Reported - Russian (%)
Ancestries Reported - Scotch-Irish (%)
Ancestries Reported - Scottish (%)
Ancestries Reported - Slovak (%)
Ancestries Reported - Subsaharan African (%)
Ancestries Reported - Swedish (%)
Ancestries Reported - Swiss (%)
Ancestries Reported - Ukrainian (%)
Ancestries Reported - United States (%)
Ancestries Reported - Welsh (%)
Ancestries Reported - West Indian (%)
Ancestries Reported - Other (%)
Geographical mobility - Same house 1 year ago (%)
Geographical mobility - Same house 1 year ago (%) - White
Geographical mobility - Same house 1 year ago (%) - Black or African American
Geographical mobility - Same house 1 year ago (%) - Asian
Geographical mobility - Same house 1 year ago (%) - Hispanic or Latino
Geographical mobility - Same house 1 year ago (%) - American Indian and Alaska Native
Geographical mobility - Same house 1 year ago (%) - Multirace
Geographical mobility - Same house 1 year ago (%) - Other Race
Geographical mobility - Moved within same county (%)
Geographical mobility - Moved within same county (%) - White
Geographical mobility - Moved within same county (%) - Black or African American
Geographical mobility - Moved within same county (%) - Asian
Geographical mobility - Moved within same county (%) - Hispanic or Latino
Geographical mobility - Moved within same county (%) - American Indian and Alaska Native
Geographical mobility - Moved within same county (%) - Multirace
Geographical mobility - Moved within same county (%) - Other Race
Geographical mobility - Moved from different county within same state (%)
Geographical mobility - Moved from different county within same state (%) - White
Geographical mobility - Moved from different county within same state (%) - Black or African American
Geographical mobility - Moved from different county within same state (%) - Asian
Geographical mobility - Moved from different county within same state (%) - Hispanic or Latino
Geographical mobility - Moved from different county within same state (%) - American Indian and Alaska Native
Geographical mobility - Moved from different county within same state (%) - Multirace
Geographical mobility - Moved from different county within same state (%) - Other Race
Geographical mobility - Moved from different state (%)
Geographical mobility - Moved from different state (%) - White
Geographical mobility - Moved from different state (%) - Black or African American
Geographical mobility - Moved from different state (%) - Asian
Geographical mobility - Moved from different state (%) - Hispanic or Latino
Geographical mobility - Moved from different state (%) - American Indian and Alaska Native
Geographical mobility - Moved from different state (%) - Multirace
Geographical mobility - Moved from different state (%) - Other Race
Geographical mobility - Moved from abroad (%)
Geographical mobility - Moved from abroad (%) - White
Geographical mobility - Moved from abroad (%) - Black or African American
Geographical mobility - Moved from abroad (%) - Asian
Geographical mobility - Moved from abroad (%) - Hispanic or Latino
Geographical mobility - Moved from abroad (%) - American Indian and Alaska Native
Geographical mobility - Moved from abroad (%) - Multirace
Geographical mobility - Moved from abroad (%) - Other Race
Place of birth for the foreign-born population - Ireland (%)
Place of birth for the foreign-born population - Denmark (%)
Place of birth for the foreign-born population - Norway (%)
Place of birth for the foreign-born population - Sweden (%)
Place of birth for the foreign-born population - United Kingdom (%)
Place of birth for the foreign-born population - England (%)
Place of birth for the foreign-born population - Scotland (%)
Place of birth for the foreign-born population - Other Northern Europe (%)
Place of birth for the foreign-born population - Austria (%)
Place of birth for the foreign-born population - Belgium (%)
Place of birth for the foreign-born population - France (%)
Place of birth for the foreign-born population - Germany (%)
Place of birth for the foreign-born population - Netherlands (%)
Place of birth for the foreign-born population - Switzerland (%)
Place of birth for the foreign-born population - Other Western Europe (%)
Place of birth for the foreign-born population - Greece (%)
Place of birth for the foreign-born population - Italy (%)
Place of birth for the foreign-born population - Portugal (%)
Place of birth for the foreign-born population - Spain (%)
Place of birth for the foreign-born population - Other Southern Europe (%)
Place of birth for the foreign-born population - Albania (%)
Place of birth for the foreign-born population - Belarus (%)
Place of birth for the foreign-born population - Bosnia and Herzegovina (%)
Place of birth for the foreign-born population - Bulgaria (%)
Place of birth for the foreign-born population - Croatia (%)
Place of birth for the foreign-born population - Czechoslovakia (%)
Place of birth for the foreign-born population - Hungary (%)
Place of birth for the foreign-born population - Latvia (%)
Place of birth for the foreign-born population - Lithuania (%)
Place of birth for the foreign-born population - North Macedonia (Macedonia) (%)
Place of birth for the foreign-born population - Moldova (%)
Place of birth for the foreign-born population - Poland (%)
Place of birth for the foreign-born population - Romania (%)
Place of birth for the foreign-born population - Russia (%)
Place of birth for the foreign-born population - Serbia (%)
Place of birth for the foreign-born population - Ukraine (%)
Place of birth for the foreign-born population - Other Eastern Europe (%)
Place of birth for the foreign-born population - China (%)
Place of birth for the foreign-born population - Hong Kong (%)
Place of birth for the foreign-born population - Taiwan (%)
Place of birth for the foreign-born population - Japan (%)
Place of birth for the foreign-born population - Korea (%)
Place of birth for the foreign-born population - Other Eastern Asia (%)
Place of birth for the foreign-born population - Afghanistan (%)
Place of birth for the foreign-born population - Bangladesh (%)
Place of birth for the foreign-born population - India (%)
Place of birth for the foreign-born population - Iran (%)
Place of birth for the foreign-born population - Kazakhstan (%)
Place of birth for the foreign-born population - Nepal (%)
Place of birth for the foreign-born population - Pakistan (%)
Place of birth for the foreign-born population - Sri Lanka (%)
Place of birth for the foreign-born population - Uzbekistan (%)
Place of birth for the foreign-born population - Other South Central Asia (%)
Place of birth for the foreign-born population - Burma (%)
Place of birth for the foreign-born population - Cambodia (%)
Place of birth for the foreign-born population - Indonesia (%)
Place of birth for the foreign-born population - Laos (%)
Place of birth for the foreign-born population - Malaysia (%)
Place of birth for the foreign-born population - Philippines (%)
Place of birth for the foreign-born population - Singapore (%)
Place of birth for the foreign-born population - Thailand (%)
Place of birth for the foreign-born population - Vietnam (%)
Place of birth for the foreign-born population - Other South Eastern Asia (%)
Place of birth for the foreign-born population - Armenia (%)
Place of birth for the foreign-born population - Iraq (%)
Place of birth for the foreign-born population - Israel (%)
Place of birth for the foreign-born population - Jordan (%)
Place of birth for the foreign-born population - Kuwait (%)
Place of birth for the foreign-born population - Lebanon (%)
Place of birth for the foreign-born population - Saudi Arabia (%)
Place of birth for the foreign-born population - Syria (%)
Place of birth for the foreign-born population - Turkey (%)
Place of birth for the foreign-born population - Yemen (%)
Place of birth for the foreign-born population - Other Western Asia (%)
Place of birth for the foreign-born population - Eritrea (%)
Place of birth for the foreign-born population - Ethiopia (%)
Place of birth for the foreign-born population - Kenya (%)
Place of birth for the foreign-born population - Somalia (%)
Place of birth for the foreign-born population - Uganda (%)
Place of birth for the foreign-born population - Zimbabwe (%)
Place of birth for the foreign-born population - Other Eastern Africa (%)
Place of birth for the foreign-born population - Cameroon (%)
Place of birth for the foreign-born population - Congo (%)
Place of birth for the foreign-born population - Democratic Republic of Congo (Zaire) (%)
Place of birth for the foreign-born population - Other Middle Africa (%)
Place of birth for the foreign-born population - Egypt (%)
Place of birth for the foreign-born population - Morocco (%)
Place of birth for the foreign-born population - Sudan (%)
Place of birth for the foreign-born population - Other Northern Africa (%)
Place of birth for the foreign-born population - South Africa (%)
Place of birth for the foreign-born population - Other Southern Africa (%)
Place of birth for the foreign-born population - Cabo Verde (%)
Place of birth for the foreign-born population - Ghana (%)
Place of birth for the foreign-born population - Liberia (%)
Place of birth for the foreign-born population - Nigeria (%)
Place of birth for the foreign-born population - Senegal (%)
Place of birth for the foreign-born population - Sierra Leone (%)
Place of birth for the foreign-born population - Other Western Africa (%)
Place of birth for the foreign-born population - Australia (%)
Place of birth for the foreign-born population - New Zealand (%)
Place of birth for the foreign-born population - Fiji (%)
Place of birth for the foreign-born population - Micronesia (%)
Place of birth for the foreign-born population - Bahamas (%)
Place of birth for the foreign-born population - Barbados (%)
Place of birth for the foreign-born population - Cuba (%)
Place of birth for the foreign-born population - Dominica (%)
Place of birth for the foreign-born population - Dominican Republic (%)
Place of birth for the foreign-born population - Grenada (%)
Place of birth for the foreign-born population - Haiti (%)
Place of birth for the foreign-born population - Jamaica (%)
Place of birth for the foreign-born population - St. Vincent and the Grenadines (%)
Place of birth for the foreign-born population - Trinidad and Tobago (%)
Place of birth for the foreign-born population - West Indies (%)
Place of birth for the foreign-born population - Other Caribbean (%)
Place of birth for the foreign-born population - Belize (%)
Place of birth for the foreign-born population - Costa Rica (%)
Place of birth for the foreign-born population - El Salvador (%)
Place of birth for the foreign-born population - Guatemala (%)
Place of birth for the foreign-born population - Honduras (%)
Place of birth for the foreign-born population - Mexico (%)
Place of birth for the foreign-born population - Nicaragua (%)
Place of birth for the foreign-born population - Panama (%)
Place of birth for the foreign-born population - Other Central America (%)
Place of birth for the foreign-born population - Argentina (%)
Place of birth for the foreign-born population - Bolivia (%)
Place of birth for the foreign-born population - Brazil (%)
Place of birth for the foreign-born population - Chile (%)
Place of birth for the foreign-born population - Colombia (%)
Place of birth for the foreign-born population - Ecuador (%)
Place of birth for the foreign-born population - Guyana (%)
Place of birth for the foreign-born population - Peru (%)
Place of birth for the foreign-born population - Uruguay (%)
Place of birth for the foreign-born population - Venezuela (%)
Place of birth for the foreign-born population - Other South America (%)
Place of birth for the foreign-born population - Canada (%)
Place of birth for the foreign-born population - Other Northern America (%)
Place of birth for the foreign-born population - Other (%)
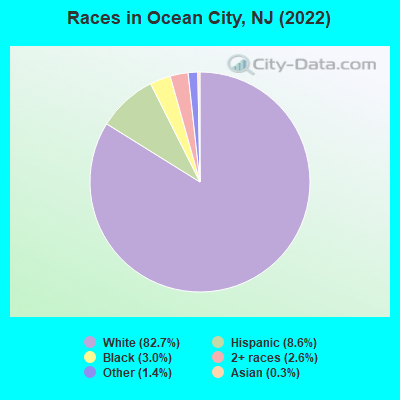
According to 2022 data, the most numerous races in Ocean City, NJ are White alone (9,330 residents), Hispanic (975 residents), and Black alone (340 residents). 87.4% of Ocean City residents speak English at home. 4.6% of Ocean City, NJ residents are foreign-born (2.6% born in Latin America, 1.6% born in Europe), which is 404.8% less than the foreign-born rate of 23.0% across the entire state of New Jersey.
Race distribution in Ocean City
2000 2022
5,557,209 66.0% White alone 1,117,191 13.3% Hispanic 1,096,171 13.0% Black alone 477,012 5.7% Asian alone 133,689 1.6% Two or more races 19,565 0.2% Other race alone 11,338 0.1% American Indian alone 2,175 0.03% Native Hawaiian and Other
4,766,476 51.5% White alone 2,028,470 21.9% Hispanic 1,111,632 12.0% Black alone 923,546 10.0% Asian alone 332,237 3.6% Two or more races 89,847 1.0% Other race alone 8,557 0.09% American Indian alone 934 0.01% Native Hawaiian and Other
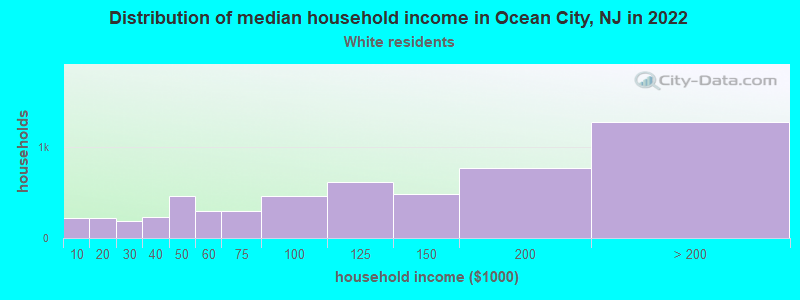
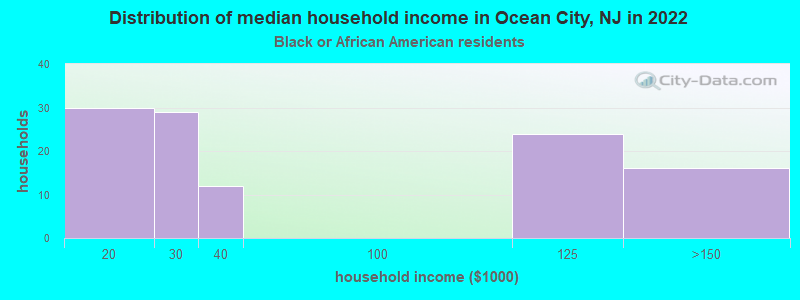
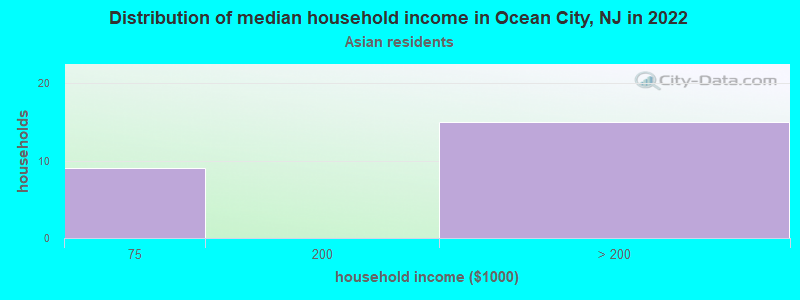
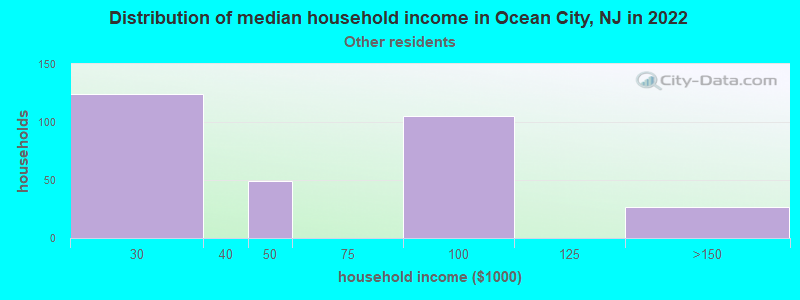
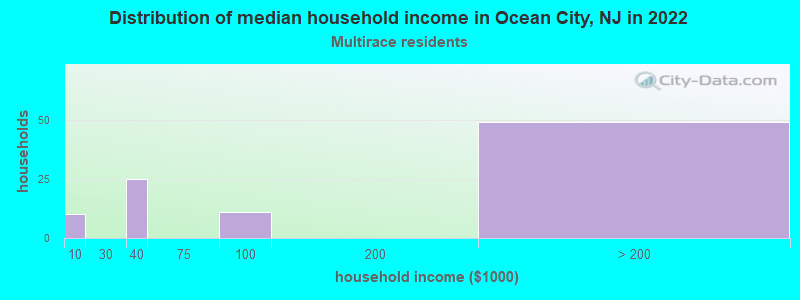
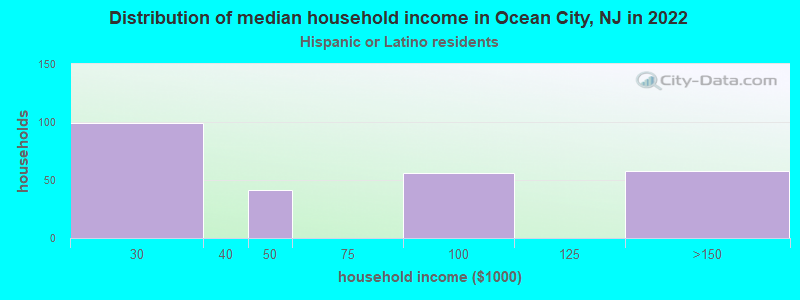
Income and house value in Ocean City Median household income in 2022 $109,669 White non-Hispanic householdersover $200,000 Asian householdersMedian 2022 house value $848,553 White Non-Hispanic householders$460,749 Black or African American householders$631,204 Two or more races householders$505,038 Hispanic or Latino householders
Median age by race in Ocean City
62.7 Median age for White residents62.5 62.4 40.8 Median age for Black or African American residents60.1 35.9 -676,272,813.9 Median age for American Indian / Alaska Native residents-666,666,666.0 -688,298,917.7 37.9 Median age for Asian residents-365,805,168.6 38.8 -666,666,666.0 Median age for Native Hawaiian / Pacific Islander residents-666,666,666.0 -666,666,666.0 39.8 Median age for Other race residents21.9 40.0 25.0 Median age for Two or more races residents26.2 26.7 62.0 Median age for White alone residents61.2 61.9 21.3 Median age for Hispanic or Latino residents21.1 20.8
Owner/renter occupied households by race in Ocean City
House owners and renters - White residents 3,940 71.3% Owner occupied1,586 28.7% Renter occupiedHouse owners and renters - Black or African American residents 61 52.5% Owner occupied55 47.5% Renter occupiedHouse owners and renters - Asian residents 24 100.0% Owner occupiedHouse owners and renters - Other race residents 185 60.8% Owner occupied119 39.2% Renter occupiedHouse owners and renters - Two or more races residents 84 71.7% Owner occupied33 28.3% Renter occupiedHouse owners and renters - White alone residents 3,942 70.5% Owner occupied1,648 29.5% Renter occupiedHouse owners and renters - Hispanic or Latino residents 124 42.6% Owner occupied167 57.4% Renter occupied
Language usage in Ocean City
English speakers - Total 87.4% of residents of Ocean City speak English at home.
7.0% of residents speak Spanish at home 471 59.9% Speak English very well315 40.1% Speak English less than very well5.0% of residents speak other language at home 551 97.7% Speak English very well13 2.3% Speak English less than very well
English speakers - Born in the United States 93.7% of residents of Ocean City speak English at home.
2.6% of residents speak Spanish at home 172 100.0% Speak English very well1.3% of residents speak other language at home 84 100.0% Speak English very well
English speakers - Native, born elsewhere 21.8% of residents of Ocean City speak English at home.
79.3% of residents speak Spanish at home 87 61.3% Speak English very well55 38.7% Speak English less than very well2.2% of residents speak other language at home 4 100.0% Speak English less than very well
English speakers - Foreign-born 11.2% of residents of Ocean City speak English at home.
50.3% of residents speak Spanish at home 75 26.5% Speak English very well208 73.5% Speak English less than very well36.6% of residents speak other language at home 206 100.0% Speak English very well
White (Caucasian) - Speak only English Native:
95.6% (8,657)Foreign-born:
28.5% (56)
White (Caucasian) - Speak another language Native:
4.4% (398)Foreign-born:
69.0% (135)
Asian - Speak only English Native:
100.0% (24)Foreign-born:
26.9% (3)
Other race - Speak only English Native:
36.5% (243)Foreign-born:
12.9% (46)
Other race - Speak another language Native:
64.1% (426)Foreign-born:
88.2% (311)
White alone - Speak only English Native:
95.6% (8,729)Foreign-born:
22.3% (56)
White alone - Speak another language Native:
4.9% (450)Foreign-born:
77.6% (194)
Hispanic or Latino - Speak only English Native:
26.4% (168)Foreign-born:
11.4% (28)
Hispanic or Latino - Speak another language Native:
74.5% (473)Foreign-born:
92.5% (227)
Foreign-born residents in Ocean City 514 residents are foreign born (2.6% Latin America , 1.6% Europe ).
This city:
4.6%New Jersey:
23.2%
Marital status for residents in Ocean City Marital status - White (Caucasian) population 15 years and over
Males 21.9% Never married66.8% Now married0.6% Separated5.5% Widowed5.1% DivorcedFemales 17.7% Never married55.9% Now married1.0% Separated13.0% Widowed12.4% DivorcedWomen who gave birth in the past 12 months Now married:
100.0% (18)Unmarried:
0.0% (0)
Women who did not give birth in the past 12 months Now married:
43.5% (585)Unmarried:
56.5% (760)
Marital status - Black or African American population 15 years and over
Males 9.7% Never married73.3% Now married16.9% Separated0.0% Widowed0.0% DivorcedFemales 20.7% Never married55.2% Now married0.0% Separated12.6% Widowed11.5% DivorcedWomen who did not give birth in the past 12 months Now married:
65.8% (24)Unmarried:
34.2% (12)
Marital status - Asian population 15 years and over
Males 0.0% Never married57.9% Now married42.1% Separated0.0% Widowed0.0% DivorcedFemales 30.0% Never married40.0% Now married0.0% Separated30.0% Widowed0.0% DivorcedWomen who did not give birth in the past 12 months Now married:
0.0% (0)Unmarried:
100.0% (6)
Marital status - Other race population 15 years and over
Males 60.3% Never married39.7% Now married0.0% Separated0.0% Widowed0.0% DivorcedFemales 16.9% Never married45.1% Now married0.0% Separated12.5% Widowed25.4% DivorcedWomen who did not give birth in the past 12 months Now married:
59.5% (182)Unmarried:
40.5% (124)
Marital status - Two or more races population 15 years and over
Males 68.4% Never married31.6% Now married0.0% Separated0.0% Widowed0.0% DivorcedFemales 47.7% Never married32.1% Now married0.0% Separated0.0% Widowed20.2% DivorcedWomen who did not give birth in the past 12 months Now married:
9.6% (7)Unmarried:
90.4% (67)
Marital status - White alone, not Hispanic / Latino population 15 years and over
Males 22.0% Never married66.6% Now married0.6% Separated5.6% Widowed5.2% DivorcedFemales 17.3% Never married56.0% Now married1.0% Separated13.1% Widowed12.5% DivorcedWomen who gave birth in the past 12 months Now married:
100.0% (18)Unmarried:
0.0% (0)
Women who did not give birth in the past 12 months Now married:
44.3% (600)Unmarried:
55.7% (754)
Marital status - Hispanic or Latino population 15 years and over
Males 51.3% Never married48.7% Now married0.0% Separated0.0% Widowed0.0% DivorcedFemales 24.8% Never married51.8% Now married0.0% Separated12.1% Widowed11.2% DivorcedWomen who did not give birth in the past 12 months Now married:
63.7% (148)Unmarried:
36.3% (84)
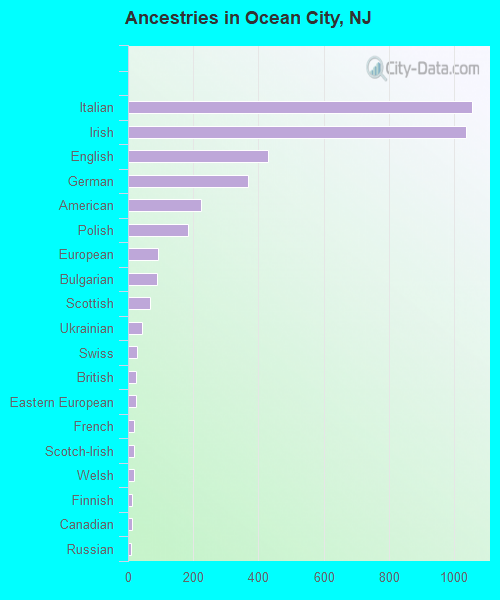
Ancestries in Ocean City
1,055 21.2% Italian1,038 20.9% Irish431 8.7% English367 7.4% German223 4.5% American184 3.7% Polish93 1.9% European88 1.8% Bulgarian67 1.3% Scottish43 0.9% Ukrainian27 0.5% Swiss24 0.5% British24 0.5% Eastern European19 0.4% French17 0.3% Scotch-Irish17 0.3% Welsh12 0.2% Finnish11 0.2% Canadian10 0.2% Russian8 0.2% Australian8 0.2% Lithuanian8 0.2% Maltese7 0.1% Dutch6 0.1% Scandinavian6 0.1% Albanian5 0.1% Luxembourger5 0.1% Greek5 0.1% Romanian5 0.1% Hungarian4 0.08% Norwegian4 0.08% Slovak3 0.06% Armenian3 0.06% Northern European1 0.02% Brazilian1 0.02% Portuguese
Children Nativity (place of birth) in Ocean City
Children under 6 years - Living with two parents Both parents native 161 100.0% NativeBoth parents foreign-born 58 100.0% NativeOne native, one foreign-born parent 8 100.0% NativeChildren under 6 years - Living with one parent Native parent 13 100.0% NativeChildren 6 to 17 years - Living with two parents Both parents native 729 96.9% Native23 3.1% Foreign-bornBoth parents foreign-born 200 77.5% Native58 22.5% Foreign-bornChildren 6 to 17 years - Living with one parent Native parent 399 100.0% NativeForeign-born parent 4 50.5% Native4 49.5% Foreign-born
Grandparents responsible for own grandchildren in Ocean City
Grandparents (30 to 59 years) White / Caucasian 10 100.0% Not responsible for grandchildrenWhite alone, not Hispanic / Latino 13 100.0% Not responsible for grandchildrenGrandparents (60 years and over) White / Caucasian 34 32.6% Responsible for grandchildren70 67.4% Not responsible for grandchildrenWhite alone, not Hispanic / Latino 39 33.2% Responsible for grandchildren78 66.8% Not responsible for grandchildren