Races in Oak Park, Illinois (IL) Detailed Stats
Data:
Races - White alone (%)
Races - White alone (% change since 2000)
Races - Black alone (%)
Races - Black alone (% change since 2000)
Races - American Indian alone (%)
Races - American Indian alone (% change since 2000)
Races - Asian alone (%)
Races - Asian alone (% change since 2000)
Races - Hispanic (%)
Races - Hispanic (% change since 2000)
Races - Native Hawaiian and Other Pacific Islander alone (%)
Races - Native Hawaiian and Other Pacific Islander alone (% change since 2000)
Races - Two or more races(%)
Races - Two or more races(% change since 2000)
Races - Other race alone (%)
Races - Other race alone (% change since 2000)
Racial diversity
Place of birth - Born in state of residence (%)
Place of birth - Born in state of residence (%) - White
Place of birth - Born in state of residence (%) - Black or African American
Place of birth - Born in state of residence (%) - Asian
Place of birth - Born in state of residence (%) - Hispanic or Latino
Place of birth - Born in state of residence (%) - American Indian and Alaska Native
Place of birth - Born in state of residence (%) - Multirace
Place of birth - Born in state of residence (%) - Other Race
Place of birth - Born in other state (%)
Place of birth - Born in other state (%) - White
Place of birth - Born in other state (%) - Black or African American
Place of birth - Born in other state (%) - Asian
Place of birth - Born in other state (%) - Hispanic or Latino
Place of birth - Born in other state (%) - American Indian and Alaska Native
Place of birth - Born in other state (%) - Multirace
Place of birth - Born in other state (%) - Other Race
Place of birth - Native, outside of US (%)
Place of birth - Native, outside of US (%) - White
Place of birth - Native, outside of US (%) - Black or African American
Place of birth - Native, outside of US (%) - Asian
Place of birth - Native, outside of US (%) - Hispanic or Latino
Place of birth - Native, outside of US (%) - American Indian and Alaska Native
Place of birth - Native, outside of US (%) - Multirace
Place of birth - Native, outside of US (%) - Other Race
Place of birth - Foreign born (%)
Place of birth - Foreign born (%) - White
Place of birth - Foreign born (%) - Black or African American
Place of birth - Foreign born (%) - Asian
Place of birth - Foreign born (%) - Hispanic or Latino
Place of birth - Foreign born (%) - American Indian and Alaska Native
Place of birth - Foreign born (%) - Multirace
Place of birth - Foreign born (%) - Other Race
Residents speaking English at home (%)
Residents speaking English at home - Born in the United States (%)
Residents speaking English at home - Native, born elsewhere (%)
Residents speaking English at home - Foreign born (%)
Residents speaking Spanish at home (%)
Residents speaking Spanish at home - Born in the United States (%)
Residents speaking Spanish at home - Native, born elsewhere (%)
Residents speaking Spanish at home - Foreign born (%)
Residents speaking other language at home (%)
Residents speaking other language at home - Born in the United States (%)
Residents speaking other language at home - Native, born elsewhere (%)
Residents speaking other language at home - Foreign born (%)
Marital status - Never married (%)
Marital status - Now married (%)
Marital status - Separated (%)
Marital status - Widowed (%)
Marital status - Divorced (%)
Ancestries Reported - Arab (%)
Ancestries Reported - Czech (%)
Ancestries Reported - Danish (%)
Ancestries Reported - Dutch (%)
Ancestries Reported - English (%)
Ancestries Reported - French (%)
Ancestries Reported - French Canadian (%)
Ancestries Reported - German (%)
Ancestries Reported - Greek (%)
Ancestries Reported - Hungarian (%)
Ancestries Reported - Irish (%)
Ancestries Reported - Italian (%)
Ancestries Reported - Lithuanian (%)
Ancestries Reported - Norwegian (%)
Ancestries Reported - Polish (%)
Ancestries Reported - Portuguese (%)
Ancestries Reported - Russian (%)
Ancestries Reported - Scotch-Irish (%)
Ancestries Reported - Scottish (%)
Ancestries Reported - Slovak (%)
Ancestries Reported - Subsaharan African (%)
Ancestries Reported - Swedish (%)
Ancestries Reported - Swiss (%)
Ancestries Reported - Ukrainian (%)
Ancestries Reported - United States (%)
Ancestries Reported - Welsh (%)
Ancestries Reported - West Indian (%)
Ancestries Reported - Other (%)
Geographical mobility - Same house 1 year ago (%)
Geographical mobility - Same house 1 year ago (%) - White
Geographical mobility - Same house 1 year ago (%) - Black or African American
Geographical mobility - Same house 1 year ago (%) - Asian
Geographical mobility - Same house 1 year ago (%) - Hispanic or Latino
Geographical mobility - Same house 1 year ago (%) - American Indian and Alaska Native
Geographical mobility - Same house 1 year ago (%) - Multirace
Geographical mobility - Same house 1 year ago (%) - Other Race
Geographical mobility - Moved within same county (%)
Geographical mobility - Moved within same county (%) - White
Geographical mobility - Moved within same county (%) - Black or African American
Geographical mobility - Moved within same county (%) - Asian
Geographical mobility - Moved within same county (%) - Hispanic or Latino
Geographical mobility - Moved within same county (%) - American Indian and Alaska Native
Geographical mobility - Moved within same county (%) - Multirace
Geographical mobility - Moved within same county (%) - Other Race
Geographical mobility - Moved from different county within same state (%)
Geographical mobility - Moved from different county within same state (%) - White
Geographical mobility - Moved from different county within same state (%) - Black or African American
Geographical mobility - Moved from different county within same state (%) - Asian
Geographical mobility - Moved from different county within same state (%) - Hispanic or Latino
Geographical mobility - Moved from different county within same state (%) - American Indian and Alaska Native
Geographical mobility - Moved from different county within same state (%) - Multirace
Geographical mobility - Moved from different county within same state (%) - Other Race
Geographical mobility - Moved from different state (%)
Geographical mobility - Moved from different state (%) - White
Geographical mobility - Moved from different state (%) - Black or African American
Geographical mobility - Moved from different state (%) - Asian
Geographical mobility - Moved from different state (%) - Hispanic or Latino
Geographical mobility - Moved from different state (%) - American Indian and Alaska Native
Geographical mobility - Moved from different state (%) - Multirace
Geographical mobility - Moved from different state (%) - Other Race
Geographical mobility - Moved from abroad (%)
Geographical mobility - Moved from abroad (%) - White
Geographical mobility - Moved from abroad (%) - Black or African American
Geographical mobility - Moved from abroad (%) - Asian
Geographical mobility - Moved from abroad (%) - Hispanic or Latino
Geographical mobility - Moved from abroad (%) - American Indian and Alaska Native
Geographical mobility - Moved from abroad (%) - Multirace
Geographical mobility - Moved from abroad (%) - Other Race
Place of birth for the foreign-born population - Ireland (%)
Place of birth for the foreign-born population - Denmark (%)
Place of birth for the foreign-born population - Norway (%)
Place of birth for the foreign-born population - Sweden (%)
Place of birth for the foreign-born population - United Kingdom (%)
Place of birth for the foreign-born population - England (%)
Place of birth for the foreign-born population - Scotland (%)
Place of birth for the foreign-born population - Other Northern Europe (%)
Place of birth for the foreign-born population - Austria (%)
Place of birth for the foreign-born population - Belgium (%)
Place of birth for the foreign-born population - France (%)
Place of birth for the foreign-born population - Germany (%)
Place of birth for the foreign-born population - Netherlands (%)
Place of birth for the foreign-born population - Switzerland (%)
Place of birth for the foreign-born population - Other Western Europe (%)
Place of birth for the foreign-born population - Greece (%)
Place of birth for the foreign-born population - Italy (%)
Place of birth for the foreign-born population - Portugal (%)
Place of birth for the foreign-born population - Spain (%)
Place of birth for the foreign-born population - Other Southern Europe (%)
Place of birth for the foreign-born population - Albania (%)
Place of birth for the foreign-born population - Belarus (%)
Place of birth for the foreign-born population - Bosnia and Herzegovina (%)
Place of birth for the foreign-born population - Bulgaria (%)
Place of birth for the foreign-born population - Croatia (%)
Place of birth for the foreign-born population - Czechoslovakia (%)
Place of birth for the foreign-born population - Hungary (%)
Place of birth for the foreign-born population - Latvia (%)
Place of birth for the foreign-born population - Lithuania (%)
Place of birth for the foreign-born population - North Macedonia (Macedonia) (%)
Place of birth for the foreign-born population - Moldova (%)
Place of birth for the foreign-born population - Poland (%)
Place of birth for the foreign-born population - Romania (%)
Place of birth for the foreign-born population - Russia (%)
Place of birth for the foreign-born population - Serbia (%)
Place of birth for the foreign-born population - Ukraine (%)
Place of birth for the foreign-born population - Other Eastern Europe (%)
Place of birth for the foreign-born population - China (%)
Place of birth for the foreign-born population - Hong Kong (%)
Place of birth for the foreign-born population - Taiwan (%)
Place of birth for the foreign-born population - Japan (%)
Place of birth for the foreign-born population - Korea (%)
Place of birth for the foreign-born population - Other Eastern Asia (%)
Place of birth for the foreign-born population - Afghanistan (%)
Place of birth for the foreign-born population - Bangladesh (%)
Place of birth for the foreign-born population - India (%)
Place of birth for the foreign-born population - Iran (%)
Place of birth for the foreign-born population - Kazakhstan (%)
Place of birth for the foreign-born population - Nepal (%)
Place of birth for the foreign-born population - Pakistan (%)
Place of birth for the foreign-born population - Sri Lanka (%)
Place of birth for the foreign-born population - Uzbekistan (%)
Place of birth for the foreign-born population - Other South Central Asia (%)
Place of birth for the foreign-born population - Burma (%)
Place of birth for the foreign-born population - Cambodia (%)
Place of birth for the foreign-born population - Indonesia (%)
Place of birth for the foreign-born population - Laos (%)
Place of birth for the foreign-born population - Malaysia (%)
Place of birth for the foreign-born population - Philippines (%)
Place of birth for the foreign-born population - Singapore (%)
Place of birth for the foreign-born population - Thailand (%)
Place of birth for the foreign-born population - Vietnam (%)
Place of birth for the foreign-born population - Other South Eastern Asia (%)
Place of birth for the foreign-born population - Armenia (%)
Place of birth for the foreign-born population - Iraq (%)
Place of birth for the foreign-born population - Israel (%)
Place of birth for the foreign-born population - Jordan (%)
Place of birth for the foreign-born population - Kuwait (%)
Place of birth for the foreign-born population - Lebanon (%)
Place of birth for the foreign-born population - Saudi Arabia (%)
Place of birth for the foreign-born population - Syria (%)
Place of birth for the foreign-born population - Turkey (%)
Place of birth for the foreign-born population - Yemen (%)
Place of birth for the foreign-born population - Other Western Asia (%)
Place of birth for the foreign-born population - Eritrea (%)
Place of birth for the foreign-born population - Ethiopia (%)
Place of birth for the foreign-born population - Kenya (%)
Place of birth for the foreign-born population - Somalia (%)
Place of birth for the foreign-born population - Uganda (%)
Place of birth for the foreign-born population - Zimbabwe (%)
Place of birth for the foreign-born population - Other Eastern Africa (%)
Place of birth for the foreign-born population - Cameroon (%)
Place of birth for the foreign-born population - Congo (%)
Place of birth for the foreign-born population - Democratic Republic of Congo (Zaire) (%)
Place of birth for the foreign-born population - Other Middle Africa (%)
Place of birth for the foreign-born population - Egypt (%)
Place of birth for the foreign-born population - Morocco (%)
Place of birth for the foreign-born population - Sudan (%)
Place of birth for the foreign-born population - Other Northern Africa (%)
Place of birth for the foreign-born population - South Africa (%)
Place of birth for the foreign-born population - Other Southern Africa (%)
Place of birth for the foreign-born population - Cabo Verde (%)
Place of birth for the foreign-born population - Ghana (%)
Place of birth for the foreign-born population - Liberia (%)
Place of birth for the foreign-born population - Nigeria (%)
Place of birth for the foreign-born population - Senegal (%)
Place of birth for the foreign-born population - Sierra Leone (%)
Place of birth for the foreign-born population - Other Western Africa (%)
Place of birth for the foreign-born population - Australia (%)
Place of birth for the foreign-born population - New Zealand (%)
Place of birth for the foreign-born population - Fiji (%)
Place of birth for the foreign-born population - Micronesia (%)
Place of birth for the foreign-born population - Bahamas (%)
Place of birth for the foreign-born population - Barbados (%)
Place of birth for the foreign-born population - Cuba (%)
Place of birth for the foreign-born population - Dominica (%)
Place of birth for the foreign-born population - Dominican Republic (%)
Place of birth for the foreign-born population - Grenada (%)
Place of birth for the foreign-born population - Haiti (%)
Place of birth for the foreign-born population - Jamaica (%)
Place of birth for the foreign-born population - St. Vincent and the Grenadines (%)
Place of birth for the foreign-born population - Trinidad and Tobago (%)
Place of birth for the foreign-born population - West Indies (%)
Place of birth for the foreign-born population - Other Caribbean (%)
Place of birth for the foreign-born population - Belize (%)
Place of birth for the foreign-born population - Costa Rica (%)
Place of birth for the foreign-born population - El Salvador (%)
Place of birth for the foreign-born population - Guatemala (%)
Place of birth for the foreign-born population - Honduras (%)
Place of birth for the foreign-born population - Mexico (%)
Place of birth for the foreign-born population - Nicaragua (%)
Place of birth for the foreign-born population - Panama (%)
Place of birth for the foreign-born population - Other Central America (%)
Place of birth for the foreign-born population - Argentina (%)
Place of birth for the foreign-born population - Bolivia (%)
Place of birth for the foreign-born population - Brazil (%)
Place of birth for the foreign-born population - Chile (%)
Place of birth for the foreign-born population - Colombia (%)
Place of birth for the foreign-born population - Ecuador (%)
Place of birth for the foreign-born population - Guyana (%)
Place of birth for the foreign-born population - Peru (%)
Place of birth for the foreign-born population - Uruguay (%)
Place of birth for the foreign-born population - Venezuela (%)
Place of birth for the foreign-born population - Other South America (%)
Place of birth for the foreign-born population - Canada (%)
Place of birth for the foreign-born population - Other Northern America (%)
Place of birth for the foreign-born population - Other (%)
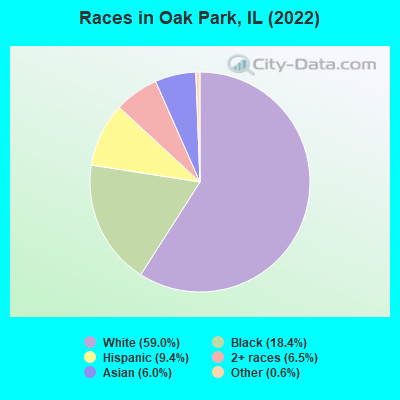
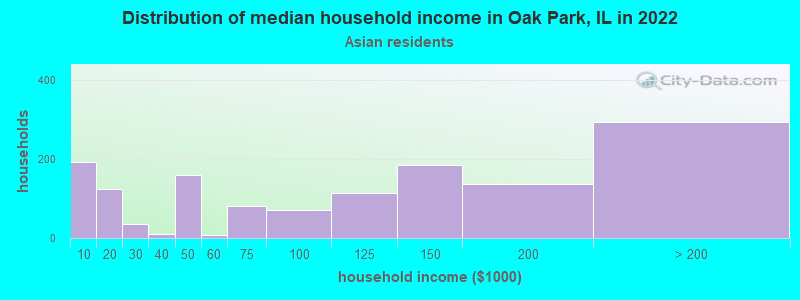
According to 2022 data, the most numerous races in Oak Park, IL are White alone (31,070 residents), Hispanic (4,965 residents), and Black alone (9,661 residents). 86.0% of Oak Park residents speak English at home. 8.3% of Oak Park, IL residents are foreign-born (3.8% born in Asia, 2.0% born in Latin America, 1.9% born in Europe), which is 67.7% less than the foreign-born rate of 14.0% across the entire state of Illinois.
Race distribution in Oak Park
2000 2022
34,767 66.2% White alone 11,685 22.2% Black alone 2,374 4.5% Hispanic 2,171 4.1% Asian alone 1,265 2.4% Two or more races 185 0.4% Other race alone 61 0.1% American Indian alone 16 0.03% Native Hawaiian and Other
31,070 59.0% White alone 9,661 18.4% Black alone 4,965 9.4% Hispanic 3,410 6.5% Two or more races 3,143 6.0% Asian alone 300 0.6% Other race alone 34 0.06% American Indian alone 10 0.02% Native Hawaiian and Other
2000 2022
8,424,140 67.8% White alone 1,856,152 14.9% Black alone 1,530,262 12.3% Hispanic 419,916 3.4% Asian alone 153,996 1.2% Two or more races 13,479 0.1% Other race alone 18,232 0.1% American Indian alone 3,116 0.03% Native Hawaiian and Other
7,356,301 58.5% White alone 2,299,726 18.3% Hispanic 1,660,423 13.2% Black alone 747,296 5.9% Asian alone 458,599 3.6% Two or more races 45,386 0.4% Other race alone 10,405 0.08% American Indian alone 3,896 0.03% Native Hawaiian and Other
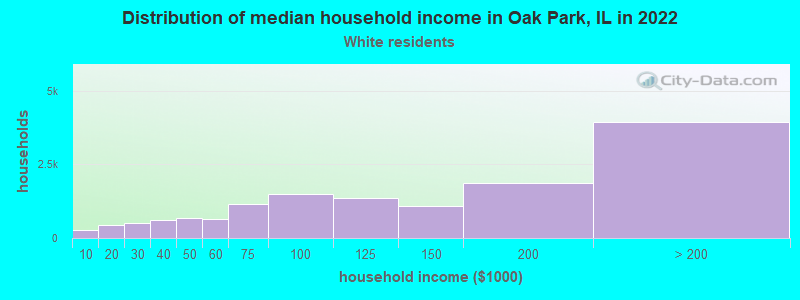
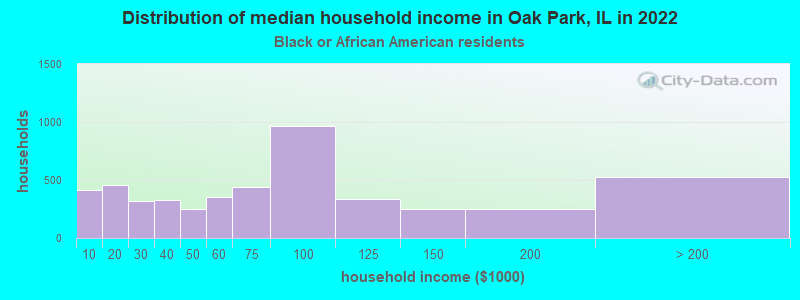
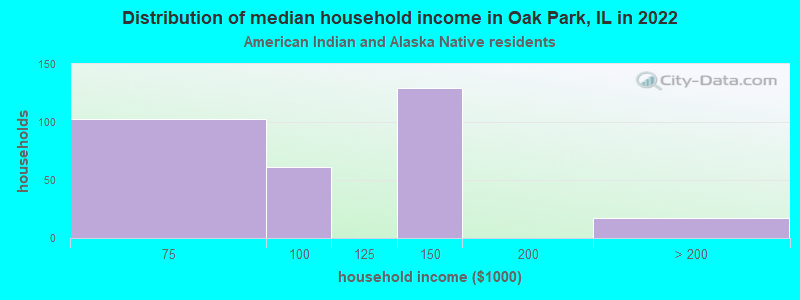
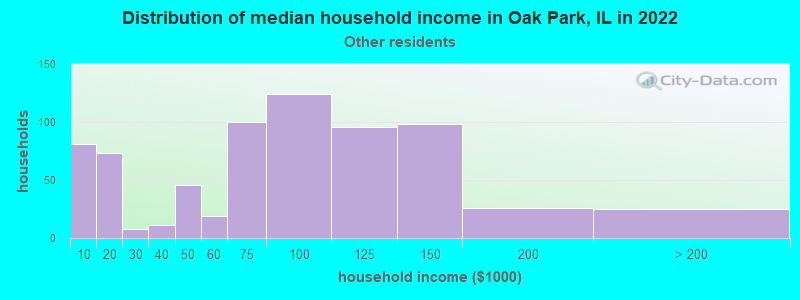
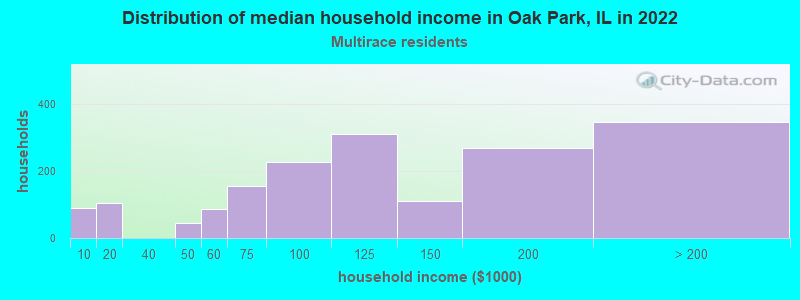
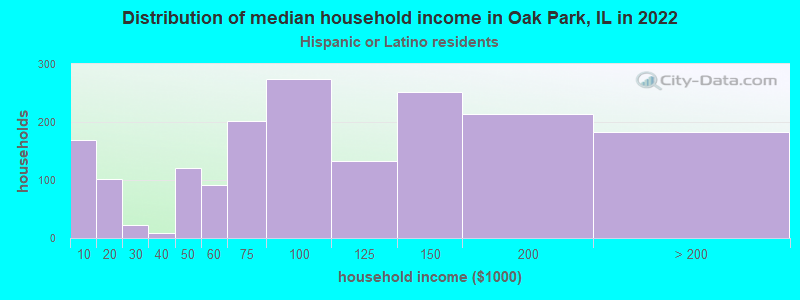
Income and house value in Oak Park Median household income in 2022 $118,729 White non-Hispanic householders$68,270 Black householders$104,315 American Indian and Alaska Native householders$97,973 Asian householders$86,611 Some other race householders$100,044 Two or more races householders$86,481 Hispanic or Latino race householdersMedian 2022 house value $526,403 White Non-Hispanic householders$411,691 Black or African American householders$120,634 American Indian or Alaska Native householders $438,669 Asian householders$348,961 Some other race householders$424,412 Two or more races householders$396,557 Hispanic or Latino householders
Median age by race in Oak Park
44.3 Median age for White residents42.6 45.6 42.0 Median age for Black or African American residents43.2 41.8 33.2 Median age for American Indian / Alaska Native residents40.0 28.9 46.1 Median age for Asian residents40.7 47.4 -687,999,999.3 Median age for Native Hawaiian / Pacific Islander residents-918,721,460.3 -610,229,276.3 32.3 Median age for Other race residents31.4 33.3 19.1 Median age for Two or more races residents18.9 19.4 43.7 Median age for White alone residents42.7 44.7 30.2 Median age for Hispanic or Latino residents26.1 31.4
Owner/renter occupied households by race in Oak Park
House owners and renters - White residents 9,741 69.1% Owner occupied4,363 30.9% Renter occupiedHouse owners and renters - Black or African American residents 1,736 35.3% Owner occupied3,183 64.7% Renter occupiedHouse owners and renters - American Indian / Alaska Native residents 180 58.5% Owner occupied128 41.5% Renter occupiedHouse owners and renters - Asian residents 864 59.7% Owner occupied584 40.3% Renter occupiedHouse owners and renters - Other race residents 233 34.9% Owner occupied436 65.1% Renter occupiedHouse owners and renters - Two or more races residents 952 53.1% Owner occupied839 46.9% Renter occupiedHouse owners and renters - White alone residents 10,048 68.6% Owner occupied4,597 31.4% Renter occupiedHouse owners and renters - Hispanic or Latino residents 949 55.1% Owner occupied774 44.9% Renter occupied
Language usage in Oak Park
English speakers - Total 86.0% of residents of Oak Park speak English at home.
6.2% of residents speak Spanish at home 2,568 83.2% Speak English very well519 16.8% Speak English less than very well7.2% of residents speak other language at home 2,936 81.7% Speak English very well657 18.3% Speak English less than very well
English speakers - Born in the United States 94.6% of residents of Oak Park speak English at home.
2.2% of residents speak Spanish at home 279 80.6% Speak English very well67 19.4% Speak English less than very well3.1% of residents speak other language at home 433 89.8% Speak English very well49 10.2% Speak English less than very well
English speakers - Native, born elsewhere 66.4% of residents of Oak Park speak English at home.
27.0% of residents speak Spanish at home 164 86.3% Speak English very well26 13.7% Speak English less than very well7.9% of residents speak other language at home 56 100.0% Speak English very well
English speakers - Foreign-born 23.5% of residents of Oak Park speak English at home.
20.8% of residents speak Spanish at home 602 66.2% Speak English very well307 33.8% Speak English less than very well54.5% of residents speak other language at home 1,793 75.3% Speak English very well589 24.7% Speak English less than very well
White (Caucasian) - Speak only English Native:
99.7% (27,272)Foreign-born:
28.5% (339)
White (Caucasian) - Speak another language Native:
3.5% (956)Foreign-born:
72.6% (866)
Black or African American - Speak only English Native:
95.4% (8,852)Foreign-born:
70.2% (161)
Black or African American - Speak another language Native:
4.6% (430)Foreign-born:
37.5% (86)
American Indian / Alaska Native - Speak only English Native:
50.2% (191)Foreign-born:
26.4% (11)
American Indian / Alaska Native - Speak another language Native:
43.3% (165)Foreign-born:
59.7% (25)
Asian - Speak only English Native:
79.0% (1,070)Foreign-born:
21.3% (394)
Asian - Speak another language Native:
21.2% (287)Foreign-born:
77.2% (1,427)
Other race - Speak only English Native:
53.5% (519)Foreign-born:
2.3% (9)
Other race - Speak another language Native:
48.9% (474)Foreign-born:
97.9% (392)
Two or more races - Speak only English Native:
77.3% (3,999)Foreign-born:
21.3% (115)
Two or more races - Speak another language Native:
20.3% (1,051)Foreign-born:
78.7% (425)
White alone - Speak only English Native:
95.9% (27,151)Foreign-born:
28.8% (358)
White alone - Speak another language Native:
3.6% (1,027)Foreign-born:
69.7% (866)
Hispanic or Latino - Speak only English Native:
58.6% (2,126)Foreign-born:
8.2% (78)
Hispanic or Latino - Speak another language Native:
43.0% (1,559)Foreign-born:
91.3% (861)
Foreign-born residents in Oak Park 4,395 residents are foreign born (3.8% Asia , 2.0% Latin America , 1.9% Europe ).
This city:
8.3%Illinois:
14.1%
Marital status for residents in Oak Park Marital status - White (Caucasian) population 15 years and over
Males 26.6% Never married63.0% Now married0.5% Separated1.6% Widowed8.3% DivorcedFemales 31.1% Never married48.9% Now married0.5% Separated7.4% Widowed12.1% DivorcedWomen who gave birth in the past 12 months Now married:
56.7% (172)Unmarried:
43.3% (131)
Women who did not give birth in the past 12 months Now married:
47.0% (3,015)Unmarried:
53.0% (3,399)
Marital status - Black or African American population 15 years and over
Males 50.8% Never married32.5% Now married0.8% Separated4.8% Widowed11.1% DivorcedFemales 53.9% Never married21.2% Now married3.4% Separated9.1% Widowed12.5% DivorcedWomen who gave birth in the past 12 months Now married:
52.2% (33)Unmarried:
47.8% (30)
Women who did not give birth in the past 12 months Now married:
18.6% (496)Unmarried:
81.4% (2,167)
Marital status - American Indian / Alaska Native population 15 years and over
Males 88.4% Never married11.6% Now married0.0% Separated0.0% Widowed0.0% DivorcedFemales 70.2% Never married9.6% Now married0.0% Separated20.2% Widowed0.0% DivorcedWomen who did not give birth in the past 12 months Now married:
12.0% (18)Unmarried:
88.0% (132)
Marital status - Asian population 15 years and over
Males 36.4% Never married57.2% Now married0.0% Separated2.7% Widowed3.7% DivorcedFemales 27.6% Never married61.2% Now married2.7% Separated1.6% Widowed6.9% DivorcedWomen who gave birth in the past 12 months Now married:
100.0% (18)Unmarried:
0.0% (0)
Women who did not give birth in the past 12 months Now married:
66.6% (607)Unmarried:
33.4% (305)
Marital status - Other race population 15 years and over
Males 65.5% Never married28.3% Now married0.0% Separated0.0% Widowed6.2% DivorcedFemales 41.3% Never married35.0% Now married0.0% Separated9.8% Widowed14.0% DivorcedWomen who gave birth in the past 12 months Now married:
100.0% (37)Unmarried:
0.0% (0)
Women who did not give birth in the past 12 months Now married:
32.4% (112)Unmarried:
67.6% (234)
Marital status - Two or more races population 15 years and over
Males 49.2% Never married47.3% Now married1.0% Separated0.7% Widowed1.9% DivorcedFemales 56.0% Never married33.2% Now married0.0% Separated0.3% Widowed10.5% DivorcedWomen who gave birth in the past 12 months Now married:
51.3% (28)Unmarried:
48.7% (26)
Women who did not give birth in the past 12 months Now married:
23.2% (300)Unmarried:
76.8% (994)
Marital status - White alone, not Hispanic / Latino population 15 years and over
Males 26.1% Never married63.6% Now married0.5% Separated1.7% Widowed8.1% DivorcedFemales 30.8% Never married49.1% Now married0.5% Separated7.6% Widowed12.0% DivorcedWomen who gave birth in the past 12 months Now married:
55.8% (187)Unmarried:
44.2% (148)
Women who did not give birth in the past 12 months Now married:
47.7% (3,204)Unmarried:
52.3% (3,513)
Marital status - Hispanic or Latino population 15 years and over
Males 51.1% Never married41.1% Now married0.8% Separated0.6% Widowed6.4% DivorcedFemales 44.8% Never married35.7% Now married0.0% Separated2.1% Widowed17.4% DivorcedWomen who gave birth in the past 12 months Now married:
100.0% (43)Unmarried:
0.0% (0)
Women who did not give birth in the past 12 months Now married:
30.8% (413)Unmarried:
69.2% (929)
Ancestries in Oak Park
1,874 8.4% Irish1,513 6.8% German1,012 4.5% European843 3.8% Polish793 3.6% Italian771 3.5% American585 2.6% English222 1.0% Dutch207 0.9% African196 0.9% Swedish192 0.9% Russian143 0.6% Iranian142 0.6% Eastern European136 0.6% Czech122 0.5% Scandinavian119 0.5% Norwegian103 0.5% British98 0.4% Greek97 0.4% Latvian97 0.4% Jamaican89 0.4% Lithuanian81 0.4% Scotch-Irish81 0.4% Armenian70 0.3% Romanian68 0.3% Swiss67 0.3% Welsh62 0.3% Ukrainian54 0.2% Serbian54 0.2% Nigerian47 0.2% Slovak46 0.2% Scottish42 0.2% Palestinian42 0.2% Brazilian40 0.2% Northern European38 0.2% Hungarian37 0.2% Turkish37 0.2% Cape Verdean27 0.1% French26 0.1% Haitian25 0.1% Canadian24 0.1% Danish23 0.1% French Canadian21 0.09% Slavic21 0.09% Albanian19 0.09% Israeli15 0.07% Cajun14 0.06% Barbadian13 0.06% Egyptian13 0.06% Ghanaian11 0.05% Belgian9 0.04% Austrian8 0.04% Estonian7 0.03% Assyrian6 0.03% Lebanese6 0.03% Finnish6 0.03% Moroccan5 0.02% Bulgarian3 0.01% Portuguese
Geographical mobility in Oak Park Same house 1 year ago 25,508 87.4% White (Caucasian)8,567 87.8% Black or African American234 55.1% American Indian / Alaska Native2,404 74.5% Asian11 100.0% Native Hawaiian / Pacific Islander1,206 79.4% Other race5,330 80.9% Two or more races27,215 88.0% White alone, not Hispanic / Latino3,850 78.4% Hispanic or LatinoMoved within same county 2,417 8.3% White / Caucasian627 6.4% Black or African American217 51.2% American Indian / Alaska Native441 13.7% Asian136 8.9% Other race969 14.7% Two or more races2,463 8.0% White alone, not Hispanic / Latino824 16.8% Hispanic or LatinoMoved within same state 453 1.6% White / Caucasian422 4.3% Black or African American34 2.2% Other race47 0.7% Two or more races466 1.5% White alone, not Hispanic / Latino33 0.7% Hispanic or LatinoMoved from different state 708 2.4% White / Caucasian212 2.2% Black or African American180 5.6% Asian23 1.5% Other race234 3.5% Two or more races690 2.2% White alone, not Hispanic / Latino65 1.3% Hispanic or LatinoMoved from abroad 63 0.2% White121 1.2% Black or African American234 7.2% Asian132 8.7% Other race53 0.2% White alone, not Hispanic / Latino141 2.9% Hispanic or Latino
Children Nativity (place of birth) in Oak Park
Children under 6 years - Living with two parents Both parents native 2,363 100.0% NativeBoth parents foreign-born 60 74.6% Native21 25.4% Foreign-bornOne native, one foreign-born parent 286 100.0% NativeChildren under 6 years - Living with one parent Native parent 478 100.0% NativeForeign-born parent 32 100.0% NativeChildren 6 to 17 years - Living with two parents Both parents native 4,953 98.7% Native63 1.3% Foreign-bornBoth parents foreign-born 140 76.0% Native44 24.0% Foreign-bornOne native, one foreign-born parent 620 100.0% NativeChildren 6 to 17 years - Living with one parent Native parent 2,090 100.0% NativeForeign-born parent 129 54.6% Native107 45.4% Foreign-born
Grandparents responsible for own grandchildren in Oak Park
Grandparents (30 to 59 years) White / Caucasian 25 61.5% Responsible for grandchildren16 38.5% Not responsible for grandchildrenBlack or African American 9 100.0% Not responsible for grandchildrenWhite alone, not Hispanic / Latino 33 71.2% Responsible for grandchildren13 28.8% Not responsible for grandchildrenGrandparents (60 years and over) White / Caucasian 80 36.4% Responsible for grandchildren139 63.6% Not responsible for grandchildrenBlack or African American 141 58.0% Responsible for grandchildren102 42.0% Not responsible for grandchildrenWhite alone, not Hispanic / Latino 97 35.2% Responsible for grandchildren179 64.8% Not responsible for grandchildren