Races in O'Hara Township, Pennsylvania (PA) Detailed Stats
Ancestries, Foreign-born residents, place of birth

Recent posts about races in O'Hara Township, Pennsylvania on our local forum with over 2,400,000 registered users:
 | Pittsburgh MSA municipal population data (2020) (125 replies) |
| Asian family looking for your advice to find a house (53 replies) |
| Help Picking a Pittsburgh Neighborhood (140 replies) |
| Pittsburgh 53 out of 53 metros in 2019 census estimates (107 replies) |
| Pittsburgh area companies adding jobs (102 replies) |
| Amazon is looking for a second HQ. Why not, Pittsburgh? (2091 replies) |
6.9% of O'Hara Township, PA residents are foreign-born (3.3% born in Europe, 3.0% born in Asia), which is about the same as the foreign-born rate of 7.0% across the entire state of Pennsylvania.
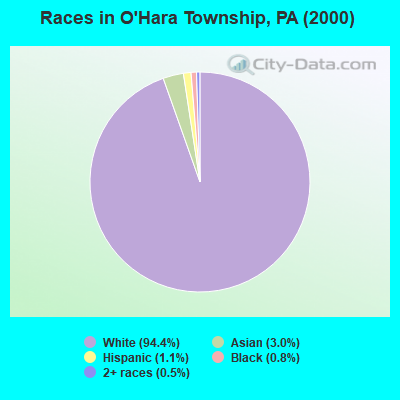
Race distribution in O'Hara Township

- 8,35694.4%White alone
- 2693.0%Asian alone
- 1011.1%Hispanic
- 730.8%Black alone
- 480.5%Two or more races
- 60.07%Other race alone
- 30.03%American Indian alone
2000
2022
-
- 10,322,45584.1%White alone
- 1,202,4379.8%Black alone
- 394,0883.2%Hispanic
- 218,2961.8%Asian alone
- 113,0970.9%Two or more races
- 13,0860.1%Other race alone
- 14,9040.1%American Indian alone
- 2,6910.02%Native Hawaiian and Other
Pacific Islander alone

-
- 9,487,22873.1%White alone
- 1,311,58110.1%Black alone
- 1,115,9978.6%Hispanic
- 493,9423.8%Two or more races
- 487,1243.8%Asian alone
- 63,5820.5%Other race alone
- 10,1300.08%American Indian alone
- 2,4240.02%Native Hawaiian and Other
Pacific Islander alone

Income and house value in O'Hara Township
- Median household income in 2022
- $127,073White non-Hispanic householders
- $42,205Black householders
- over $200,000Asian householders
- $96,820Two or more races householders
- over $200,000Hispanic or Latino race householders
- Median 2022 house value
- $401,980White Non-Hispanic householders
- $309,848Black or African American householders
- $382,863Asian householders
- $365,074Native Hawaiian and other Pacific Islander householders
- $309,848Hispanic or Latino householders
Household income for White non-Hispanic householders

Household income for Black householders

Household income for Asian householders

Household income for Native Hawaiian and other Pacific Islander householders

Household income for Two or more races householders

Household income for Hispanic or Latino race householders

Foreign-born residents in O'Hara Township
612 residents are foreign born (3.3% Europe, 3.0% Asia).
| This city: | 6.9% |
| Pennsylvania: | 4.1% |
Ancestries in O'Hara Township

- 2,03119.5%German
- 1,42213.7%Irish
- 1,41013.6%Italian
- 1,41013.6%Other
- 9098.7%Polish
- 8558.2%English
- 2622.5%Russian
- 2302.2%Slovak
- 2252.2%Scottish
- 2222.1%Scotch-Irish
- 1991.9%United States
- 1821.8%Hungarian
- 1701.6%French
- 1171.1%Czech
- 1081.0%Arab
- 1081.0%Dutch
- 930.9%Norwegian
- 920.9%Welsh
- 770.7%Lithuanian
- 720.7%Greek
- 710.7%Ukrainian
- 690.7%Swedish
- 270.3%West Indian
- 120.1%Danish
- 110.1%French Canadian
- 80.08%Portuguese
- 60.06%Swiss

Zip codes: 15215.