Races in Norwich, Connecticut (CT) Detailed Stats
Data:
Races - White alone (%)
Races - White alone (% change since 2000)
Races - Black alone (%)
Races - Black alone (% change since 2000)
Races - American Indian alone (%)
Races - American Indian alone (% change since 2000)
Races - Asian alone (%)
Races - Asian alone (% change since 2000)
Races - Hispanic (%)
Races - Hispanic (% change since 2000)
Races - Native Hawaiian and Other Pacific Islander alone (%)
Races - Native Hawaiian and Other Pacific Islander alone (% change since 2000)
Races - Two or more races(%)
Races - Two or more races(% change since 2000)
Races - Other race alone (%)
Races - Other race alone (% change since 2000)
Racial diversity
Place of birth - Born in state of residence (%)
Place of birth - Born in state of residence (%) - White
Place of birth - Born in state of residence (%) - Black or African American
Place of birth - Born in state of residence (%) - Asian
Place of birth - Born in state of residence (%) - Hispanic or Latino
Place of birth - Born in state of residence (%) - American Indian and Alaska Native
Place of birth - Born in state of residence (%) - Multirace
Place of birth - Born in state of residence (%) - Other Race
Place of birth - Born in other state (%)
Place of birth - Born in other state (%) - White
Place of birth - Born in other state (%) - Black or African American
Place of birth - Born in other state (%) - Asian
Place of birth - Born in other state (%) - Hispanic or Latino
Place of birth - Born in other state (%) - American Indian and Alaska Native
Place of birth - Born in other state (%) - Multirace
Place of birth - Born in other state (%) - Other Race
Place of birth - Native, outside of US (%)
Place of birth - Native, outside of US (%) - White
Place of birth - Native, outside of US (%) - Black or African American
Place of birth - Native, outside of US (%) - Asian
Place of birth - Native, outside of US (%) - Hispanic or Latino
Place of birth - Native, outside of US (%) - American Indian and Alaska Native
Place of birth - Native, outside of US (%) - Multirace
Place of birth - Native, outside of US (%) - Other Race
Place of birth - Foreign born (%)
Place of birth - Foreign born (%) - White
Place of birth - Foreign born (%) - Black or African American
Place of birth - Foreign born (%) - Asian
Place of birth - Foreign born (%) - Hispanic or Latino
Place of birth - Foreign born (%) - American Indian and Alaska Native
Place of birth - Foreign born (%) - Multirace
Place of birth - Foreign born (%) - Other Race
Residents speaking English at home (%)
Residents speaking English at home - Born in the United States (%)
Residents speaking English at home - Native, born elsewhere (%)
Residents speaking English at home - Foreign born (%)
Residents speaking Spanish at home (%)
Residents speaking Spanish at home - Born in the United States (%)
Residents speaking Spanish at home - Native, born elsewhere (%)
Residents speaking Spanish at home - Foreign born (%)
Residents speaking other language at home (%)
Residents speaking other language at home - Born in the United States (%)
Residents speaking other language at home - Native, born elsewhere (%)
Residents speaking other language at home - Foreign born (%)
Marital status - Never married (%)
Marital status - Now married (%)
Marital status - Separated (%)
Marital status - Widowed (%)
Marital status - Divorced (%)
Ancestries Reported - Arab (%)
Ancestries Reported - Czech (%)
Ancestries Reported - Danish (%)
Ancestries Reported - Dutch (%)
Ancestries Reported - English (%)
Ancestries Reported - French (%)
Ancestries Reported - French Canadian (%)
Ancestries Reported - German (%)
Ancestries Reported - Greek (%)
Ancestries Reported - Hungarian (%)
Ancestries Reported - Irish (%)
Ancestries Reported - Italian (%)
Ancestries Reported - Lithuanian (%)
Ancestries Reported - Norwegian (%)
Ancestries Reported - Polish (%)
Ancestries Reported - Portuguese (%)
Ancestries Reported - Russian (%)
Ancestries Reported - Scotch-Irish (%)
Ancestries Reported - Scottish (%)
Ancestries Reported - Slovak (%)
Ancestries Reported - Subsaharan African (%)
Ancestries Reported - Swedish (%)
Ancestries Reported - Swiss (%)
Ancestries Reported - Ukrainian (%)
Ancestries Reported - United States (%)
Ancestries Reported - Welsh (%)
Ancestries Reported - West Indian (%)
Ancestries Reported - Other (%)
Geographical mobility - Same house 1 year ago (%)
Geographical mobility - Same house 1 year ago (%) - White
Geographical mobility - Same house 1 year ago (%) - Black or African American
Geographical mobility - Same house 1 year ago (%) - Asian
Geographical mobility - Same house 1 year ago (%) - Hispanic or Latino
Geographical mobility - Same house 1 year ago (%) - American Indian and Alaska Native
Geographical mobility - Same house 1 year ago (%) - Multirace
Geographical mobility - Same house 1 year ago (%) - Other Race
Geographical mobility - Moved within same county (%)
Geographical mobility - Moved within same county (%) - White
Geographical mobility - Moved within same county (%) - Black or African American
Geographical mobility - Moved within same county (%) - Asian
Geographical mobility - Moved within same county (%) - Hispanic or Latino
Geographical mobility - Moved within same county (%) - American Indian and Alaska Native
Geographical mobility - Moved within same county (%) - Multirace
Geographical mobility - Moved within same county (%) - Other Race
Geographical mobility - Moved from different county within same state (%)
Geographical mobility - Moved from different county within same state (%) - White
Geographical mobility - Moved from different county within same state (%) - Black or African American
Geographical mobility - Moved from different county within same state (%) - Asian
Geographical mobility - Moved from different county within same state (%) - Hispanic or Latino
Geographical mobility - Moved from different county within same state (%) - American Indian and Alaska Native
Geographical mobility - Moved from different county within same state (%) - Multirace
Geographical mobility - Moved from different county within same state (%) - Other Race
Geographical mobility - Moved from different state (%)
Geographical mobility - Moved from different state (%) - White
Geographical mobility - Moved from different state (%) - Black or African American
Geographical mobility - Moved from different state (%) - Asian
Geographical mobility - Moved from different state (%) - Hispanic or Latino
Geographical mobility - Moved from different state (%) - American Indian and Alaska Native
Geographical mobility - Moved from different state (%) - Multirace
Geographical mobility - Moved from different state (%) - Other Race
Geographical mobility - Moved from abroad (%)
Geographical mobility - Moved from abroad (%) - White
Geographical mobility - Moved from abroad (%) - Black or African American
Geographical mobility - Moved from abroad (%) - Asian
Geographical mobility - Moved from abroad (%) - Hispanic or Latino
Geographical mobility - Moved from abroad (%) - American Indian and Alaska Native
Geographical mobility - Moved from abroad (%) - Multirace
Geographical mobility - Moved from abroad (%) - Other Race
Place of birth for the foreign-born population - Ireland (%)
Place of birth for the foreign-born population - Denmark (%)
Place of birth for the foreign-born population - Norway (%)
Place of birth for the foreign-born population - Sweden (%)
Place of birth for the foreign-born population - United Kingdom (%)
Place of birth for the foreign-born population - England (%)
Place of birth for the foreign-born population - Scotland (%)
Place of birth for the foreign-born population - Other Northern Europe (%)
Place of birth for the foreign-born population - Austria (%)
Place of birth for the foreign-born population - Belgium (%)
Place of birth for the foreign-born population - France (%)
Place of birth for the foreign-born population - Germany (%)
Place of birth for the foreign-born population - Netherlands (%)
Place of birth for the foreign-born population - Switzerland (%)
Place of birth for the foreign-born population - Other Western Europe (%)
Place of birth for the foreign-born population - Greece (%)
Place of birth for the foreign-born population - Italy (%)
Place of birth for the foreign-born population - Portugal (%)
Place of birth for the foreign-born population - Spain (%)
Place of birth for the foreign-born population - Other Southern Europe (%)
Place of birth for the foreign-born population - Albania (%)
Place of birth for the foreign-born population - Belarus (%)
Place of birth for the foreign-born population - Bosnia and Herzegovina (%)
Place of birth for the foreign-born population - Bulgaria (%)
Place of birth for the foreign-born population - Croatia (%)
Place of birth for the foreign-born population - Czechoslovakia (%)
Place of birth for the foreign-born population - Hungary (%)
Place of birth for the foreign-born population - Latvia (%)
Place of birth for the foreign-born population - Lithuania (%)
Place of birth for the foreign-born population - North Macedonia (Macedonia) (%)
Place of birth for the foreign-born population - Moldova (%)
Place of birth for the foreign-born population - Poland (%)
Place of birth for the foreign-born population - Romania (%)
Place of birth for the foreign-born population - Russia (%)
Place of birth for the foreign-born population - Serbia (%)
Place of birth for the foreign-born population - Ukraine (%)
Place of birth for the foreign-born population - Other Eastern Europe (%)
Place of birth for the foreign-born population - China (%)
Place of birth for the foreign-born population - Hong Kong (%)
Place of birth for the foreign-born population - Taiwan (%)
Place of birth for the foreign-born population - Japan (%)
Place of birth for the foreign-born population - Korea (%)
Place of birth for the foreign-born population - Other Eastern Asia (%)
Place of birth for the foreign-born population - Afghanistan (%)
Place of birth for the foreign-born population - Bangladesh (%)
Place of birth for the foreign-born population - India (%)
Place of birth for the foreign-born population - Iran (%)
Place of birth for the foreign-born population - Kazakhstan (%)
Place of birth for the foreign-born population - Nepal (%)
Place of birth for the foreign-born population - Pakistan (%)
Place of birth for the foreign-born population - Sri Lanka (%)
Place of birth for the foreign-born population - Uzbekistan (%)
Place of birth for the foreign-born population - Other South Central Asia (%)
Place of birth for the foreign-born population - Burma (%)
Place of birth for the foreign-born population - Cambodia (%)
Place of birth for the foreign-born population - Indonesia (%)
Place of birth for the foreign-born population - Laos (%)
Place of birth for the foreign-born population - Malaysia (%)
Place of birth for the foreign-born population - Philippines (%)
Place of birth for the foreign-born population - Singapore (%)
Place of birth for the foreign-born population - Thailand (%)
Place of birth for the foreign-born population - Vietnam (%)
Place of birth for the foreign-born population - Other South Eastern Asia (%)
Place of birth for the foreign-born population - Armenia (%)
Place of birth for the foreign-born population - Iraq (%)
Place of birth for the foreign-born population - Israel (%)
Place of birth for the foreign-born population - Jordan (%)
Place of birth for the foreign-born population - Kuwait (%)
Place of birth for the foreign-born population - Lebanon (%)
Place of birth for the foreign-born population - Saudi Arabia (%)
Place of birth for the foreign-born population - Syria (%)
Place of birth for the foreign-born population - Turkey (%)
Place of birth for the foreign-born population - Yemen (%)
Place of birth for the foreign-born population - Other Western Asia (%)
Place of birth for the foreign-born population - Eritrea (%)
Place of birth for the foreign-born population - Ethiopia (%)
Place of birth for the foreign-born population - Kenya (%)
Place of birth for the foreign-born population - Somalia (%)
Place of birth for the foreign-born population - Uganda (%)
Place of birth for the foreign-born population - Zimbabwe (%)
Place of birth for the foreign-born population - Other Eastern Africa (%)
Place of birth for the foreign-born population - Cameroon (%)
Place of birth for the foreign-born population - Congo (%)
Place of birth for the foreign-born population - Democratic Republic of Congo (Zaire) (%)
Place of birth for the foreign-born population - Other Middle Africa (%)
Place of birth for the foreign-born population - Egypt (%)
Place of birth for the foreign-born population - Morocco (%)
Place of birth for the foreign-born population - Sudan (%)
Place of birth for the foreign-born population - Other Northern Africa (%)
Place of birth for the foreign-born population - South Africa (%)
Place of birth for the foreign-born population - Other Southern Africa (%)
Place of birth for the foreign-born population - Cabo Verde (%)
Place of birth for the foreign-born population - Ghana (%)
Place of birth for the foreign-born population - Liberia (%)
Place of birth for the foreign-born population - Nigeria (%)
Place of birth for the foreign-born population - Senegal (%)
Place of birth for the foreign-born population - Sierra Leone (%)
Place of birth for the foreign-born population - Other Western Africa (%)
Place of birth for the foreign-born population - Australia (%)
Place of birth for the foreign-born population - New Zealand (%)
Place of birth for the foreign-born population - Fiji (%)
Place of birth for the foreign-born population - Micronesia (%)
Place of birth for the foreign-born population - Bahamas (%)
Place of birth for the foreign-born population - Barbados (%)
Place of birth for the foreign-born population - Cuba (%)
Place of birth for the foreign-born population - Dominica (%)
Place of birth for the foreign-born population - Dominican Republic (%)
Place of birth for the foreign-born population - Grenada (%)
Place of birth for the foreign-born population - Haiti (%)
Place of birth for the foreign-born population - Jamaica (%)
Place of birth for the foreign-born population - St. Vincent and the Grenadines (%)
Place of birth for the foreign-born population - Trinidad and Tobago (%)
Place of birth for the foreign-born population - West Indies (%)
Place of birth for the foreign-born population - Other Caribbean (%)
Place of birth for the foreign-born population - Belize (%)
Place of birth for the foreign-born population - Costa Rica (%)
Place of birth for the foreign-born population - El Salvador (%)
Place of birth for the foreign-born population - Guatemala (%)
Place of birth for the foreign-born population - Honduras (%)
Place of birth for the foreign-born population - Mexico (%)
Place of birth for the foreign-born population - Nicaragua (%)
Place of birth for the foreign-born population - Panama (%)
Place of birth for the foreign-born population - Other Central America (%)
Place of birth for the foreign-born population - Argentina (%)
Place of birth for the foreign-born population - Bolivia (%)
Place of birth for the foreign-born population - Brazil (%)
Place of birth for the foreign-born population - Chile (%)
Place of birth for the foreign-born population - Colombia (%)
Place of birth for the foreign-born population - Ecuador (%)
Place of birth for the foreign-born population - Guyana (%)
Place of birth for the foreign-born population - Peru (%)
Place of birth for the foreign-born population - Uruguay (%)
Place of birth for the foreign-born population - Venezuela (%)
Place of birth for the foreign-born population - Other South America (%)
Place of birth for the foreign-born population - Canada (%)
Place of birth for the foreign-born population - Other Northern America (%)
Place of birth for the foreign-born population - Other (%)
Latest news about races in Norwich, CT collected exclusively by city-data.com from local newspapers, TV, and radio stations
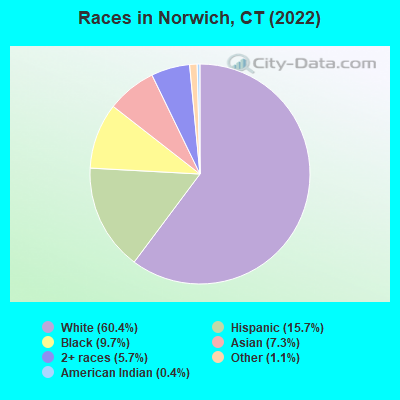
According to 2022 data, the most numerous races in Norwich, CT are White alone (24,277 residents), Hispanic (6,323 residents), and Black alone (3,915 residents). 78.2% of Norwich residents speak English at home. 13.9% of Norwich, CT residents are foreign-born (5.9% born in Latin America, 5.1% born in Asia, 1.5% born in Europe), which is 7.9% less than the foreign-born rate of 15.0% across the entire state of Connecticut.
Race distribution in Norwich
2000 2022
2,638,845 77.5% White alone 320,323 9.4% Hispanic 295,571 8.7% Black alone 81,564 2.4% Asian alone 52,896 1.6% Two or more races 8,141 0.2% Other race alone 7,267 0.2% American Indian alone 958 0.03% Native Hawaiian and Other
2,246,913 62.0% White alone 658,978 18.2% Hispanic 353,973 9.8% Black alone 172,929 4.8% Asian alone 159,631 4.4% Two or more races 29,761 0.8% Other race alone 3,428 0.09% American Indian alone 592 0.02% Native Hawaiian and Other
Income and house value in Norwich Median household income in 2022 $61,436 White non-Hispanic householders$64,872 Black householders$72,661 Asian householders$66,307 Some other race householders$53,745 Two or more races householders$51,818 Hispanic or Latino race householdersMedian 2022 house value $226,080 White Non-Hispanic householders$168,801 Black or African American householders$191,065 American Indian or Alaska Native householders $282,347 Asian householders$215,151 Some other race householders$229,521 Two or more races householders$259,274 Hispanic or Latino householders
Median age by race in Norwich
45.6 Median age for White residents44.6 46.4 32.3 Median age for Black or African American residents29.4 35.4 48.8 Median age for American Indian / Alaska Native residents46.0 55.5 41.5 Median age for Asian residents34.1 50.1 -641,269,840.6 Median age for Native Hawaiian / Pacific Islander residents-414,239,481.8 -691,588,784.4 33.7 Median age for Other race residents31.7 38.9 27.2 Median age for Two or more races residents28.4 25.8 47.8 Median age for White alone residents46.8 50.1 28.2 Median age for Hispanic or Latino residents28.2 28.4
Owner/renter occupied households by race in Norwich
House owners and renters - White residents 7,296 58.5% Owner occupied5,172 41.5% Renter occupiedHouse owners and renters - Black or African American residents 558 38.0% Owner occupied911 62.0% Renter occupiedHouse owners and renters - American Indian / Alaska Native residents 47 26.3% Owner occupied132 73.7% Renter occupiedHouse owners and renters - Asian residents 755 79.2% Owner occupied198 20.8% Renter occupiedHouse owners and renters - Other race residents 241 33.5% Owner occupied478 66.5% Renter occupiedHouse owners and renters - Two or more races residents 566 37.2% Owner occupied956 62.8% Renter occupiedHouse owners and renters - White alone residents 7,147 58.3% Owner occupied5,113 41.7% Renter occupiedHouse owners and renters - Hispanic or Latino residents 604 31.0% Owner occupied1,346 69.0% Renter occupied
Language usage in Norwich
English speakers - Total 78.2% of residents of Norwich speak English at home.
10.6% of residents speak Spanish at home 1,979 48.6% Speak English very well2,091 51.4% Speak English less than very well11.0% of residents speak other language at home 1,930 45.9% Speak English very well2,272 54.1% Speak English less than very well
English speakers - Born in the United States 89.1% of residents of Norwich speak English at home.
7.9% of residents speak Spanish at home 607 72.7% Speak English very well228 27.3% Speak English less than very well2.9% of residents speak other language at home 212 68.2% Speak English very well99 31.8% Speak English less than very well
English speakers - Native, born elsewhere 31.4% of residents of Norwich speak English at home.
66.4% of residents speak Spanish at home 589 47.8% Speak English very well642 52.2% Speak English less than very well1.5% of residents speak other language at home 22 78.6% Speak English very well6 21.4% Speak English less than very well
English speakers - Foreign-born 15.1% of residents of Norwich speak English at home.
25.8% of residents speak Spanish at home 354 24.6% Speak English very well1,085 75.4% Speak English less than very well57.7% of residents speak other language at home 1,147 35.6% Speak English very well2,076 64.4% Speak English less than very well
White (Caucasian) - Speak only English Native:
96.2% (22,945)Foreign-born:
36.6% (336)
White (Caucasian) - Speak another language Native:
4.3% (1,023)Foreign-born:
64.4% (592)
Black or African American - Speak only English Native:
95.3% (2,504)Foreign-born:
5.8% (81)
Black or African American - Speak another language Native:
4.2% (110)Foreign-born:
79.3% (1,111)
American Indian / Alaska Native - Speak another language Native:
25.5% (66)Foreign-born:
92.6% (33)
Asian - Speak only English Native:
41.0% (329)Foreign-born:
15.5% (320)
Asian - Speak another language Native:
58.3% (468)Foreign-born:
84.6% (1,751)
Other race - Speak only English Native:
48.5% (550)Foreign-born:
2.0% (15)
Other race - Speak another language Native:
53.3% (604)Foreign-born:
98.9% (728)
Two or more races - Speak only English Native:
64.1% (2,581)Foreign-born:
6.0% (31)
Two or more races - Speak another language Native:
35.7% (1,439)Foreign-born:
96.1% (496)
White alone - Speak only English Native:
98.0% (22,463)Foreign-born:
50.8% (331)
White alone - Speak another language Native:
2.0% (453)Foreign-born:
49.8% (325)
Hispanic or Latino - Speak only English Native:
43.8% (1,892)Foreign-born:
2.3% (31)
Hispanic or Latino - Speak another language Native:
56.3% (2,429)Foreign-born:
98.4% (1,330)
Foreign-born residents in Norwich 5,593 residents are foreign born (5.9% Latin America , 5.1% Asia , 1.5% Europe ).
This city:
13.9%Connecticut:
15.0%
Marital status for residents in Norwich Marital status - White (Caucasian) population 15 years and over
Males 37.3% Never married41.5% Now married1.1% Separated3.5% Widowed16.7% DivorcedFemales 32.2% Never married36.8% Now married1.5% Separated12.3% Widowed17.2% DivorcedWomen who gave birth in the past 12 months Now married:
75.6% (140)Unmarried:
24.4% (45)
Women who did not give birth in the past 12 months Now married:
31.5% (1,550)Unmarried:
68.5% (3,368)
Marital status - Black or African American population 15 years and over
Males 48.4% Never married33.5% Now married4.2% Separated0.6% Widowed13.3% DivorcedFemales 51.2% Never married33.4% Now married0.7% Separated8.0% Widowed6.8% DivorcedWomen who gave birth in the past 12 months Now married:
100.0% (43)Unmarried:
0.0% (0)
Women who did not give birth in the past 12 months Now married:
30.4% (334)Unmarried:
69.6% (764)
Marital status - American Indian / Alaska Native population 15 years and over
Males 44.0% Never married55.2% Now married0.0% Separated0.0% Widowed0.8% DivorcedFemales 68.6% Never married23.8% Now married0.0% Separated7.6% Widowed0.0% DivorcedWomen who did not give birth in the past 12 months Now married:
0.0% (0)Unmarried:
100.0% (40)
Marital status - Asian population 15 years and over
Males 48.6% Never married38.1% Now married1.1% Separated11.5% Widowed0.8% DivorcedFemales 25.7% Never married55.4% Now married0.0% Separated7.0% Widowed11.9% DivorcedWomen who gave birth in the past 12 months Now married:
100.0% (43)Unmarried:
0.0% (0)
Women who did not give birth in the past 12 months Now married:
40.4% (287)Unmarried:
59.6% (424)
Marital status - Other race population 15 years and over
Males 57.2% Never married29.3% Now married0.0% Separated0.0% Widowed13.5% DivorcedFemales 37.9% Never married38.1% Now married0.8% Separated7.5% Widowed15.7% DivorcedWomen who gave birth in the past 12 months Now married:
87.3% (76)Unmarried:
12.7% (11)
Women who did not give birth in the past 12 months Now married:
26.4% (115)Unmarried:
73.6% (321)
Marital status - Two or more races population 15 years and over
Males 41.4% Never married38.4% Now married8.8% Separated3.7% Widowed7.7% DivorcedFemales 51.7% Never married42.3% Now married0.4% Separated1.1% Widowed4.5% DivorcedWomen who gave birth in the past 12 months Now married:
0.0% (0)Unmarried:
100.0% (14)
Women who did not give birth in the past 12 months Now married:
36.8% (384)Unmarried:
63.2% (659)
Marital status - White alone, not Hispanic / Latino population 15 years and over
Males 37.0% Never married41.0% Now married0.9% Separated3.7% Widowed17.5% DivorcedFemales 31.3% Never married37.3% Now married1.6% Separated12.6% Widowed17.3% DivorcedWomen who gave birth in the past 12 months Now married:
100.0% (147)Unmarried:
0.0% (0)
Women who did not give birth in the past 12 months Now married:
31.1% (1,444)Unmarried:
68.9% (3,204)
Marital status - Hispanic or Latino population 15 years and over
Males 52.2% Never married32.6% Now married6.0% Separated2.1% Widowed7.1% DivorcedFemales 47.8% Never married32.4% Now married0.3% Separated7.3% Widowed12.2% DivorcedWomen who gave birth in the past 12 months Now married:
55.9% (65)Unmarried:
44.1% (51)
Women who did not give birth in the past 12 months Now married:
34.2% (456)Unmarried:
65.8% (878)
Ancestries in Norwich
1,582 8.7% Haitian1,364 7.5% English1,200 6.6% Italian1,030 5.7% Irish1,014 5.6% French755 4.1% Polish701 3.8% French Canadian565 3.1% American474 2.6% German188 1.0% Eastern European138 0.8% African135 0.7% Jamaican132 0.7% European96 0.5% Lithuanian88 0.5% Canadian77 0.4% Trinidadian and Tobagonian62 0.3% Scottish61 0.3% Hungarian61 0.3% Yugoslavian60 0.3% Belgian60 0.3% Ethiopian53 0.3% Ukrainian52 0.3% Scotch-Irish41 0.2% Cape Verdean41 0.2% Swedish33 0.2% Greek30 0.2% West Indian27 0.1% Russian25 0.1% Lebanese19 0.1% Palestinian17 0.09% Portuguese13 0.07% Egyptian11 0.06% Dutch11 0.06% U.S. Virgin Islander9 0.05% Moroccan8 0.04% Finnish7 0.04% Barbadian2 0.01% Guyanese
Geographical mobility in Norwich Same house 1 year ago 21,663 85.4% White (Caucasian)3,546 83.6% Black or African American185 57.1% American Indian / Alaska Native2,509 84.8% Asian1,804 92.5% Other race4,309 85.6% Two or more races20,735 85.9% White alone, not Hispanic / Latino5,224 85.4% Hispanic or LatinoMoved within same county 2,229 8.8% White / Caucasian331 7.8% Black or African American55 16.9% American Indian / Alaska Native165 5.6% Asian84 4.3% Other race566 11.2% Two or more races2,140 8.9% White alone, not Hispanic / Latino560 9.2% Hispanic or LatinoMoved within same state 212 0.8% White / Caucasian71 1.7% Black or African American50 15.4% American Indian / Alaska Native63 2.1% Asian18 0.9% Other race17 0.3% Two or more races222 0.9% White alone, not Hispanic / Latino29 0.5% Hispanic or LatinoMoved from different state 1,073 4.2% White / Caucasian289 6.8% Black or African American4 1.2% American Indian / Alaska Native209 7.0% Asian52 2.7% Other race79 1.6% Two or more races896 3.7% White alone, not Hispanic / Latino291 4.8% Hispanic or LatinoMoved from abroad 16 0.8% Other race15 0.2% Hispanic or Latino
Children Nativity (place of birth) in Norwich
Children under 6 years - Living with two parents Both parents native 754 100.0% NativeBoth parents foreign-born 288 100.0% NativeOne native, one foreign-born parent 198 100.0% NativeChildren under 6 years - Living with one parent Native parent 731 100.0% NativeForeign-born parent 112 100.0% NativeChildren 6 to 17 years - Living with two parents Both parents native 1,655 100.0% NativeBoth parents foreign-born 285 93.6% Native19 6.4% Foreign-bornOne native, one foreign-born parent 98 100.0% NativeChildren 6 to 17 years - Living with one parent Native parent 2,182 100.0% NativeForeign-born parent 671 59.3% Native461 40.7% Foreign-born
Grandparents responsible for own grandchildren in Norwich
Grandparents (30 to 59 years) White / Caucasian 24 26.2% Responsible for grandchildren67 73.8% Not responsible for grandchildrenBlack or African American 11 30.3% Responsible for grandchildren25 69.7% Not responsible for grandchildrenAsian 8 100.0% Responsible for grandchildrenWhite alone, not Hispanic / Latino 27 23.1% Responsible for grandchildren90 76.9% Not responsible for grandchildrenGrandparents (60 years and over) White / Caucasian 22 13.3% Responsible for grandchildren147 86.7% Not responsible for grandchildrenBlack or African American 49 100.0% Not responsible for grandchildrenAsian 59 62.2% Responsible for grandchildren36 37.8% Not responsible for grandchildrenWhite alone, not Hispanic / Latino 24 13.3% Responsible for grandchildren155 86.7% Not responsible for grandchildren