Races in Northwest Yakima, Washington (WA) Detailed Stats
Ancestries, Foreign-born residents, place of birth
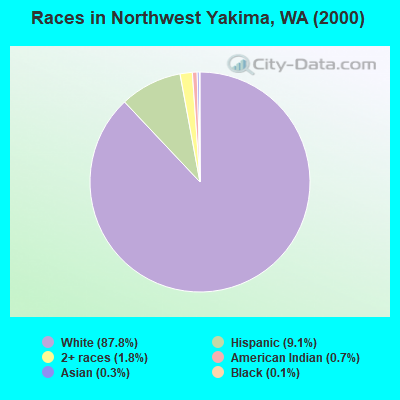
Race distribution in Northwest Yakima

- 7,08187.8%White alone
- 7319.1%Hispanic
- 1471.8%Two or more races
- 600.7%American Indian alone
- 240.3%Asian alone
- 120.1%Black alone
- 70.09%Other race alone
- 30.04%Native Hawaiian and Other
Pacific Islander alone
2000
2022
-
- 4,652,49078.9%White alone
- 441,5097.5%Hispanic
- 319,4015.4%Asian alone
- 184,6313.1%Black alone
- 175,9263.0%Two or more races
- 85,3961.4%American Indian alone
- 22,7790.4%Native Hawaiian and Other
Pacific Islander alone - 11,9890.2%Other race alone

-
- 4,941,45663.5%White alone
- 1,093,31314.0%Hispanic
- 755,8329.7%Asian alone
- 523,4486.7%Two or more races
- 299,5373.8%Black alone
- 69,0240.9%American Indian alone
- 52,2310.7%Native Hawaiian and Other
Pacific Islander alone - 50,9450.7%Other race alone

Income and house value in Northwest Yakima
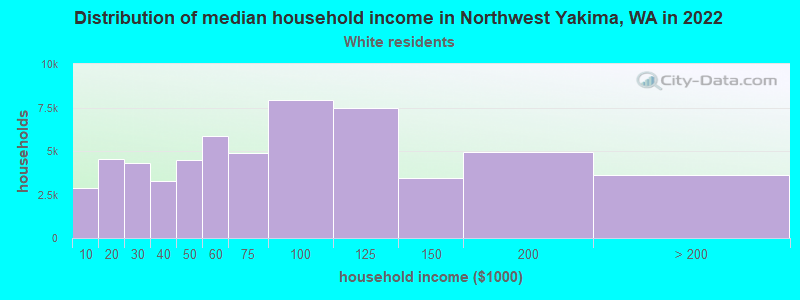
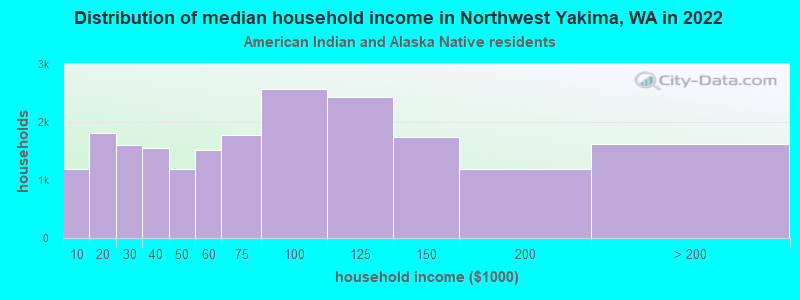
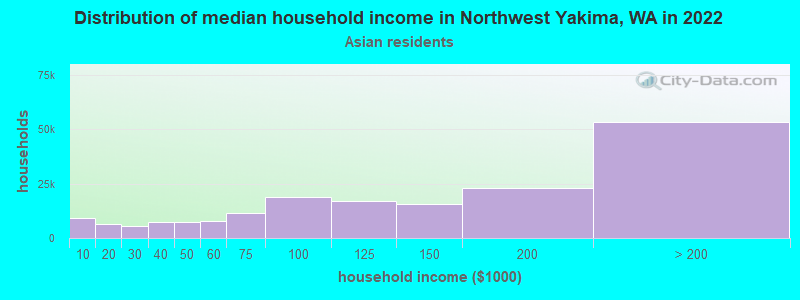
- Median household income in 2022
- $77,796White non-Hispanic householders
- $80,653American Indian and Alaska Native householders
- $155,754Asian householders
- $49,973Some other race householders
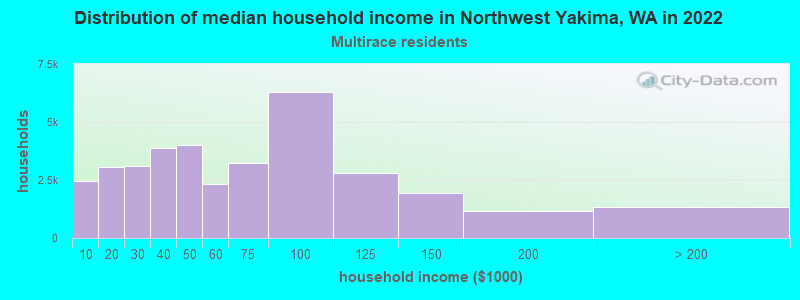
- $96,553Two or more races householders
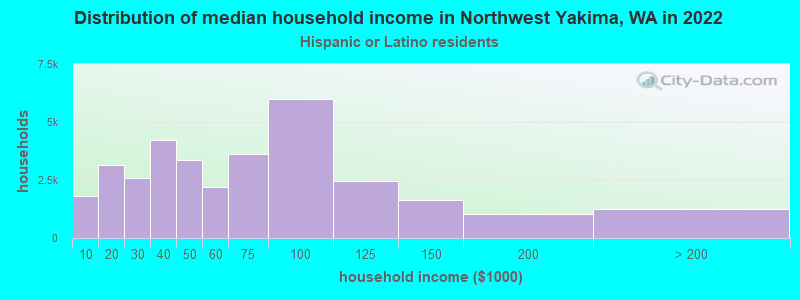
- $53,353Hispanic or Latino race householders
- Median 2022 house value
- $396,268White Non-Hispanic householders
- $314,832American Indian or Alaska Native householders
- $265,858Asian householders
- $361,567Some other race householders
- $372,201Two or more races householders
- $375,559Hispanic or Latino householders
Household income for White non-Hispanic householders
Household income for American Indian and Alaska Native householders
Household income for Asian householders
Household income for Two or more races householders
Household income for Hispanic or Latino race householders
Zip code: 98937