Races in Northwest Grayson, Texas (TX) Detailed Stats
Ancestries, Foreign-born residents, place of birth
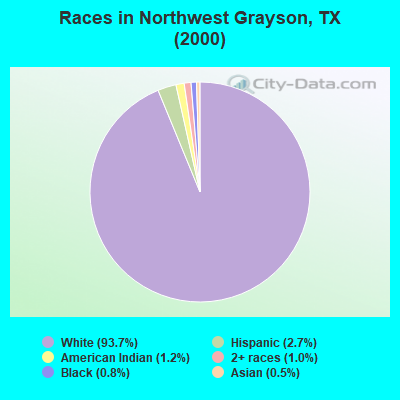
Race distribution in Northwest Grayson

- 20,18093.7%White alone
- 5842.7%Hispanic
- 2621.2%American Indian alone
- 2211.0%Two or more races
- 1750.8%Black alone
- 1050.5%Asian alone
- 70.03%Other race alone
- 40.02%Native Hawaiian and Other
Pacific Islander alone
2000
2022
-
- 10,933,31352.4%White alone
- 6,669,66632.0%Hispanic
- 2,364,25511.3%Black alone
- 554,4452.7%Asian alone
- 230,5671.1%Two or more races
- 68,8590.3%American Indian alone
- 19,9580.10%Other race alone
- 10,7570.05%Native Hawaiian and Other
Pacific Islander alone

-
- 12,070,64240.2%Hispanic
- 11,683,43038.9%White alone
- 3,508,70611.7%Black alone
- 1,608,1735.4%Asian alone
- 956,5603.2%Two or more races
- 125,7630.4%Other race alone
- 47,0230.2%American Indian alone
- 29,2750.10%Native Hawaiian and Other
Pacific Islander alone

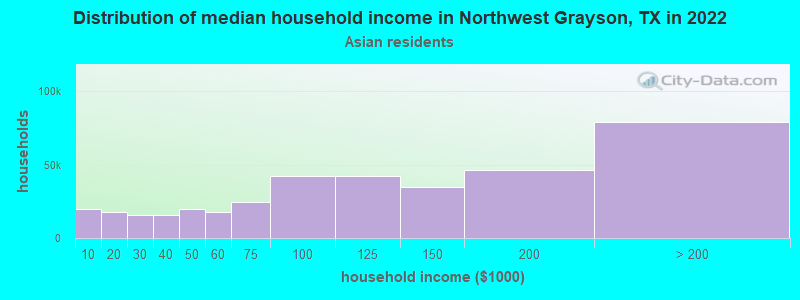
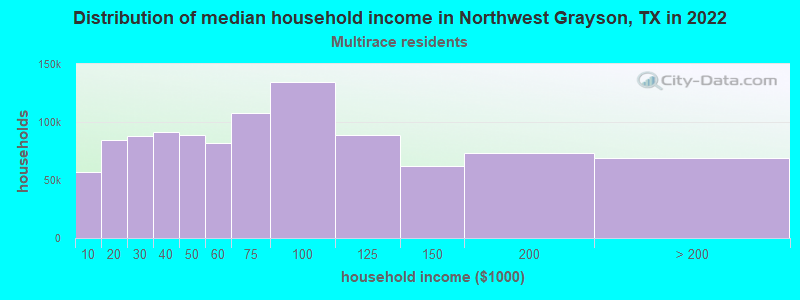
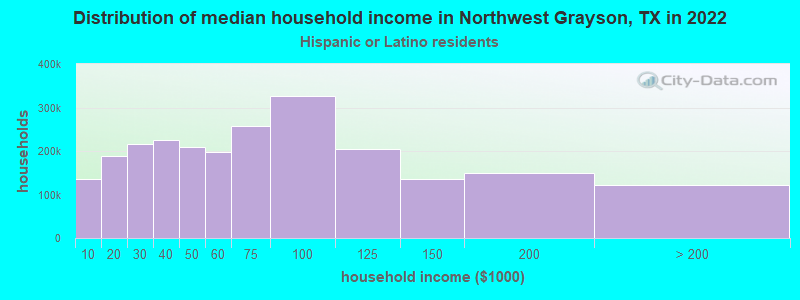
Income and house value in Northwest Grayson
- Median household income in 2022
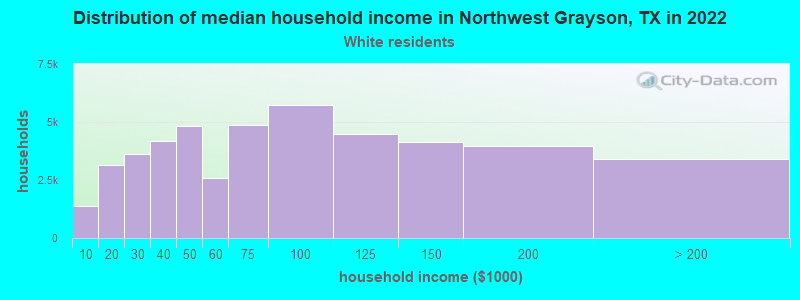
- $71,760White non-Hispanic householders
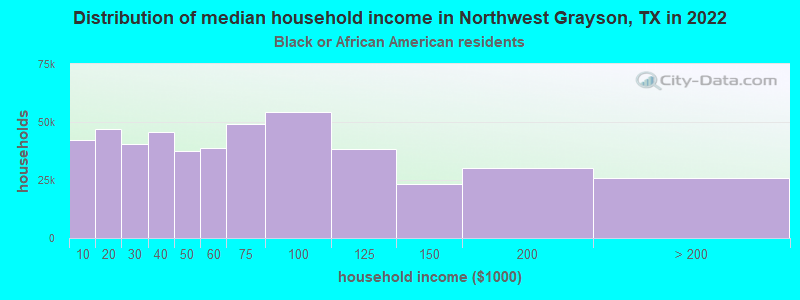
- $39,151Black householders
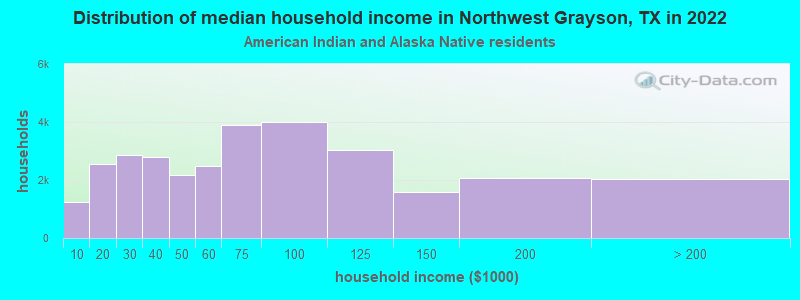
- $39,736American Indian and Alaska Native householders
- $51,172Asian householders
- $94,102Some other race householders
- $63,062Two or more races householders
- $73,325Hispanic or Latino race householders
- Median 2022 house value
- $281,535White Non-Hispanic householders
- $166,261Black or African American householders
- $157,024American Indian or Alaska Native householders
- $631,053Asian householders
- $83,130Some other race householders
- $236,090Two or more races householders
- $245,696Hispanic or Latino householders
Household income for White non-Hispanic householders
Household income for Black householders
Household income for American Indian and Alaska Native householders
Household income for Asian householders
Household income for Two or more races householders
Household income for Hispanic or Latino race householders
Zip code: 75076