Races in Northwest Benton, Washington (WA) Detailed Stats
Ancestries, Foreign-born residents, place of birth
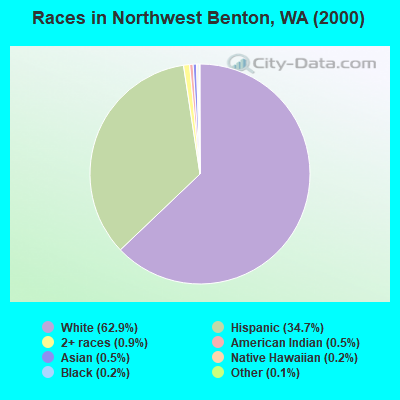
Race distribution in Northwest Benton

- 7,47262.9%White alone
- 4,11634.7%Hispanic
- 1070.9%Two or more races
- 570.5%Asian alone
- 580.5%American Indian alone
- 220.2%Black alone
- 280.2%Native Hawaiian and Other
Pacific Islander alone - 170.1%Other race alone
2000
2022
-
- 4,652,49078.9%White alone
- 441,5097.5%Hispanic
- 319,4015.4%Asian alone
- 184,6313.1%Black alone
- 175,9263.0%Two or more races
- 85,3961.4%American Indian alone
- 22,7790.4%Native Hawaiian and Other
Pacific Islander alone - 11,9890.2%Other race alone

-
- 4,941,45663.5%White alone
- 1,093,31314.0%Hispanic
- 755,8329.7%Asian alone
- 523,4486.7%Two or more races
- 299,5373.8%Black alone
- 69,0240.9%American Indian alone
- 52,2310.7%Native Hawaiian and Other
Pacific Islander alone - 50,9450.7%Other race alone

Income and house value in Northwest Benton
- Median household income in 2022
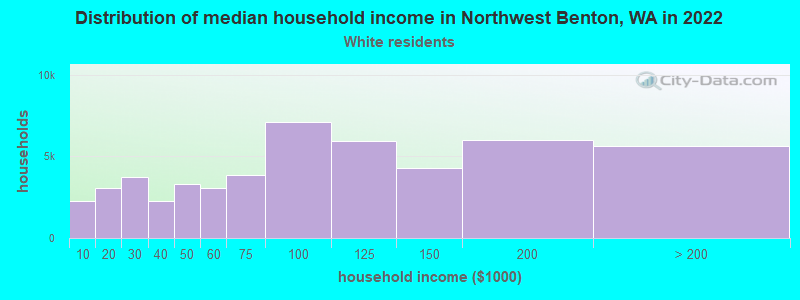
- $80,132White non-Hispanic householders
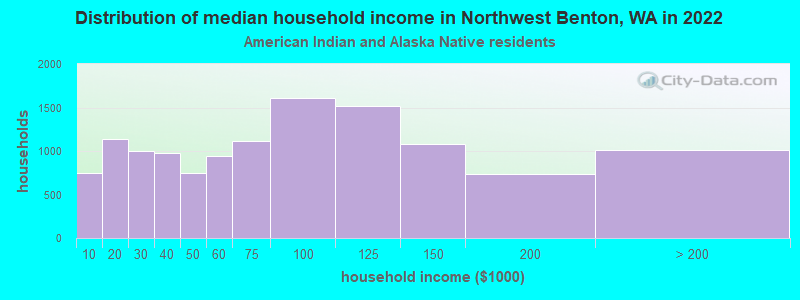
- $56,986American Indian and Alaska Native householders
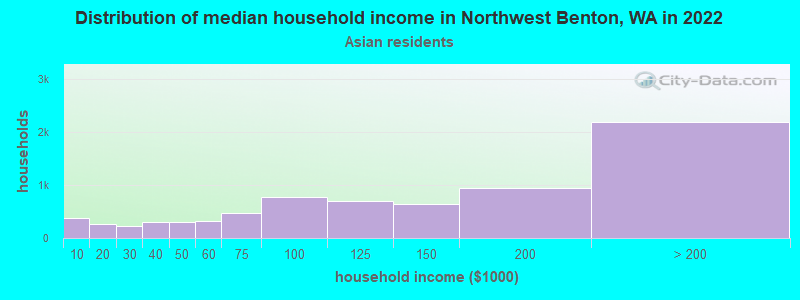
- $4,060Asian householders
- $53,476Some other race householders
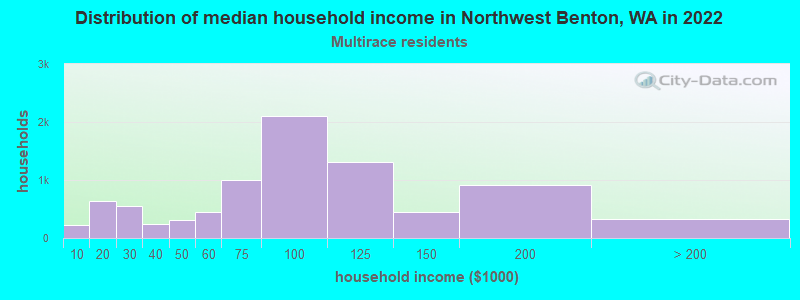
- $77,444Two or more races householders
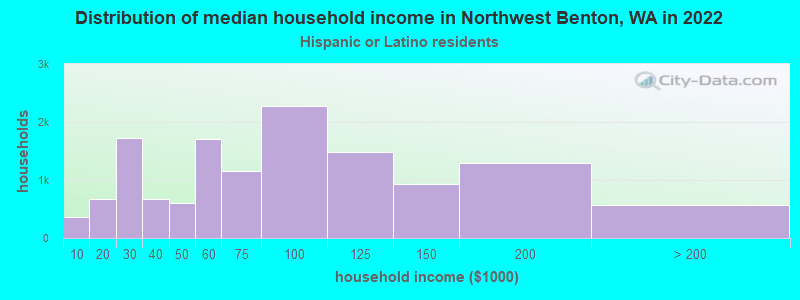
- $61,819Hispanic or Latino race householders
- Median 2022 house value
- $404,125White Non-Hispanic householders
- $265,872American Indian or Alaska Native householders
- $316,210Some other race householders
- $274,734Two or more races householders
- $315,501Hispanic or Latino householders
Household income for White non-Hispanic householders
Household income for American Indian and Alaska Native householders
Household income for Asian householders
Household income for Two or more races householders
Household income for Hispanic or Latino race householders
Zip code: 99350