Races in Northfield, New Jersey (NJ) Detailed Stats
Ancestries, Foreign-born residents, place of birth
Settings
X


Recent posts about races in Northfield, New Jersey on our local forum with over 2,400,000 registered users:

Latest news about races in Northfield, NJ collected exclusively by city-data.com from local newspapers, TV, and radio stations
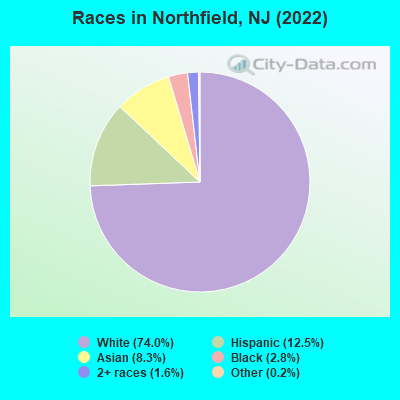
According to 2022 data, the most numerous races in Northfield, NJ are White alone (6,270 residents), Hispanic (1,057 residents), and Black alone (238 residents). 82.3% of Northfield residents speak English at home. 11.5% of Northfield, NJ residents are foreign-born (5.7% born in Asia, 3.2% born in Latin America, 2.0% born in Europe), which is 100.7% less than the foreign-born rate of 23.0% across the entire state of New Jersey.
Race distribution in Northfield
2000
2022

- 6,93889.8%White alone
- 3384.4%Hispanic
- 1922.5%Asian alone
- 1792.3%Black alone
- 741.0%Two or more races
- 30.04%American Indian alone
- 10.01%Native Hawaiian and Other
Pacific Islander alone

-
- 6,27074.0%White alone
- 1,05712.5%Hispanic
- 7018.3%Asian alone
- 2382.8%Black alone
- 1351.6%Two or more races
- 200.2%Other race alone
2000
2022
-
- 5,557,20966.0%White alone
- 1,117,19113.3%Hispanic
- 1,096,17113.0%Black alone
- 477,0125.7%Asian alone
- 133,6891.6%Two or more races
- 19,5650.2%Other race alone
- 11,3380.1%American Indian alone
- 2,1750.03%Native Hawaiian and Other
Pacific Islander alone

-
- 4,766,47651.5%White alone
- 2,028,47021.9%Hispanic
- 1,111,63212.0%Black alone
- 923,54610.0%Asian alone
- 332,2373.6%Two or more races
- 89,8471.0%Other race alone
- 8,5570.09%American Indian alone
- 9340.01%Native Hawaiian and Other
Pacific Islander alone

Income and house value in Northfield
- Median household income in 2022
- $101,207White non-Hispanic householders
- over $200,000Black householders
- over $200,000Asian householders
- $75,798Some other race householders
- $149,082Two or more races householders
- $129,017Hispanic or Latino race householders
- Median 2022 house value
- $288,610White Non-Hispanic householders
- $303,446Black or African American householders
- $191,058American Indian or Alaska Native householders
- $342,556Asian householders
- $244,330Some other race householders
- $309,065Two or more races householders
- $241,408Hispanic or Latino householders
Household income for White non-Hispanic householders

Household income for Black householders

Household income for Asian householders

Household income for Some other race householders

Household income for Two or more races householders

Household income for Hispanic or Latino race householders

Median age by race in Northfield
- 48.3Median age for White residents
- 44.1Males
- 51.0Females
- 33.8Median age for Black or African American residents
- 29.1Males
- 55.6Females
- -650,046,167.4Median age for American Indian / Alaska Native residents
- -590,299,277.0Males
- -877,192,981.6Females
- 45.6Median age for Asian residents
- 41.8Males
- 43.7Females
- -804,177,544.9Median age for Native Hawaiian / Pacific Islander residents
- -860,335,194.7Males
- -713,070,378.3Females
- 66.4Median age for Other race residents
- 53.4Males
- 68.5Females
- 28.2Median age for Two or more races residents
- 19.8Males
- 34.9Females
- 49.4Median age for White alone residents
- 43.8Males
- 52.6Females
- 29.8Median age for Hispanic or Latino residents
- 35.5Males
- 20.0Females
Owner/renter occupied households by race in Northfield
- House owners and renters - White residents
- 2,38689.7%Owner occupied
- 27510.3%Renter occupied
- House owners and renters - Black or African American residents
- 45100.0%Owner occupied
- House owners and renters - Asian residents
- 21391.0%Owner occupied
- 219.0%Renter occupied
- House owners and renters - Other race residents
- 101100.0%Owner occupied
- House owners and renters - Two or more races residents
- 14191.9%Owner occupied
- 128.1%Renter occupied
- House owners and renters - White alone residents
- 2,34688.9%Owner occupied
- 29311.1%Renter occupied
- House owners and renters - Hispanic or Latino residents
- 247100.0%Owner occupied
Language usage in Northfield
- English speakers - Total
- 82.3% of residents of Northfield speak English at home.
- 6.9% of residents speak Spanish at home
- 37265.1%Speak English very well
- 19934.9%Speak English less than very well
- 11.2% of residents speak other language at home
- 55860.5%Speak English very well
- 36439.5%Speak English less than very well
- English speakers - Born in the United States
- 89.0% of residents of Northfield speak English at home.
- 4.6% of residents speak Spanish at home
- 5151.5%Speak English very well
- 4848.5%Speak English less than very well
- 6.1% of residents speak other language at home
- 11890.1%Speak English very well
- 139.9%Speak English less than very well
- English speakers - Native, born elsewhere
- 10.7% of residents of Northfield speak English at home.
- 92.6% of residents speak Spanish at home
- 2824.8%Speak English very well
- 8575.2%Speak English less than very well
- 2.5% of residents speak other language at home
- 3100.0%Speak English less than very well
- English speakers - Foreign-born
- 11.3% of residents of Northfield speak English at home.
- 22.7% of residents speak Spanish at home
- 11758.5%Speak English very well
- 8341.5%Speak English less than very well
- 63.5% of residents speak other language at home
- 28250.4%Speak English very well
- 27849.6%Speak English less than very well
White (Caucasian) - Speak only English
| Native: | 97.9% (5,926) |
| Foreign-born: | 22.6% (35) |
White (Caucasian) - Speak another language
| Native: | 2.8% (170) |
| Foreign-born: | 77.7% (120) |
Black or African American - Speak only English
| Native: | 100.0% (242) |
| Foreign-born: | 94.7% (5) |
Asian - Speak only English
| Native: | 15.2% (42) |
| Foreign-born: | 11.6% (55) |
Asian - Speak another language
| Native: | 89.4% (249) |
| Foreign-born: | 88.8% (423) |
Other race - Speak another language
| Native: | 77.0% (81) |
| Foreign-born: | 97.5% (105) |
Two or more races - Speak another language
| Native: | 32.2% (150) |
| Foreign-born: | 94.7% (121) |
White alone - Speak only English
| Native: | 97.1% (5,763) |
| Foreign-born: | 17.6% (37) |
White alone - Speak another language
| Native: | 2.9% (172) |
| Foreign-born: | 84.2% (175) |
Hispanic or Latino - Speak another language
| Native: | 44.7% (326) |
| Foreign-born: | 97.9% (230) |
Foreign-born residents in Northfield
971 residents are foreign born (5.7% Asia, 3.2% Latin America, 2.0% Europe).
| This city: | 11.5% |
| New Jersey: | 23.2% |


Marital status for residents in Northfield
Marital status - White (Caucasian) population 15 years and over
- Males
- 37.0%Never married
- 49.5%Now married
- 0.0%Separated
- 3.1%Widowed
- 10.4%Divorced
- Females
- 22.5%Never married
- 47.7%Now married
- 1.8%Separated
- 11.6%Widowed
- 16.3%Divorced
Women who gave birth in the past 12 months
| Now married: | 100.0% (25) |
| Unmarried: | 0.0% (0) |
Women who did not give birth in the past 12 months
| Now married: | 46.7% (517) |
| Unmarried: | 53.3% (591) |
Marital status - Black or African American population 15 years and over
- Males
- 64.1%Never married
- 17.9%Now married
- 0.0%Separated
- 10.3%Widowed
- 7.7%Divorced
- Females
- 18.3%Never married
- 42.3%Now married
- 0.0%Separated
- 0.0%Widowed
- 39.4%Divorced
Women who did not give birth in the past 12 months
| Now married: | 0.0% (0) |
| Unmarried: | 100.0% (12) |
Marital status - Asian population 15 years and over
- Males
- 38.0%Never married
- 62.0%Now married
- 0.0%Separated
- 0.0%Widowed
- 0.0%Divorced
- Females
- 15.4%Never married
- 81.0%Now married
- 0.0%Separated
- 0.0%Widowed
- 3.6%Divorced
Women who did not give birth in the past 12 months
| Now married: | 69.3% (81) |
| Unmarried: | 30.7% (36) |
Marital status - Other race population 15 years and over
- Males
- 37.0%Never married
- 28.7%Now married
- 5.6%Separated
- 0.0%Widowed
- 28.7%Divorced
- Females
- 30.4%Never married
- 55.1%Now married
- 0.0%Separated
- 14.5%Widowed
- 0.0%Divorced
Women who did not give birth in the past 12 months
| Now married: | 0.0% (0) |
| Unmarried: | 100.0% (13) |
Marital status - Two or more races population 15 years and over
- Males
- 55.1%Never married
- 44.9%Now married
- 0.0%Separated
- 0.0%Widowed
- 0.0%Divorced
- Females
- 15.4%Never married
- 82.1%Now married
- 0.0%Separated
- 0.0%Widowed
- 2.5%Divorced
Women who gave birth in the past 12 months
| Now married: | 100.0% (47) |
| Unmarried: | 0.0% (0) |
Women who did not give birth in the past 12 months
| Now married: | 77.3% (111) |
| Unmarried: | 22.7% (33) |
Marital status - White alone, not Hispanic / Latino population 15 years and over
- Males
- 38.0%Never married
- 50.0%Now married
- 0.0%Separated
- 2.0%Widowed
- 10.0%Divorced
- Females
- 21.6%Never married
- 48.6%Now married
- 0.9%Separated
- 12.0%Widowed
- 16.9%Divorced
Women who gave birth in the past 12 months
| Now married: | 100.0% (27) |
| Unmarried: | 0.0% (0) |
Women who did not give birth in the past 12 months
| Now married: | 46.3% (512) |
| Unmarried: | 53.7% (593) |
Marital status - Hispanic or Latino population 15 years and over
- Males
- 31.2%Never married
- 43.6%Now married
- 0.0%Separated
- 9.7%Widowed
- 15.5%Divorced
- Females
- 27.7%Never married
- 59.7%Now married
- 9.2%Separated
- 3.3%Widowed
- 0.0%Divorced
Women who gave birth in the past 12 months
| Now married: | 100.0% (37) |
| Unmarried: | 0.0% (0) |
Women who did not give birth in the past 12 months
| Now married: | 64.4% (138) |
| Unmarried: | 35.6% (76) |
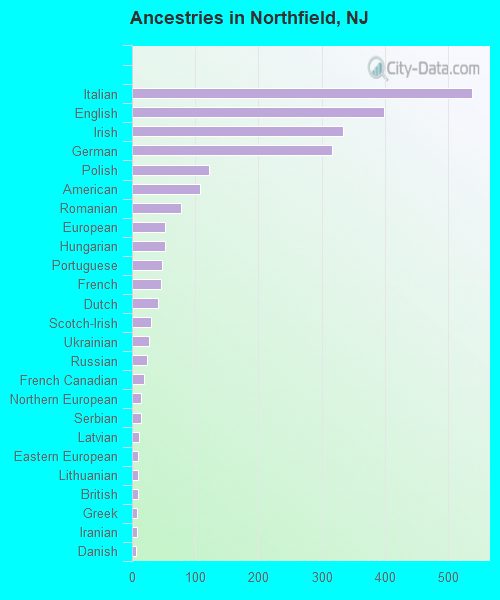
Ancestries in Northfield

- 53815.4%Italian
- 39811.4%English
- 3349.6%Irish
- 3179.1%German
- 1223.5%Polish
- 1083.1%American
- 782.2%Romanian
- 531.5%European
- 531.5%Hungarian
- 471.3%Portuguese
- 461.3%French
- 411.2%Dutch
- 300.9%Scotch-Irish
- 270.8%Ukrainian
- 230.7%Russian
- 190.5%French Canadian
- 150.4%Northern European
- 140.4%Serbian
- 110.3%Latvian
- 100.3%Eastern European
- 100.3%Lithuanian
- 90.3%British
- 80.2%Greek
- 80.2%Iranian
- 70.2%Danish
- 60.2%Welsh
- 50.1%Kenyan
- 40.1%Scottish
Geographical mobility in Northfield

- Same house 1 year ago
- 5,80691.9%White (Caucasian)
- 23594.5%Black or African American
- 57179.4%Asian
- 19388.2%Other race
- 40460.3%Two or more races
- 5,82392.7%White alone, not Hispanic / Latino
- 72369.3%Hispanic or Latino

-
- Moved within same county
- 3555.6%White / Caucasian
- 218.5%Black or African American
- 7210.0%Asian
- 146.5%Other race
- 9714.5%Two or more races
- 3165.0%White alone, not Hispanic / Latino
- 14413.8%Hispanic or Latino

-
- Moved within same state
- 360.6%White / Caucasian
- 10.3%Black or African American
- 8913.3%Two or more races
- 380.6%White alone, not Hispanic / Latino
- 585.5%Hispanic or Latino

-
- Moved from different state
- 741.2%White / Caucasian
- 157.0%Other race
- 631.0%White alone, not Hispanic / Latino
- 232.2%Hispanic or Latino

-
- Moved from abroad
- 100.2%White
- 436.0%Asian
- 100.2%White alone, not Hispanic / Latino

Children Nativity (place of birth) in Northfield
Place of birth for residents in Northfield
![Place of birth for the foreign-born population - Regions]()
- 492Asia
- 297Americas
- 276Latin America
- 255South Central Asia
- 225Eastern Asia
- 197China
- 175Europe
- 133Caribbean
- 129Eastern Europe
- 105South America
- 37Central America
- 21Northern America
- 20Northern Europe
- 16Western Europe
- 11South Eastern Asia
- 10Southern Europe
- 6Africa
- 6Eastern Africa

![Place of birth for the foreign-born population - Countries]()
- 223Bangladesh
- 193China
- 133Dominican Republic
- 88Poland
- 86Peru
- 37Romania
- 24India
- 21Canada
- 17Mexico
- 16Korea
- 14Ecuador
- 12England
- 12Japan
- 11Philippines
- 10Germany
- 10Italy
- 10Honduras
- 10Nicaragua
- 8Ireland
- 7Iran
- 6Netherlands
- 6Kenya
- 5Colombia
- 4Taiwan
- 3Ukraine

Grandparents responsible for own grandchildren in Northfield
Zip codes: 08225.