Races in North Whidbey, Washington (WA) Detailed Stats
Ancestries, Foreign-born residents, place of birth
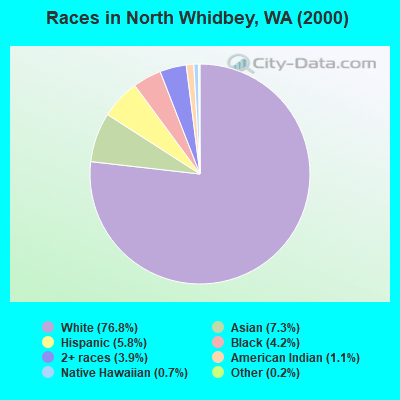
Race distribution in North Whidbey

- 26,66876.8%White alone
- 2,5437.3%Asian alone
- 2,0205.8%Hispanic
- 1,4614.2%Black alone
- 1,3713.9%Two or more races
- 3791.1%American Indian alone
- 2310.7%Native Hawaiian and Other
Pacific Islander alone - 640.2%Other race alone
2000
2022
-
- 4,652,49078.9%White alone
- 441,5097.5%Hispanic
- 319,4015.4%Asian alone
- 184,6313.1%Black alone
- 175,9263.0%Two or more races
- 85,3961.4%American Indian alone
- 22,7790.4%Native Hawaiian and Other
Pacific Islander alone - 11,9890.2%Other race alone

-
- 4,941,45663.5%White alone
- 1,093,31314.0%Hispanic
- 755,8329.7%Asian alone
- 523,4486.7%Two or more races
- 299,5373.8%Black alone
- 69,0240.9%American Indian alone
- 52,2310.7%Native Hawaiian and Other
Pacific Islander alone - 50,9450.7%Other race alone

Income and house value in North Whidbey
- Median household income in 2022
- $76,567White non-Hispanic householders
- $57,790Black householders
- $74,386American Indian and Alaska Native householders
- $65,656Asian householders
- $60,596Some other race householders
- $54,666Two or more races householders
- $78,663Hispanic or Latino race householders
- Median 2022 house value
- $567,414White Non-Hispanic householders
- $543,949Black or African American householders
- $431,604American Indian or Alaska Native householders
- $532,928Asian householders
- $511,241Native Hawaiian and other Pacific Islander householders
- $508,752Some other race householders
- $412,050Two or more races householders
- $513,374Hispanic or Latino householders
Household income for White non-Hispanic householders

Household income for Black householders

Household income for American Indian and Alaska Native householders

Household income for Asian householders

Household income for Native Hawaiian and other Pacific Islander householders

Household income for Two or more races householders

Household income for Hispanic or Latino race householders

Zip code: 98277