Races in North Potomac, Maryland (MD) Detailed Stats
Data:
Races - White alone (%)
Races - White alone (% change since 2000)
Races - Black alone (%)
Races - Black alone (% change since 2000)
Races - American Indian alone (%)
Races - American Indian alone (% change since 2000)
Races - Asian alone (%)
Races - Asian alone (% change since 2000)
Races - Hispanic (%)
Races - Hispanic (% change since 2000)
Races - Native Hawaiian and Other Pacific Islander alone (%)
Races - Native Hawaiian and Other Pacific Islander alone (% change since 2000)
Races - Two or more races(%)
Races - Two or more races(% change since 2000)
Races - Other race alone (%)
Races - Other race alone (% change since 2000)
Racial diversity
Place of birth - Born in state of residence (%)
Place of birth - Born in state of residence (%) - White
Place of birth - Born in state of residence (%) - Black or African American
Place of birth - Born in state of residence (%) - Asian
Place of birth - Born in state of residence (%) - Hispanic or Latino
Place of birth - Born in state of residence (%) - American Indian and Alaska Native
Place of birth - Born in state of residence (%) - Multirace
Place of birth - Born in state of residence (%) - Other Race
Place of birth - Born in other state (%)
Place of birth - Born in other state (%) - White
Place of birth - Born in other state (%) - Black or African American
Place of birth - Born in other state (%) - Asian
Place of birth - Born in other state (%) - Hispanic or Latino
Place of birth - Born in other state (%) - American Indian and Alaska Native
Place of birth - Born in other state (%) - Multirace
Place of birth - Born in other state (%) - Other Race
Place of birth - Native, outside of US (%)
Place of birth - Native, outside of US (%) - White
Place of birth - Native, outside of US (%) - Black or African American
Place of birth - Native, outside of US (%) - Asian
Place of birth - Native, outside of US (%) - Hispanic or Latino
Place of birth - Native, outside of US (%) - American Indian and Alaska Native
Place of birth - Native, outside of US (%) - Multirace
Place of birth - Native, outside of US (%) - Other Race
Place of birth - Foreign born (%)
Place of birth - Foreign born (%) - White
Place of birth - Foreign born (%) - Black or African American
Place of birth - Foreign born (%) - Asian
Place of birth - Foreign born (%) - Hispanic or Latino
Place of birth - Foreign born (%) - American Indian and Alaska Native
Place of birth - Foreign born (%) - Multirace
Place of birth - Foreign born (%) - Other Race
Residents speaking English at home (%)
Residents speaking English at home - Born in the United States (%)
Residents speaking English at home - Native, born elsewhere (%)
Residents speaking English at home - Foreign born (%)
Residents speaking Spanish at home (%)
Residents speaking Spanish at home - Born in the United States (%)
Residents speaking Spanish at home - Native, born elsewhere (%)
Residents speaking Spanish at home - Foreign born (%)
Residents speaking other language at home (%)
Residents speaking other language at home - Born in the United States (%)
Residents speaking other language at home - Native, born elsewhere (%)
Residents speaking other language at home - Foreign born (%)
Marital status - Never married (%)
Marital status - Now married (%)
Marital status - Separated (%)
Marital status - Widowed (%)
Marital status - Divorced (%)
Ancestries Reported - Arab (%)
Ancestries Reported - Czech (%)
Ancestries Reported - Danish (%)
Ancestries Reported - Dutch (%)
Ancestries Reported - English (%)
Ancestries Reported - French (%)
Ancestries Reported - French Canadian (%)
Ancestries Reported - German (%)
Ancestries Reported - Greek (%)
Ancestries Reported - Hungarian (%)
Ancestries Reported - Irish (%)
Ancestries Reported - Italian (%)
Ancestries Reported - Lithuanian (%)
Ancestries Reported - Norwegian (%)
Ancestries Reported - Polish (%)
Ancestries Reported - Portuguese (%)
Ancestries Reported - Russian (%)
Ancestries Reported - Scotch-Irish (%)
Ancestries Reported - Scottish (%)
Ancestries Reported - Slovak (%)
Ancestries Reported - Subsaharan African (%)
Ancestries Reported - Swedish (%)
Ancestries Reported - Swiss (%)
Ancestries Reported - Ukrainian (%)
Ancestries Reported - United States (%)
Ancestries Reported - Welsh (%)
Ancestries Reported - West Indian (%)
Ancestries Reported - Other (%)
Geographical mobility - Same house 1 year ago (%)
Geographical mobility - Same house 1 year ago (%) - White
Geographical mobility - Same house 1 year ago (%) - Black or African American
Geographical mobility - Same house 1 year ago (%) - Asian
Geographical mobility - Same house 1 year ago (%) - Hispanic or Latino
Geographical mobility - Same house 1 year ago (%) - American Indian and Alaska Native
Geographical mobility - Same house 1 year ago (%) - Multirace
Geographical mobility - Same house 1 year ago (%) - Other Race
Geographical mobility - Moved within same county (%)
Geographical mobility - Moved within same county (%) - White
Geographical mobility - Moved within same county (%) - Black or African American
Geographical mobility - Moved within same county (%) - Asian
Geographical mobility - Moved within same county (%) - Hispanic or Latino
Geographical mobility - Moved within same county (%) - American Indian and Alaska Native
Geographical mobility - Moved within same county (%) - Multirace
Geographical mobility - Moved within same county (%) - Other Race
Geographical mobility - Moved from different county within same state (%)
Geographical mobility - Moved from different county within same state (%) - White
Geographical mobility - Moved from different county within same state (%) - Black or African American
Geographical mobility - Moved from different county within same state (%) - Asian
Geographical mobility - Moved from different county within same state (%) - Hispanic or Latino
Geographical mobility - Moved from different county within same state (%) - American Indian and Alaska Native
Geographical mobility - Moved from different county within same state (%) - Multirace
Geographical mobility - Moved from different county within same state (%) - Other Race
Geographical mobility - Moved from different state (%)
Geographical mobility - Moved from different state (%) - White
Geographical mobility - Moved from different state (%) - Black or African American
Geographical mobility - Moved from different state (%) - Asian
Geographical mobility - Moved from different state (%) - Hispanic or Latino
Geographical mobility - Moved from different state (%) - American Indian and Alaska Native
Geographical mobility - Moved from different state (%) - Multirace
Geographical mobility - Moved from different state (%) - Other Race
Geographical mobility - Moved from abroad (%)
Geographical mobility - Moved from abroad (%) - White
Geographical mobility - Moved from abroad (%) - Black or African American
Geographical mobility - Moved from abroad (%) - Asian
Geographical mobility - Moved from abroad (%) - Hispanic or Latino
Geographical mobility - Moved from abroad (%) - American Indian and Alaska Native
Geographical mobility - Moved from abroad (%) - Multirace
Geographical mobility - Moved from abroad (%) - Other Race
Place of birth for the foreign-born population - Ireland (%)
Place of birth for the foreign-born population - Denmark (%)
Place of birth for the foreign-born population - Norway (%)
Place of birth for the foreign-born population - Sweden (%)
Place of birth for the foreign-born population - United Kingdom (%)
Place of birth for the foreign-born population - England (%)
Place of birth for the foreign-born population - Scotland (%)
Place of birth for the foreign-born population - Other Northern Europe (%)
Place of birth for the foreign-born population - Austria (%)
Place of birth for the foreign-born population - Belgium (%)
Place of birth for the foreign-born population - France (%)
Place of birth for the foreign-born population - Germany (%)
Place of birth for the foreign-born population - Netherlands (%)
Place of birth for the foreign-born population - Switzerland (%)
Place of birth for the foreign-born population - Other Western Europe (%)
Place of birth for the foreign-born population - Greece (%)
Place of birth for the foreign-born population - Italy (%)
Place of birth for the foreign-born population - Portugal (%)
Place of birth for the foreign-born population - Spain (%)
Place of birth for the foreign-born population - Other Southern Europe (%)
Place of birth for the foreign-born population - Albania (%)
Place of birth for the foreign-born population - Belarus (%)
Place of birth for the foreign-born population - Bosnia and Herzegovina (%)
Place of birth for the foreign-born population - Bulgaria (%)
Place of birth for the foreign-born population - Croatia (%)
Place of birth for the foreign-born population - Czechoslovakia (%)
Place of birth for the foreign-born population - Hungary (%)
Place of birth for the foreign-born population - Latvia (%)
Place of birth for the foreign-born population - Lithuania (%)
Place of birth for the foreign-born population - North Macedonia (Macedonia) (%)
Place of birth for the foreign-born population - Moldova (%)
Place of birth for the foreign-born population - Poland (%)
Place of birth for the foreign-born population - Romania (%)
Place of birth for the foreign-born population - Russia (%)
Place of birth for the foreign-born population - Serbia (%)
Place of birth for the foreign-born population - Ukraine (%)
Place of birth for the foreign-born population - Other Eastern Europe (%)
Place of birth for the foreign-born population - China (%)
Place of birth for the foreign-born population - Hong Kong (%)
Place of birth for the foreign-born population - Taiwan (%)
Place of birth for the foreign-born population - Japan (%)
Place of birth for the foreign-born population - Korea (%)
Place of birth for the foreign-born population - Other Eastern Asia (%)
Place of birth for the foreign-born population - Afghanistan (%)
Place of birth for the foreign-born population - Bangladesh (%)
Place of birth for the foreign-born population - India (%)
Place of birth for the foreign-born population - Iran (%)
Place of birth for the foreign-born population - Kazakhstan (%)
Place of birth for the foreign-born population - Nepal (%)
Place of birth for the foreign-born population - Pakistan (%)
Place of birth for the foreign-born population - Sri Lanka (%)
Place of birth for the foreign-born population - Uzbekistan (%)
Place of birth for the foreign-born population - Other South Central Asia (%)
Place of birth for the foreign-born population - Burma (%)
Place of birth for the foreign-born population - Cambodia (%)
Place of birth for the foreign-born population - Indonesia (%)
Place of birth for the foreign-born population - Laos (%)
Place of birth for the foreign-born population - Malaysia (%)
Place of birth for the foreign-born population - Philippines (%)
Place of birth for the foreign-born population - Singapore (%)
Place of birth for the foreign-born population - Thailand (%)
Place of birth for the foreign-born population - Vietnam (%)
Place of birth for the foreign-born population - Other South Eastern Asia (%)
Place of birth for the foreign-born population - Armenia (%)
Place of birth for the foreign-born population - Iraq (%)
Place of birth for the foreign-born population - Israel (%)
Place of birth for the foreign-born population - Jordan (%)
Place of birth for the foreign-born population - Kuwait (%)
Place of birth for the foreign-born population - Lebanon (%)
Place of birth for the foreign-born population - Saudi Arabia (%)
Place of birth for the foreign-born population - Syria (%)
Place of birth for the foreign-born population - Turkey (%)
Place of birth for the foreign-born population - Yemen (%)
Place of birth for the foreign-born population - Other Western Asia (%)
Place of birth for the foreign-born population - Eritrea (%)
Place of birth for the foreign-born population - Ethiopia (%)
Place of birth for the foreign-born population - Kenya (%)
Place of birth for the foreign-born population - Somalia (%)
Place of birth for the foreign-born population - Uganda (%)
Place of birth for the foreign-born population - Zimbabwe (%)
Place of birth for the foreign-born population - Other Eastern Africa (%)
Place of birth for the foreign-born population - Cameroon (%)
Place of birth for the foreign-born population - Congo (%)
Place of birth for the foreign-born population - Democratic Republic of Congo (Zaire) (%)
Place of birth for the foreign-born population - Other Middle Africa (%)
Place of birth for the foreign-born population - Egypt (%)
Place of birth for the foreign-born population - Morocco (%)
Place of birth for the foreign-born population - Sudan (%)
Place of birth for the foreign-born population - Other Northern Africa (%)
Place of birth for the foreign-born population - South Africa (%)
Place of birth for the foreign-born population - Other Southern Africa (%)
Place of birth for the foreign-born population - Cabo Verde (%)
Place of birth for the foreign-born population - Ghana (%)
Place of birth for the foreign-born population - Liberia (%)
Place of birth for the foreign-born population - Nigeria (%)
Place of birth for the foreign-born population - Senegal (%)
Place of birth for the foreign-born population - Sierra Leone (%)
Place of birth for the foreign-born population - Other Western Africa (%)
Place of birth for the foreign-born population - Australia (%)
Place of birth for the foreign-born population - New Zealand (%)
Place of birth for the foreign-born population - Fiji (%)
Place of birth for the foreign-born population - Micronesia (%)
Place of birth for the foreign-born population - Bahamas (%)
Place of birth for the foreign-born population - Barbados (%)
Place of birth for the foreign-born population - Cuba (%)
Place of birth for the foreign-born population - Dominica (%)
Place of birth for the foreign-born population - Dominican Republic (%)
Place of birth for the foreign-born population - Grenada (%)
Place of birth for the foreign-born population - Haiti (%)
Place of birth for the foreign-born population - Jamaica (%)
Place of birth for the foreign-born population - St. Vincent and the Grenadines (%)
Place of birth for the foreign-born population - Trinidad and Tobago (%)
Place of birth for the foreign-born population - West Indies (%)
Place of birth for the foreign-born population - Other Caribbean (%)
Place of birth for the foreign-born population - Belize (%)
Place of birth for the foreign-born population - Costa Rica (%)
Place of birth for the foreign-born population - El Salvador (%)
Place of birth for the foreign-born population - Guatemala (%)
Place of birth for the foreign-born population - Honduras (%)
Place of birth for the foreign-born population - Mexico (%)
Place of birth for the foreign-born population - Nicaragua (%)
Place of birth for the foreign-born population - Panama (%)
Place of birth for the foreign-born population - Other Central America (%)
Place of birth for the foreign-born population - Argentina (%)
Place of birth for the foreign-born population - Bolivia (%)
Place of birth for the foreign-born population - Brazil (%)
Place of birth for the foreign-born population - Chile (%)
Place of birth for the foreign-born population - Colombia (%)
Place of birth for the foreign-born population - Ecuador (%)
Place of birth for the foreign-born population - Guyana (%)
Place of birth for the foreign-born population - Peru (%)
Place of birth for the foreign-born population - Uruguay (%)
Place of birth for the foreign-born population - Venezuela (%)
Place of birth for the foreign-born population - Other South America (%)
Place of birth for the foreign-born population - Canada (%)
Place of birth for the foreign-born population - Other Northern America (%)
Place of birth for the foreign-born population - Other (%)
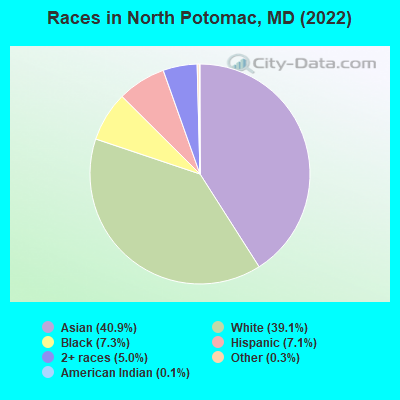
According to 2022 data, the most numerous races in North Potomac, MD are White alone (9,603 residents), Black alone (1,806 residents), and Hispanic (1,750 residents). 49.8% of North Potomac residents speak English at home. 42.6% of North Potomac, MD residents are foreign-born (28.9% born in Asia, 4.9% born in Latin America), which is 62.4% greater than the foreign-born rate of 16.0% across the entire state of Maryland.
Race distribution in North Potomac
2000 2022
3,286,547 62.1% White alone 1,464,735 27.7% Black alone 227,916 4.3% Hispanic 209,738 4.0% Asian alone 82,946 1.6% Two or more races 13,312 0.3% American Indian alone 9,379 0.2% Other race alone 1,913 0.04% Native Hawaiian and Other
2,906,492 47.1% White alone 1,800,914 29.2% Black alone 705,842 11.4% Hispanic 401,818 6.5% Asian alone 291,317 4.7% Two or more races 46,930 0.8% Other race alone 8,930 0.1% American Indian alone 2,417 0.04% Native Hawaiian and Other
Income and house value in North Potomac Median household income in 2022 $184,812 White non-Hispanic householders$126,883 Black householders$194,529 Asian householders$175,039 Some other race householders$105,753 Hispanic or Latino race householdersMedian 2022 house value $826,214 White Non-Hispanic householders$614,337 Black or African American householders$427,171 American Indian or Alaska Native householders $767,330 Asian householders$560,448 Some other race householders$513,393 Two or more races householders$684,262 Hispanic or Latino householders
Median age by race in North Potomac
49.7 Median age for White residents48.5 50.2 30.5 Median age for Black or African American residents22.8 39.2 16.8 Median age for American Indian / Alaska Native residents-555,555,555.0 18.9 46.7 Median age for Asian residents45.9 46.6 -763,333,332.6 Median age for Native Hawaiian / Pacific Islander residents-720,061,021.4 -760,942,760.2 36.4 Median age for Other race residents31.7 35.7 23.9 Median age for Two or more races residents17.4 46.6 48.9 Median age for White alone residents47.7 49.3 38.2 Median age for Hispanic or Latino residents36.6 47.5
Owner/renter occupied households by race in North Potomac
House owners and renters - White residents 3,244 85.0% Owner occupied571 15.0% Renter occupiedHouse owners and renters - Black or African American residents 305 50.3% Owner occupied301 49.7% Renter occupiedHouse owners and renters - American Indian / Alaska Native residents 20 100.0% Renter occupiedHouse owners and renters - Asian residents 3,011 89.9% Owner occupied339 10.1% Renter occupiedHouse owners and renters - Other race residents 106 66.7% Owner occupied53 33.3% Renter occupiedHouse owners and renters - Two or more races residents 377 94.1% Owner occupied24 5.9% Renter occupiedHouse owners and renters - White alone residents 3,259 86.5% Owner occupied510 13.5% Renter occupiedHouse owners and renters - Hispanic or Latino residents 353 64.5% Owner occupied194 35.5% Renter occupied
Language usage in North Potomac
English speakers - Total 49.8% of residents of North Potomac speak English at home.
5.1% of residents speak Spanish at home 761 62.5% Speak English very well456 37.5% Speak English less than very well46.1% of residents speak other language at home 7,777 71.1% Speak English very well3,163 28.9% Speak English less than very well
English speakers - Born in the United States 84.6% of residents of North Potomac speak English at home.
2.2% of residents speak Spanish at home 156 96.3% Speak English very well6 3.7% Speak English less than very well13.9% of residents speak other language at home 902 88.2% Speak English very well121 11.8% Speak English less than very well
English speakers - Native, born elsewhere 36.5% of residents of North Potomac speak English at home.
10.2% of residents speak Spanish at home 40 100.0% Speak English very well56.9% of residents speak other language at home 166 74.1% Speak English very well58 25.9% Speak English less than very well
English speakers - Foreign-born 10.7% of residents of North Potomac speak English at home.
8.7% of residents speak Spanish at home 455 50.2% Speak English very well451 49.8% Speak English less than very well80.8% of residents speak other language at home 5,635 67.2% Speak English very well2,756 32.8% Speak English less than very well
White (Caucasian) - Speak only English Native:
94.3% (7,286)Foreign-born:
17.8% (311)
White (Caucasian) - Speak another language Native:
6.1% (473)Foreign-born:
81.3% (1,420)
Black or African American - Speak only English Native:
86.8% (1,086)Foreign-born:
20.7% (120)
Black or African American - Speak another language Native:
13.2% (165)Foreign-born:
79.5% (463)
Asian - Speak only English Native:
44.8% (1,385)Foreign-born:
8.8% (587)
Asian - Speak another language Native:
55.6% (1,721)Foreign-born:
90.9% (6,054)
Other race - Speak only English Native:
41.7% (68)Foreign-born:
13.5% (44)
Other race - Speak another language Native:
62.9% (102)Foreign-born:
84.9% (276)
Two or more races - Speak only English Native:
64.9% (683)Foreign-born:
19.5% (96)
Two or more races - Speak another language Native:
35.0% (368)Foreign-born:
81.1% (399)
White alone - Speak only English Native:
93.0% (7,050)Foreign-born:
15.7% (293)
White alone - Speak another language Native:
6.9% (526)Foreign-born:
85.1% (1,593)
Hispanic or Latino - Speak only English Native:
67.2% (471)Foreign-born:
7.8% (78)
Hispanic or Latino - Speak another language Native:
36.3% (254)Foreign-born:
91.9% (922)
Foreign-born residents in North Potomac 10,465 residents are foreign born (28.9% Asia , 4.9% Latin America ).
This city:
42.6%Maryland:
15.7%
Marital status for residents in North Potomac Marital status - White (Caucasian) population 15 years and over
Males 29.2% Never married63.0% Now married0.1% Separated2.1% Widowed5.6% DivorcedFemales 24.1% Never married58.3% Now married0.6% Separated6.8% Widowed10.2% DivorcedWomen who gave birth in the past 12 months Now married:
33.3% (3)Unmarried:
66.7% (5)
Women who did not give birth in the past 12 months Now married:
47.8% (970)Unmarried:
52.2% (1,059)
Marital status - Black or African American population 15 years and over
Males 45.8% Never married48.8% Now married0.0% Separated0.0% Widowed5.5% DivorcedFemales 50.9% Never married32.8% Now married0.9% Separated1.6% Widowed13.8% DivorcedWomen who gave birth in the past 12 months Now married:
7.9% (5)Unmarried:
92.1% (58)
Women who did not give birth in the past 12 months Now married:
32.5% (194)Unmarried:
67.5% (404)
Marital status - Asian population 15 years and over
Males 22.7% Never married73.8% Now married0.0% Separated0.8% Widowed2.8% DivorcedFemales 17.9% Never married70.5% Now married1.3% Separated7.5% Widowed2.8% DivorcedWomen who gave birth in the past 12 months Now married:
65.2% (75)Unmarried:
34.8% (40)
Women who did not give birth in the past 12 months Now married:
64.8% (1,435)Unmarried:
35.2% (781)
Marital status - Other race population 15 years and over
Males 33.3% Never married66.7% Now married0.0% Separated0.0% Widowed0.0% DivorcedFemales 20.5% Never married57.1% Now married0.0% Separated18.3% Widowed4.0% DivorcedWomen who did not give birth in the past 12 months Now married:
60.0% (85)Unmarried:
40.0% (56)
Marital status - Two or more races population 15 years and over
Males 62.4% Never married30.0% Now married0.0% Separated0.0% Widowed7.6% DivorcedFemales 36.3% Never married22.0% Now married0.0% Separated0.0% Widowed41.6% DivorcedWomen who did not give birth in the past 12 months Now married:
29.4% (69)Unmarried:
70.6% (167)
Marital status - White alone, not Hispanic / Latino population 15 years and over
Males 29.8% Never married63.4% Now married0.1% Separated1.5% Widowed5.1% DivorcedFemales 23.2% Never married59.1% Now married0.6% Separated6.6% Widowed10.4% DivorcedWomen who gave birth in the past 12 months Now married:
33.3% (3)Unmarried:
66.7% (6)
Women who did not give birth in the past 12 months Now married:
48.5% (950)Unmarried:
51.5% (1,010)
Marital status - Hispanic or Latino population 15 years and over
Males 21.3% Never married63.4% Now married0.0% Separated6.1% Widowed9.2% DivorcedFemales 26.4% Never married41.7% Now married0.9% Separated4.6% Widowed26.5% DivorcedWomen who did not give birth in the past 12 months Now married:
48.5% (218)Unmarried:
51.5% (232)
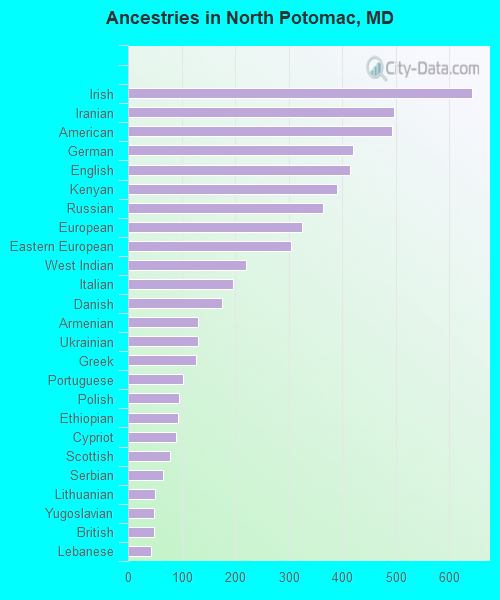
Ancestries in North Potomac
642 3.8% Irish496 3.0% Iranian493 2.9% American421 2.5% German415 2.5% English391 2.3% Kenyan365 2.2% Russian325 1.9% European304 1.8% Eastern European220 1.3% West Indian196 1.2% Italian176 1.1% Danish131 0.8% Armenian131 0.8% Ukrainian127 0.8% Greek102 0.6% Portuguese95 0.6% Polish93 0.6% Ethiopian90 0.5% Cypriot78 0.5% Scottish65 0.4% Serbian50 0.3% Lithuanian49 0.3% Yugoslavian48 0.3% British43 0.3% Lebanese37 0.2% Egyptian36 0.2% Welsh34 0.2% Brazilian30 0.2% French30 0.2% Nigerian28 0.2% Romanian25 0.1% African24 0.1% Dutch21 0.1% Finnish20 0.1% Northern European18 0.1% Scotch-Irish16 0.10% Norwegian16 0.10% Swedish11 0.07% Slovak8 0.05% Hungarian8 0.05% Czechoslovakian7 0.04% Syrian7 0.04% Icelander7 0.04% Scandinavian7 0.04% Carpatho Rusyn6 0.04% French Canadian6 0.04% Austrian5 0.03% Swiss5 0.03% Jamaican4 0.02% Latvian4 0.02% Israeli
Geographical mobility in North Potomac Same house 1 year ago 8,778 90.5% White (Caucasian)1,753 91.2% Black or African American116 98.9% American Indian / Alaska Native8,850 88.3% Asian485 92.6% Other race1,475 87.7% Two or more races8,758 91.3% White alone, not Hispanic / Latino1,474 85.3% Hispanic or LatinoMoved within same county 598 6.2% White / Caucasian92 4.8% Black or African American387 3.9% Asian61 3.6% Two or more races523 5.5% White alone, not Hispanic / Latino160 9.2% Hispanic or LatinoMoved within same state 57 0.6% White / Caucasian2 0.1% Black or African American32 0.3% Asian74 4.4% Two or more races62 0.6% White alone, not Hispanic / LatinoMoved from different state 238 2.5% White / Caucasian29 1.5% Black or African American221 2.2% Asian40 2.4% Two or more races225 2.3% White alone, not Hispanic / Latino35 2.0% Hispanic or LatinoMoved from abroad 39 0.4% White50 2.6% Black or African American706 7.0% Asian28 5.3% Other race46 0.5% White alone, not Hispanic / Latino45 2.6% Hispanic or Latino
Children Nativity (place of birth) in North Potomac
Children under 6 years - Living with two parents Both parents native 233 100.0% NativeBoth parents foreign-born 355 83.0% Native72 17.0% Foreign-bornOne native, one foreign-born parent 370 100.0% NativeChildren under 6 years - Living with one parent Native parent 56 100.0% NativeForeign-born parent 95 71.1% Native39 28.9% Foreign-bornChildren 6 to 17 years - Living with two parents Both parents native 1,168 100.0% NativeBoth parents foreign-born 1,292 79.1% Native341 20.9% Foreign-bornOne native, one foreign-born parent 604 97.0% Native19 3.0% Foreign-bornChildren 6 to 17 years - Living with one parent Native parent 258 100.0% NativeForeign-born parent 289 51.0% Native278 49.0% Foreign-born
Grandparents responsible for own grandchildren in North Potomac
Grandparents (30 to 59 years) White / Caucasian 8 36.6% Responsible for grandchildren14 63.4% Not responsible for grandchildrenBlack or African American 13 42.4% Responsible for grandchildren17 57.6% Not responsible for grandchildrenAsian 14 100.0% Not responsible for grandchildrenTwo or more races 20 100.0% Responsible for grandchildrenWhite alone, not Hispanic / Latino 8 25.5% Responsible for grandchildren24 74.5% Not responsible for grandchildrenHispanic or Latino 17 100.0% Not responsible for grandchildren
Grandparents (60 years and over) White / Caucasian 140 100.0% Not responsible for grandchildrenBlack or African American 9 100.0% Not responsible for grandchildrenAsian 9 2.6% Responsible for grandchildren351 97.4% Not responsible for grandchildrenWhite alone, not Hispanic / Latino 159 100.0% Not responsible for grandchildrenHispanic or Latino 18 100.0% Not responsible for grandchildren