Races in North Platte, Nebraska (NE) Detailed Stats
Data:
Races - White alone (%)
Races - White alone (% change since 2000)
Races - Black alone (%)
Races - Black alone (% change since 2000)
Races - American Indian alone (%)
Races - American Indian alone (% change since 2000)
Races - Asian alone (%)
Races - Asian alone (% change since 2000)
Races - Hispanic (%)
Races - Hispanic (% change since 2000)
Races - Native Hawaiian and Other Pacific Islander alone (%)
Races - Native Hawaiian and Other Pacific Islander alone (% change since 2000)
Races - Two or more races(%)
Races - Two or more races(% change since 2000)
Races - Other race alone (%)
Races - Other race alone (% change since 2000)
Racial diversity
Place of birth - Born in state of residence (%)
Place of birth - Born in state of residence (%) - White
Place of birth - Born in state of residence (%) - Black or African American
Place of birth - Born in state of residence (%) - Asian
Place of birth - Born in state of residence (%) - Hispanic or Latino
Place of birth - Born in state of residence (%) - American Indian and Alaska Native
Place of birth - Born in state of residence (%) - Multirace
Place of birth - Born in state of residence (%) - Other Race
Place of birth - Born in other state (%)
Place of birth - Born in other state (%) - White
Place of birth - Born in other state (%) - Black or African American
Place of birth - Born in other state (%) - Asian
Place of birth - Born in other state (%) - Hispanic or Latino
Place of birth - Born in other state (%) - American Indian and Alaska Native
Place of birth - Born in other state (%) - Multirace
Place of birth - Born in other state (%) - Other Race
Place of birth - Native, outside of US (%)
Place of birth - Native, outside of US (%) - White
Place of birth - Native, outside of US (%) - Black or African American
Place of birth - Native, outside of US (%) - Asian
Place of birth - Native, outside of US (%) - Hispanic or Latino
Place of birth - Native, outside of US (%) - American Indian and Alaska Native
Place of birth - Native, outside of US (%) - Multirace
Place of birth - Native, outside of US (%) - Other Race
Place of birth - Foreign born (%)
Place of birth - Foreign born (%) - White
Place of birth - Foreign born (%) - Black or African American
Place of birth - Foreign born (%) - Asian
Place of birth - Foreign born (%) - Hispanic or Latino
Place of birth - Foreign born (%) - American Indian and Alaska Native
Place of birth - Foreign born (%) - Multirace
Place of birth - Foreign born (%) - Other Race
Residents speaking English at home (%)
Residents speaking English at home - Born in the United States (%)
Residents speaking English at home - Native, born elsewhere (%)
Residents speaking English at home - Foreign born (%)
Residents speaking Spanish at home (%)
Residents speaking Spanish at home - Born in the United States (%)
Residents speaking Spanish at home - Native, born elsewhere (%)
Residents speaking Spanish at home - Foreign born (%)
Residents speaking other language at home (%)
Residents speaking other language at home - Born in the United States (%)
Residents speaking other language at home - Native, born elsewhere (%)
Residents speaking other language at home - Foreign born (%)
Marital status - Never married (%)
Marital status - Now married (%)
Marital status - Separated (%)
Marital status - Widowed (%)
Marital status - Divorced (%)
Ancestries Reported - Arab (%)
Ancestries Reported - Czech (%)
Ancestries Reported - Danish (%)
Ancestries Reported - Dutch (%)
Ancestries Reported - English (%)
Ancestries Reported - French (%)
Ancestries Reported - French Canadian (%)
Ancestries Reported - German (%)
Ancestries Reported - Greek (%)
Ancestries Reported - Hungarian (%)
Ancestries Reported - Irish (%)
Ancestries Reported - Italian (%)
Ancestries Reported - Lithuanian (%)
Ancestries Reported - Norwegian (%)
Ancestries Reported - Polish (%)
Ancestries Reported - Portuguese (%)
Ancestries Reported - Russian (%)
Ancestries Reported - Scotch-Irish (%)
Ancestries Reported - Scottish (%)
Ancestries Reported - Slovak (%)
Ancestries Reported - Subsaharan African (%)
Ancestries Reported - Swedish (%)
Ancestries Reported - Swiss (%)
Ancestries Reported - Ukrainian (%)
Ancestries Reported - United States (%)
Ancestries Reported - Welsh (%)
Ancestries Reported - West Indian (%)
Ancestries Reported - Other (%)
Geographical mobility - Same house 1 year ago (%)
Geographical mobility - Same house 1 year ago (%) - White
Geographical mobility - Same house 1 year ago (%) - Black or African American
Geographical mobility - Same house 1 year ago (%) - Asian
Geographical mobility - Same house 1 year ago (%) - Hispanic or Latino
Geographical mobility - Same house 1 year ago (%) - American Indian and Alaska Native
Geographical mobility - Same house 1 year ago (%) - Multirace
Geographical mobility - Same house 1 year ago (%) - Other Race
Geographical mobility - Moved within same county (%)
Geographical mobility - Moved within same county (%) - White
Geographical mobility - Moved within same county (%) - Black or African American
Geographical mobility - Moved within same county (%) - Asian
Geographical mobility - Moved within same county (%) - Hispanic or Latino
Geographical mobility - Moved within same county (%) - American Indian and Alaska Native
Geographical mobility - Moved within same county (%) - Multirace
Geographical mobility - Moved within same county (%) - Other Race
Geographical mobility - Moved from different county within same state (%)
Geographical mobility - Moved from different county within same state (%) - White
Geographical mobility - Moved from different county within same state (%) - Black or African American
Geographical mobility - Moved from different county within same state (%) - Asian
Geographical mobility - Moved from different county within same state (%) - Hispanic or Latino
Geographical mobility - Moved from different county within same state (%) - American Indian and Alaska Native
Geographical mobility - Moved from different county within same state (%) - Multirace
Geographical mobility - Moved from different county within same state (%) - Other Race
Geographical mobility - Moved from different state (%)
Geographical mobility - Moved from different state (%) - White
Geographical mobility - Moved from different state (%) - Black or African American
Geographical mobility - Moved from different state (%) - Asian
Geographical mobility - Moved from different state (%) - Hispanic or Latino
Geographical mobility - Moved from different state (%) - American Indian and Alaska Native
Geographical mobility - Moved from different state (%) - Multirace
Geographical mobility - Moved from different state (%) - Other Race
Geographical mobility - Moved from abroad (%)
Geographical mobility - Moved from abroad (%) - White
Geographical mobility - Moved from abroad (%) - Black or African American
Geographical mobility - Moved from abroad (%) - Asian
Geographical mobility - Moved from abroad (%) - Hispanic or Latino
Geographical mobility - Moved from abroad (%) - American Indian and Alaska Native
Geographical mobility - Moved from abroad (%) - Multirace
Geographical mobility - Moved from abroad (%) - Other Race
Place of birth for the foreign-born population - Ireland (%)
Place of birth for the foreign-born population - Denmark (%)
Place of birth for the foreign-born population - Norway (%)
Place of birth for the foreign-born population - Sweden (%)
Place of birth for the foreign-born population - United Kingdom (%)
Place of birth for the foreign-born population - England (%)
Place of birth for the foreign-born population - Scotland (%)
Place of birth for the foreign-born population - Other Northern Europe (%)
Place of birth for the foreign-born population - Austria (%)
Place of birth for the foreign-born population - Belgium (%)
Place of birth for the foreign-born population - France (%)
Place of birth for the foreign-born population - Germany (%)
Place of birth for the foreign-born population - Netherlands (%)
Place of birth for the foreign-born population - Switzerland (%)
Place of birth for the foreign-born population - Other Western Europe (%)
Place of birth for the foreign-born population - Greece (%)
Place of birth for the foreign-born population - Italy (%)
Place of birth for the foreign-born population - Portugal (%)
Place of birth for the foreign-born population - Spain (%)
Place of birth for the foreign-born population - Other Southern Europe (%)
Place of birth for the foreign-born population - Albania (%)
Place of birth for the foreign-born population - Belarus (%)
Place of birth for the foreign-born population - Bosnia and Herzegovina (%)
Place of birth for the foreign-born population - Bulgaria (%)
Place of birth for the foreign-born population - Croatia (%)
Place of birth for the foreign-born population - Czechoslovakia (%)
Place of birth for the foreign-born population - Hungary (%)
Place of birth for the foreign-born population - Latvia (%)
Place of birth for the foreign-born population - Lithuania (%)
Place of birth for the foreign-born population - North Macedonia (Macedonia) (%)
Place of birth for the foreign-born population - Moldova (%)
Place of birth for the foreign-born population - Poland (%)
Place of birth for the foreign-born population - Romania (%)
Place of birth for the foreign-born population - Russia (%)
Place of birth for the foreign-born population - Serbia (%)
Place of birth for the foreign-born population - Ukraine (%)
Place of birth for the foreign-born population - Other Eastern Europe (%)
Place of birth for the foreign-born population - China (%)
Place of birth for the foreign-born population - Hong Kong (%)
Place of birth for the foreign-born population - Taiwan (%)
Place of birth for the foreign-born population - Japan (%)
Place of birth for the foreign-born population - Korea (%)
Place of birth for the foreign-born population - Other Eastern Asia (%)
Place of birth for the foreign-born population - Afghanistan (%)
Place of birth for the foreign-born population - Bangladesh (%)
Place of birth for the foreign-born population - India (%)
Place of birth for the foreign-born population - Iran (%)
Place of birth for the foreign-born population - Kazakhstan (%)
Place of birth for the foreign-born population - Nepal (%)
Place of birth for the foreign-born population - Pakistan (%)
Place of birth for the foreign-born population - Sri Lanka (%)
Place of birth for the foreign-born population - Uzbekistan (%)
Place of birth for the foreign-born population - Other South Central Asia (%)
Place of birth for the foreign-born population - Burma (%)
Place of birth for the foreign-born population - Cambodia (%)
Place of birth for the foreign-born population - Indonesia (%)
Place of birth for the foreign-born population - Laos (%)
Place of birth for the foreign-born population - Malaysia (%)
Place of birth for the foreign-born population - Philippines (%)
Place of birth for the foreign-born population - Singapore (%)
Place of birth for the foreign-born population - Thailand (%)
Place of birth for the foreign-born population - Vietnam (%)
Place of birth for the foreign-born population - Other South Eastern Asia (%)
Place of birth for the foreign-born population - Armenia (%)
Place of birth for the foreign-born population - Iraq (%)
Place of birth for the foreign-born population - Israel (%)
Place of birth for the foreign-born population - Jordan (%)
Place of birth for the foreign-born population - Kuwait (%)
Place of birth for the foreign-born population - Lebanon (%)
Place of birth for the foreign-born population - Saudi Arabia (%)
Place of birth for the foreign-born population - Syria (%)
Place of birth for the foreign-born population - Turkey (%)
Place of birth for the foreign-born population - Yemen (%)
Place of birth for the foreign-born population - Other Western Asia (%)
Place of birth for the foreign-born population - Eritrea (%)
Place of birth for the foreign-born population - Ethiopia (%)
Place of birth for the foreign-born population - Kenya (%)
Place of birth for the foreign-born population - Somalia (%)
Place of birth for the foreign-born population - Uganda (%)
Place of birth for the foreign-born population - Zimbabwe (%)
Place of birth for the foreign-born population - Other Eastern Africa (%)
Place of birth for the foreign-born population - Cameroon (%)
Place of birth for the foreign-born population - Congo (%)
Place of birth for the foreign-born population - Democratic Republic of Congo (Zaire) (%)
Place of birth for the foreign-born population - Other Middle Africa (%)
Place of birth for the foreign-born population - Egypt (%)
Place of birth for the foreign-born population - Morocco (%)
Place of birth for the foreign-born population - Sudan (%)
Place of birth for the foreign-born population - Other Northern Africa (%)
Place of birth for the foreign-born population - South Africa (%)
Place of birth for the foreign-born population - Other Southern Africa (%)
Place of birth for the foreign-born population - Cabo Verde (%)
Place of birth for the foreign-born population - Ghana (%)
Place of birth for the foreign-born population - Liberia (%)
Place of birth for the foreign-born population - Nigeria (%)
Place of birth for the foreign-born population - Senegal (%)
Place of birth for the foreign-born population - Sierra Leone (%)
Place of birth for the foreign-born population - Other Western Africa (%)
Place of birth for the foreign-born population - Australia (%)
Place of birth for the foreign-born population - New Zealand (%)
Place of birth for the foreign-born population - Fiji (%)
Place of birth for the foreign-born population - Micronesia (%)
Place of birth for the foreign-born population - Bahamas (%)
Place of birth for the foreign-born population - Barbados (%)
Place of birth for the foreign-born population - Cuba (%)
Place of birth for the foreign-born population - Dominica (%)
Place of birth for the foreign-born population - Dominican Republic (%)
Place of birth for the foreign-born population - Grenada (%)
Place of birth for the foreign-born population - Haiti (%)
Place of birth for the foreign-born population - Jamaica (%)
Place of birth for the foreign-born population - St. Vincent and the Grenadines (%)
Place of birth for the foreign-born population - Trinidad and Tobago (%)
Place of birth for the foreign-born population - West Indies (%)
Place of birth for the foreign-born population - Other Caribbean (%)
Place of birth for the foreign-born population - Belize (%)
Place of birth for the foreign-born population - Costa Rica (%)
Place of birth for the foreign-born population - El Salvador (%)
Place of birth for the foreign-born population - Guatemala (%)
Place of birth for the foreign-born population - Honduras (%)
Place of birth for the foreign-born population - Mexico (%)
Place of birth for the foreign-born population - Nicaragua (%)
Place of birth for the foreign-born population - Panama (%)
Place of birth for the foreign-born population - Other Central America (%)
Place of birth for the foreign-born population - Argentina (%)
Place of birth for the foreign-born population - Bolivia (%)
Place of birth for the foreign-born population - Brazil (%)
Place of birth for the foreign-born population - Chile (%)
Place of birth for the foreign-born population - Colombia (%)
Place of birth for the foreign-born population - Ecuador (%)
Place of birth for the foreign-born population - Guyana (%)
Place of birth for the foreign-born population - Peru (%)
Place of birth for the foreign-born population - Uruguay (%)
Place of birth for the foreign-born population - Venezuela (%)
Place of birth for the foreign-born population - Other South America (%)
Place of birth for the foreign-born population - Canada (%)
Place of birth for the foreign-born population - Other Northern America (%)
Place of birth for the foreign-born population - Other (%)
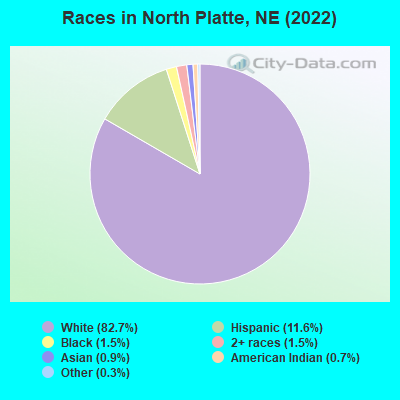
According to 2022 data, the most numerous races in North Platte, NE are White alone (19,365 residents), Hispanic (2,727 residents), and Black alone (349 residents). 94.4% of North Platte residents speak English at home. 3.1% of North Platte, NE residents are foreign-born (1.8% born in Latin America, 0.9% born in Asia), which is 126.1% less than the foreign-born rate of 7.0% across the entire state of Nebraska.
Race distribution in North Platte
2000 2022
1,494,494 87.3% White alone 94,425 5.5% Hispanic 67,537 3.9% Black alone 21,677 1.3% Asian alone 17,696 1.0% Two or more races 13,460 0.8% American Indian alone 1,327 0.08% Other race alone 647 0.04% Native Hawaiian and Other
1,492,005 75.8% White alone 241,898 12.3% Hispanic 89,520 4.5% Black alone 76,499 3.9% Two or more races 49,261 2.5% Asian alone 10,249 0.5% American Indian alone 7,425 0.4% Other race alone 1,066 0.05% Native Hawaiian and Other
Income and house value in North Platte Median household income in 2022 $55,985 White non-Hispanic householders$77,929 Black householders$29,619 American Indian and Alaska Native householders$84,894 Some other race householders$39,412 Two or more races householders$40,572 Hispanic or Latino race householdersMedian 2022 house value $180,451 White Non-Hispanic householders$64,582 Black or African American householders $603,561 Asian householders$151,958 Some other race householders$156,945 Hispanic or Latino householders
Median age by race in North Platte
43.8 Median age for White residents42.0 44.6 35.9 Median age for Black or African American residents50.0 26.8 30.6 Median age for American Indian / Alaska Native residents17.5 33.0 39.2 Median age for Asian residents42.0 38.5 32.1 Median age for Native Hawaiian / Pacific Islander residents-672,108,842.9 -689,223,057.0 23.8 Median age for Other race residents26.3 19.0 20.6 Median age for Two or more races residents24.6 18.2 43.0 Median age for White alone residents42.0 43.7 27.7 Median age for Hispanic or Latino residents26.1 30.6
Owner/renter occupied households by race in North Platte
House owners and renters - White residents 5,641 61.0% Owner occupied3,608 39.0% Renter occupiedHouse owners and renters - Black or African American residents 73 64.9% Owner occupied39 35.1% Renter occupiedHouse owners and renters - American Indian / Alaska Native residents 152 58.8% Owner occupied106 41.2% Renter occupiedHouse owners and renters - Asian residents 7 39.5% Owner occupied10 60.5% Renter occupiedHouse owners and renters - Other race residents 102 40.7% Owner occupied148 59.3% Renter occupiedHouse owners and renters - Two or more races residents 178 39.5% Owner occupied272 60.5% Renter occupiedHouse owners and renters - White alone residents 5,508 60.9% Owner occupied3,531 39.1% Renter occupiedHouse owners and renters - Hispanic or Latino residents 396 42.8% Owner occupied529 57.2% Renter occupied
Language usage in North Platte
English speakers - Total 94.4% of residents of North Platte speak English at home.
4.4% of residents speak Spanish at home 709 72.3% Speak English very well271 27.7% Speak English less than very well1.3% of residents speak other language at home 130 46.9% Speak English very well147 53.1% Speak English less than very well
English speakers - Born in the United States 93.4% of residents of North Platte speak English at home.
5.1% of residents speak Spanish at home 267 91.4% Speak English very well25 8.6% Speak English less than very well1.3% of residents speak other language at home 41 56.2% Speak English very well32 43.8% Speak English less than very well
English speakers - Native, born elsewhere 98.2% of residents of North Platte speak English at home.
2.8% of residents speak Spanish at home 3 100.0% Speak English very well
English speakers - Foreign-born 19.8% of residents of North Platte speak English at home.
53.3% of residents speak Spanish at home 251 68.2% Speak English very well117 31.8% Speak English less than very well25.6% of residents speak other language at home 76 42.9% Speak English very well101 57.1% Speak English less than very well
White (Caucasian) - Speak only English Native:
99.3% (18,431)Foreign-born:
22.3% (42)
White (Caucasian) - Speak another language Native:
1.1% (210)Foreign-born:
76.7% (144)
Black or African American - Speak only English Native:
98.4% (349)Foreign-born:
100.0% (6)
Asian - Speak only English Native:
100.0% (108)Foreign-born:
32.9% (39)
Asian - Speak another language Native:
4.9% (5)Foreign-born:
65.3% (78)
Other race - Speak only English Native:
82.5% (738)Foreign-born:
45.5% (50)
Other race - Speak another language Native:
26.7% (239)Foreign-born:
42.7% (47)
Two or more races - Speak another language Native:
34.1% (317)Foreign-born:
100.0% (238)
White alone - Speak only English Native:
98.7% (17,960)Foreign-born:
35.2% (46)
White alone - Speak another language Native:
1.3% (242)Foreign-born:
64.2% (83)
Hispanic or Latino - Speak only English Native:
84.0% (1,783)Foreign-born:
10.1% (42)
Hispanic or Latino - Speak another language Native:
22.2% (471)Foreign-born:
88.8% (372)
Foreign-born residents in North Platte 725 residents are foreign born (1.8% Latin America , 0.9% Asia ).
This city:
3.1%Nebraska:
7.5%
Marital status for residents in North Platte Marital status - White (Caucasian) population 15 years and over
Males 29.6% Never married50.1% Now married1.8% Separated3.2% Widowed15.3% DivorcedFemales 22.3% Never married48.3% Now married0.5% Separated12.3% Widowed16.7% DivorcedWomen who gave birth in the past 12 months Now married:
47.8% (118)Unmarried:
52.2% (128)
Women who did not give birth in the past 12 months Now married:
46.1% (1,868)Unmarried:
53.9% (2,181)
Marital status - Black or African American population 15 years and over
Males 15.9% Never married84.1% Now married0.0% Separated0.0% Widowed0.0% DivorcedFemales 61.5% Never married33.3% Now married0.0% Separated0.0% Widowed5.1% DivorcedWomen who did not give birth in the past 12 months Now married:
30.7% (45)Unmarried:
69.3% (101)
Marital status - American Indian / Alaska Native population 15 years and over
Males 52.1% Never married24.8% Now married20.5% Separated2.6% Widowed0.0% DivorcedFemales 74.8% Never married0.0% Now married8.7% Separated0.0% Widowed16.5% DivorcedWomen who gave birth in the past 12 months Now married:
0.0% (0)Unmarried:
100.0% (47)
Women who did not give birth in the past 12 months Now married:
0.0% (0)Unmarried:
100.0% (49)
Marital status - Asian population 15 years and over
Males 0.0% Never married100.0% Now married0.0% Separated0.0% Widowed0.0% DivorcedFemales 19.5% Never married61.5% Now married0.0% Separated19.0% Widowed0.0% DivorcedWomen who did not give birth in the past 12 months Now married:
64.2% (63)Unmarried:
35.8% (35)
Marital status - Native Hawaiian / Pacific Islander population 15 years and over
Males 100.0% Never married0.0% Now married0.0% Separated0.0% Widowed0.0% DivorcedFemales 100.0% Never married0.0% Now married0.0% Separated0.0% Widowed0.0% DivorcedWomen who did not give birth in the past 12 months Now married:
0.0% (0)Unmarried:
100.0% (4)
Marital status - Other race population 15 years and over
Males 66.2% Never married24.3% Now married0.0% Separated0.0% Widowed9.4% DivorcedFemales 31.5% Never married49.5% Now married10.9% Separated0.0% Widowed8.2% DivorcedWomen who did not give birth in the past 12 months Now married:
42.6% (59)Unmarried:
57.4% (80)
Marital status - Two or more races population 15 years and over
Males 30.1% Never married39.3% Now married26.8% Separated2.7% Widowed1.2% DivorcedFemales 74.6% Never married8.8% Now married0.0% Separated15.2% Widowed1.4% DivorcedWomen who did not give birth in the past 12 months Now married:
8.2% (27)Unmarried:
91.8% (306)
Marital status - White alone, not Hispanic / Latino population 15 years and over
Males 29.5% Never married50.4% Now married1.4% Separated3.2% Widowed15.6% DivorcedFemales 22.7% Never married47.4% Now married0.5% Separated12.9% Widowed16.6% DivorcedWomen who gave birth in the past 12 months Now married:
47.8% (121)Unmarried:
52.2% (132)
Women who did not give birth in the past 12 months Now married:
45.9% (1,805)Unmarried:
54.1% (2,129)
Marital status - Hispanic or Latino population 15 years and over
Males 39.8% Never married39.2% Now married12.1% Separated2.2% Widowed6.8% DivorcedFemales 39.5% Never married40.8% Now married2.3% Separated4.9% Widowed12.4% DivorcedWomen who gave birth in the past 12 months Now married:
0.0% (0)Unmarried:
100.0% (9)
Women who did not give birth in the past 12 months Now married:
29.9% (186)Unmarried:
70.1% (436)
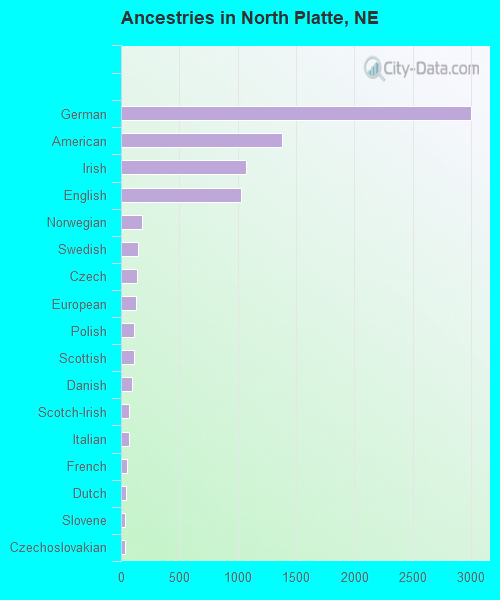
Ancestries in North Platte
3,005 28.8% German1,377 13.2% American1,076 10.3% Irish1,031 9.9% English181 1.7% Norwegian150 1.4% Swedish136 1.3% Czech127 1.2% European113 1.1% Polish110 1.1% Scottish97 0.9% Danish68 0.7% Scotch-Irish66 0.6% Italian51 0.5% French44 0.4% Dutch34 0.3% Slovene31 0.3% Czechoslovakian19 0.2% Greek16 0.2% Arab11 0.1% Eastern European9 0.09% Pennsylvania German5 0.05% Scandinavian1 0.01% Russian
Geographical mobility in North Platte Same house 1 year ago 16,196 83.0% White (Caucasian)361 95.6% Black or African American384 93.1% American Indian / Alaska Native191 87.3% Asian15 100.0% Native Hawaiian / Pacific Islander881 87.0% Other race1,060 75.2% Two or more races15,925 82.9% White alone, not Hispanic / Latino2,195 82.1% Hispanic or LatinoMoved within same county 1,855 9.5% White / Caucasian3 0.9% Black or African American16 3.8% American Indian / Alaska Native7 3.1% Asian89 8.8% Other race89 6.3% Two or more races1,840 9.6% White alone, not Hispanic / Latino197 7.4% Hispanic or LatinoMoved within same state 692 3.5% White / Caucasian19 5.1% Black or African American8 2.1% American Indian / Alaska Native27 2.7% Other race187 13.2% Two or more races668 3.5% White alone, not Hispanic / Latino206 7.7% Hispanic or LatinoMoved from different state 590 3.0% White / Caucasian3 0.7% Black or African American8 1.9% American Indian / Alaska Native18 8.3% Asian11 1.0% Other race19 1.4% Two or more races596 3.1% White alone, not Hispanic / Latino23 0.9% Hispanic or LatinoMoved from abroad 35 0.2% White10 2.6% Black or African American41 0.2% White alone, not Hispanic / Latino
Children Nativity (place of birth) in North Platte
Children under 6 years - Living with two parents Both parents native 1,190 100.0% NativeOne native, one foreign-born parent 5 100.0% NativeChildren under 6 years - Living with one parent Native parent 544 100.0% NativeChildren 6 to 17 years - Living with two parents Both parents native 1,889 99.6% Native7 0.4% Foreign-bornBoth parents foreign-born 13 100.0% NativeOne native, one foreign-born parent 200 100.0% NativeChildren 6 to 17 years - Living with one parent Native parent 1,089 96.8% Native36 3.2% Foreign-bornForeign-born parent 55 89.3% Native7 10.7% Foreign-born
Grandparents responsible for own grandchildren in North Platte
Grandparents (30 to 59 years) White / Caucasian 71 34.3% Responsible for grandchildren136 65.7% Not responsible for grandchildrenAsian 38 100.0% Not responsible for grandchildrenOther race 8 100.0% Not responsible for grandchildrenWhite alone, not Hispanic / Latino 71 47.2% Responsible for grandchildren79 52.8% Not responsible for grandchildrenHispanic or Latino 6 100.0% Not responsible for grandchildrenGrandparents (60 years and over) White / Caucasian 113 82.4% Responsible for grandchildren24 17.6% Not responsible for grandchildrenOther race 11 100.0% Not responsible for grandchildrenWhite alone, not Hispanic / Latino 113 81.8% Responsible for grandchildren25 18.2% Not responsible for grandchildrenHispanic or Latino 17 100.0% Not responsible for grandchildren