Races in North Plainfield, New Jersey (NJ) Detailed Stats
Data:
Races - White alone (%)
Races - White alone (% change since 2000)
Races - Black alone (%)
Races - Black alone (% change since 2000)
Races - American Indian alone (%)
Races - American Indian alone (% change since 2000)
Races - Asian alone (%)
Races - Asian alone (% change since 2000)
Races - Hispanic (%)
Races - Hispanic (% change since 2000)
Races - Native Hawaiian and Other Pacific Islander alone (%)
Races - Native Hawaiian and Other Pacific Islander alone (% change since 2000)
Races - Two or more races(%)
Races - Two or more races(% change since 2000)
Races - Other race alone (%)
Races - Other race alone (% change since 2000)
Racial diversity
Place of birth - Born in state of residence (%)
Place of birth - Born in state of residence (%) - White
Place of birth - Born in state of residence (%) - Black or African American
Place of birth - Born in state of residence (%) - Asian
Place of birth - Born in state of residence (%) - Hispanic or Latino
Place of birth - Born in state of residence (%) - American Indian and Alaska Native
Place of birth - Born in state of residence (%) - Multirace
Place of birth - Born in state of residence (%) - Other Race
Place of birth - Born in other state (%)
Place of birth - Born in other state (%) - White
Place of birth - Born in other state (%) - Black or African American
Place of birth - Born in other state (%) - Asian
Place of birth - Born in other state (%) - Hispanic or Latino
Place of birth - Born in other state (%) - American Indian and Alaska Native
Place of birth - Born in other state (%) - Multirace
Place of birth - Born in other state (%) - Other Race
Place of birth - Native, outside of US (%)
Place of birth - Native, outside of US (%) - White
Place of birth - Native, outside of US (%) - Black or African American
Place of birth - Native, outside of US (%) - Asian
Place of birth - Native, outside of US (%) - Hispanic or Latino
Place of birth - Native, outside of US (%) - American Indian and Alaska Native
Place of birth - Native, outside of US (%) - Multirace
Place of birth - Native, outside of US (%) - Other Race
Place of birth - Foreign born (%)
Place of birth - Foreign born (%) - White
Place of birth - Foreign born (%) - Black or African American
Place of birth - Foreign born (%) - Asian
Place of birth - Foreign born (%) - Hispanic or Latino
Place of birth - Foreign born (%) - American Indian and Alaska Native
Place of birth - Foreign born (%) - Multirace
Place of birth - Foreign born (%) - Other Race
Residents speaking English at home (%)
Residents speaking English at home - Born in the United States (%)
Residents speaking English at home - Native, born elsewhere (%)
Residents speaking English at home - Foreign born (%)
Residents speaking Spanish at home (%)
Residents speaking Spanish at home - Born in the United States (%)
Residents speaking Spanish at home - Native, born elsewhere (%)
Residents speaking Spanish at home - Foreign born (%)
Residents speaking other language at home (%)
Residents speaking other language at home - Born in the United States (%)
Residents speaking other language at home - Native, born elsewhere (%)
Residents speaking other language at home - Foreign born (%)
Marital status - Never married (%)
Marital status - Now married (%)
Marital status - Separated (%)
Marital status - Widowed (%)
Marital status - Divorced (%)
Ancestries Reported - Arab (%)
Ancestries Reported - Czech (%)
Ancestries Reported - Danish (%)
Ancestries Reported - Dutch (%)
Ancestries Reported - English (%)
Ancestries Reported - French (%)
Ancestries Reported - French Canadian (%)
Ancestries Reported - German (%)
Ancestries Reported - Greek (%)
Ancestries Reported - Hungarian (%)
Ancestries Reported - Irish (%)
Ancestries Reported - Italian (%)
Ancestries Reported - Lithuanian (%)
Ancestries Reported - Norwegian (%)
Ancestries Reported - Polish (%)
Ancestries Reported - Portuguese (%)
Ancestries Reported - Russian (%)
Ancestries Reported - Scotch-Irish (%)
Ancestries Reported - Scottish (%)
Ancestries Reported - Slovak (%)
Ancestries Reported - Subsaharan African (%)
Ancestries Reported - Swedish (%)
Ancestries Reported - Swiss (%)
Ancestries Reported - Ukrainian (%)
Ancestries Reported - United States (%)
Ancestries Reported - Welsh (%)
Ancestries Reported - West Indian (%)
Ancestries Reported - Other (%)
Geographical mobility - Same house 1 year ago (%)
Geographical mobility - Same house 1 year ago (%) - White
Geographical mobility - Same house 1 year ago (%) - Black or African American
Geographical mobility - Same house 1 year ago (%) - Asian
Geographical mobility - Same house 1 year ago (%) - Hispanic or Latino
Geographical mobility - Same house 1 year ago (%) - American Indian and Alaska Native
Geographical mobility - Same house 1 year ago (%) - Multirace
Geographical mobility - Same house 1 year ago (%) - Other Race
Geographical mobility - Moved within same county (%)
Geographical mobility - Moved within same county (%) - White
Geographical mobility - Moved within same county (%) - Black or African American
Geographical mobility - Moved within same county (%) - Asian
Geographical mobility - Moved within same county (%) - Hispanic or Latino
Geographical mobility - Moved within same county (%) - American Indian and Alaska Native
Geographical mobility - Moved within same county (%) - Multirace
Geographical mobility - Moved within same county (%) - Other Race
Geographical mobility - Moved from different county within same state (%)
Geographical mobility - Moved from different county within same state (%) - White
Geographical mobility - Moved from different county within same state (%) - Black or African American
Geographical mobility - Moved from different county within same state (%) - Asian
Geographical mobility - Moved from different county within same state (%) - Hispanic or Latino
Geographical mobility - Moved from different county within same state (%) - American Indian and Alaska Native
Geographical mobility - Moved from different county within same state (%) - Multirace
Geographical mobility - Moved from different county within same state (%) - Other Race
Geographical mobility - Moved from different state (%)
Geographical mobility - Moved from different state (%) - White
Geographical mobility - Moved from different state (%) - Black or African American
Geographical mobility - Moved from different state (%) - Asian
Geographical mobility - Moved from different state (%) - Hispanic or Latino
Geographical mobility - Moved from different state (%) - American Indian and Alaska Native
Geographical mobility - Moved from different state (%) - Multirace
Geographical mobility - Moved from different state (%) - Other Race
Geographical mobility - Moved from abroad (%)
Geographical mobility - Moved from abroad (%) - White
Geographical mobility - Moved from abroad (%) - Black or African American
Geographical mobility - Moved from abroad (%) - Asian
Geographical mobility - Moved from abroad (%) - Hispanic or Latino
Geographical mobility - Moved from abroad (%) - American Indian and Alaska Native
Geographical mobility - Moved from abroad (%) - Multirace
Geographical mobility - Moved from abroad (%) - Other Race
Place of birth for the foreign-born population - Ireland (%)
Place of birth for the foreign-born population - Denmark (%)
Place of birth for the foreign-born population - Norway (%)
Place of birth for the foreign-born population - Sweden (%)
Place of birth for the foreign-born population - United Kingdom (%)
Place of birth for the foreign-born population - England (%)
Place of birth for the foreign-born population - Scotland (%)
Place of birth for the foreign-born population - Other Northern Europe (%)
Place of birth for the foreign-born population - Austria (%)
Place of birth for the foreign-born population - Belgium (%)
Place of birth for the foreign-born population - France (%)
Place of birth for the foreign-born population - Germany (%)
Place of birth for the foreign-born population - Netherlands (%)
Place of birth for the foreign-born population - Switzerland (%)
Place of birth for the foreign-born population - Other Western Europe (%)
Place of birth for the foreign-born population - Greece (%)
Place of birth for the foreign-born population - Italy (%)
Place of birth for the foreign-born population - Portugal (%)
Place of birth for the foreign-born population - Spain (%)
Place of birth for the foreign-born population - Other Southern Europe (%)
Place of birth for the foreign-born population - Albania (%)
Place of birth for the foreign-born population - Belarus (%)
Place of birth for the foreign-born population - Bosnia and Herzegovina (%)
Place of birth for the foreign-born population - Bulgaria (%)
Place of birth for the foreign-born population - Croatia (%)
Place of birth for the foreign-born population - Czechoslovakia (%)
Place of birth for the foreign-born population - Hungary (%)
Place of birth for the foreign-born population - Latvia (%)
Place of birth for the foreign-born population - Lithuania (%)
Place of birth for the foreign-born population - North Macedonia (Macedonia) (%)
Place of birth for the foreign-born population - Moldova (%)
Place of birth for the foreign-born population - Poland (%)
Place of birth for the foreign-born population - Romania (%)
Place of birth for the foreign-born population - Russia (%)
Place of birth for the foreign-born population - Serbia (%)
Place of birth for the foreign-born population - Ukraine (%)
Place of birth for the foreign-born population - Other Eastern Europe (%)
Place of birth for the foreign-born population - China (%)
Place of birth for the foreign-born population - Hong Kong (%)
Place of birth for the foreign-born population - Taiwan (%)
Place of birth for the foreign-born population - Japan (%)
Place of birth for the foreign-born population - Korea (%)
Place of birth for the foreign-born population - Other Eastern Asia (%)
Place of birth for the foreign-born population - Afghanistan (%)
Place of birth for the foreign-born population - Bangladesh (%)
Place of birth for the foreign-born population - India (%)
Place of birth for the foreign-born population - Iran (%)
Place of birth for the foreign-born population - Kazakhstan (%)
Place of birth for the foreign-born population - Nepal (%)
Place of birth for the foreign-born population - Pakistan (%)
Place of birth for the foreign-born population - Sri Lanka (%)
Place of birth for the foreign-born population - Uzbekistan (%)
Place of birth for the foreign-born population - Other South Central Asia (%)
Place of birth for the foreign-born population - Burma (%)
Place of birth for the foreign-born population - Cambodia (%)
Place of birth for the foreign-born population - Indonesia (%)
Place of birth for the foreign-born population - Laos (%)
Place of birth for the foreign-born population - Malaysia (%)
Place of birth for the foreign-born population - Philippines (%)
Place of birth for the foreign-born population - Singapore (%)
Place of birth for the foreign-born population - Thailand (%)
Place of birth for the foreign-born population - Vietnam (%)
Place of birth for the foreign-born population - Other South Eastern Asia (%)
Place of birth for the foreign-born population - Armenia (%)
Place of birth for the foreign-born population - Iraq (%)
Place of birth for the foreign-born population - Israel (%)
Place of birth for the foreign-born population - Jordan (%)
Place of birth for the foreign-born population - Kuwait (%)
Place of birth for the foreign-born population - Lebanon (%)
Place of birth for the foreign-born population - Saudi Arabia (%)
Place of birth for the foreign-born population - Syria (%)
Place of birth for the foreign-born population - Turkey (%)
Place of birth for the foreign-born population - Yemen (%)
Place of birth for the foreign-born population - Other Western Asia (%)
Place of birth for the foreign-born population - Eritrea (%)
Place of birth for the foreign-born population - Ethiopia (%)
Place of birth for the foreign-born population - Kenya (%)
Place of birth for the foreign-born population - Somalia (%)
Place of birth for the foreign-born population - Uganda (%)
Place of birth for the foreign-born population - Zimbabwe (%)
Place of birth for the foreign-born population - Other Eastern Africa (%)
Place of birth for the foreign-born population - Cameroon (%)
Place of birth for the foreign-born population - Congo (%)
Place of birth for the foreign-born population - Democratic Republic of Congo (Zaire) (%)
Place of birth for the foreign-born population - Other Middle Africa (%)
Place of birth for the foreign-born population - Egypt (%)
Place of birth for the foreign-born population - Morocco (%)
Place of birth for the foreign-born population - Sudan (%)
Place of birth for the foreign-born population - Other Northern Africa (%)
Place of birth for the foreign-born population - South Africa (%)
Place of birth for the foreign-born population - Other Southern Africa (%)
Place of birth for the foreign-born population - Cabo Verde (%)
Place of birth for the foreign-born population - Ghana (%)
Place of birth for the foreign-born population - Liberia (%)
Place of birth for the foreign-born population - Nigeria (%)
Place of birth for the foreign-born population - Senegal (%)
Place of birth for the foreign-born population - Sierra Leone (%)
Place of birth for the foreign-born population - Other Western Africa (%)
Place of birth for the foreign-born population - Australia (%)
Place of birth for the foreign-born population - New Zealand (%)
Place of birth for the foreign-born population - Fiji (%)
Place of birth for the foreign-born population - Micronesia (%)
Place of birth for the foreign-born population - Bahamas (%)
Place of birth for the foreign-born population - Barbados (%)
Place of birth for the foreign-born population - Cuba (%)
Place of birth for the foreign-born population - Dominica (%)
Place of birth for the foreign-born population - Dominican Republic (%)
Place of birth for the foreign-born population - Grenada (%)
Place of birth for the foreign-born population - Haiti (%)
Place of birth for the foreign-born population - Jamaica (%)
Place of birth for the foreign-born population - St. Vincent and the Grenadines (%)
Place of birth for the foreign-born population - Trinidad and Tobago (%)
Place of birth for the foreign-born population - West Indies (%)
Place of birth for the foreign-born population - Other Caribbean (%)
Place of birth for the foreign-born population - Belize (%)
Place of birth for the foreign-born population - Costa Rica (%)
Place of birth for the foreign-born population - El Salvador (%)
Place of birth for the foreign-born population - Guatemala (%)
Place of birth for the foreign-born population - Honduras (%)
Place of birth for the foreign-born population - Mexico (%)
Place of birth for the foreign-born population - Nicaragua (%)
Place of birth for the foreign-born population - Panama (%)
Place of birth for the foreign-born population - Other Central America (%)
Place of birth for the foreign-born population - Argentina (%)
Place of birth for the foreign-born population - Bolivia (%)
Place of birth for the foreign-born population - Brazil (%)
Place of birth for the foreign-born population - Chile (%)
Place of birth for the foreign-born population - Colombia (%)
Place of birth for the foreign-born population - Ecuador (%)
Place of birth for the foreign-born population - Guyana (%)
Place of birth for the foreign-born population - Peru (%)
Place of birth for the foreign-born population - Uruguay (%)
Place of birth for the foreign-born population - Venezuela (%)
Place of birth for the foreign-born population - Other South America (%)
Place of birth for the foreign-born population - Canada (%)
Place of birth for the foreign-born population - Other Northern America (%)
Place of birth for the foreign-born population - Other (%)
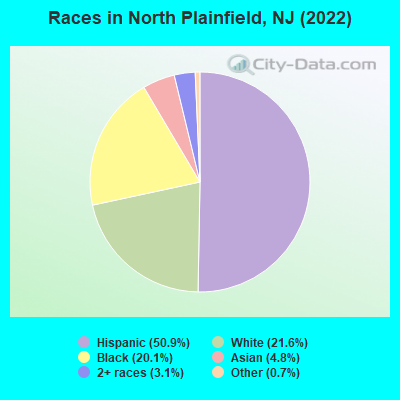
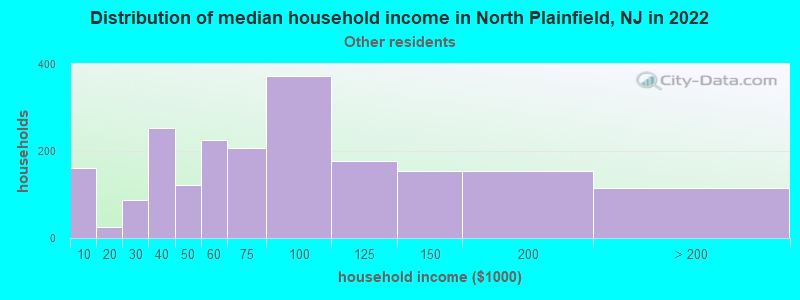
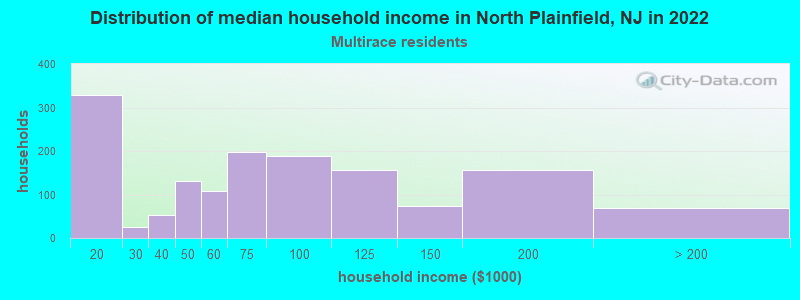
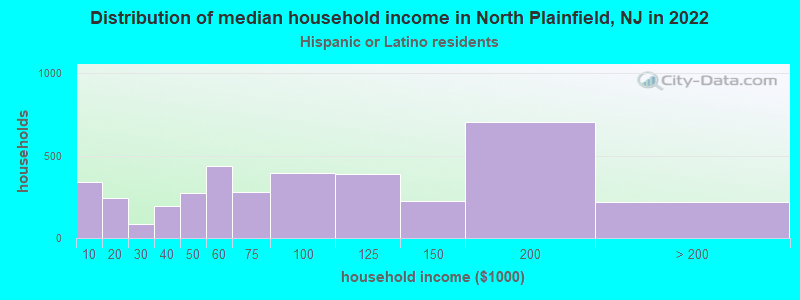
According to 2022 data, the most numerous races in North Plainfield, NJ are White alone (4,930 residents), Hispanic (11,620 residents), and Black alone (4,592 residents). 44.9% of North Plainfield residents speak English at home. 40.9% of North Plainfield, NJ residents are foreign-born (33.2% born in Latin America), which is 43.8% greater than the foreign-born rate of 23.0% across the entire state of New Jersey.
Race distribution in North Plainfield
2000 2022
5,557,209 66.0% White alone 1,117,191 13.3% Hispanic 1,096,171 13.0% Black alone 477,012 5.7% Asian alone 133,689 1.6% Two or more races 19,565 0.2% Other race alone 11,338 0.1% American Indian alone 2,175 0.03% Native Hawaiian and Other
4,766,476 51.5% White alone 2,028,470 21.9% Hispanic 1,111,632 12.0% Black alone 923,546 10.0% Asian alone 332,237 3.6% Two or more races 89,847 1.0% Other race alone 8,557 0.09% American Indian alone 934 0.01% Native Hawaiian and Other
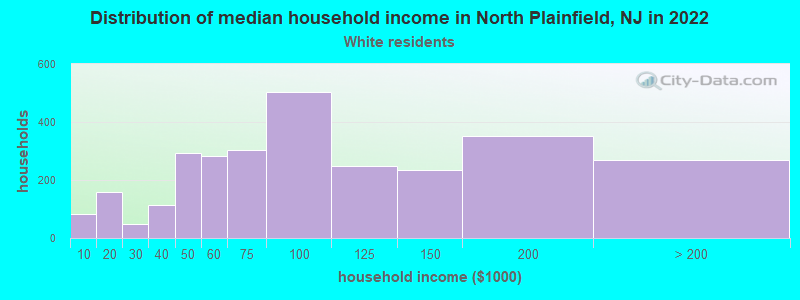
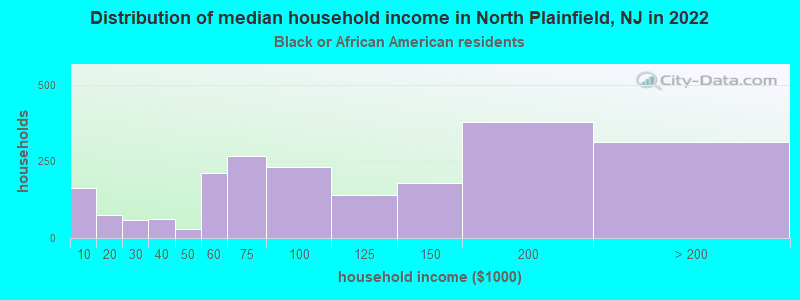
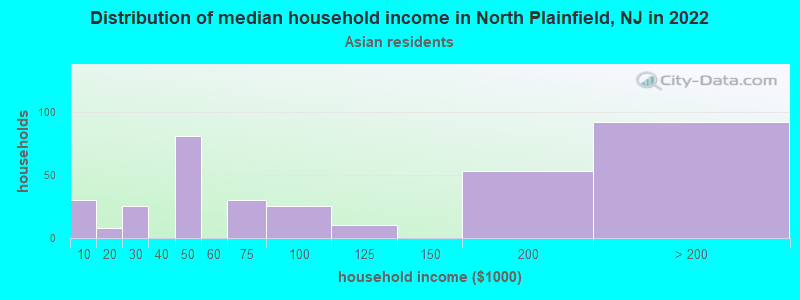
Income and house value in North Plainfield Median household income in 2022 $80,737 White non-Hispanic householders$110,820 Black householders$74,946 Asian householders$83,882 Some other race householders$77,798 Two or more races householders$88,314 Hispanic or Latino race householdersMedian 2022 house value $335,527 White Non-Hispanic householders$354,442 Black or African American householders $349,263 Asian householders$422,224 Native Hawaiian and other Pacific Islander householders$333,275 Some other race householders$298,371 Two or more races householders$325,619 Hispanic or Latino householders
Median age by race in North Plainfield
45.9 Median age for White residents45.6 46.2 39.9 Median age for Black or African American residents37.4 44.2 -666,666,666.0 Median age for American Indian / Alaska Native residents-643,500,642.9 -1,220,338,981.8 41.0 Median age for Asian residents38.3 52.7 -804,177,544.9 Median age for Native Hawaiian / Pacific Islander residents-666,666,666.0 -713,070,378.3 32.4 Median age for Other race residents32.7 34.6 41.2 Median age for Two or more races residents43.3 35.3 47.1 Median age for White alone residents45.9 47.6 34.9 Median age for Hispanic or Latino residents35.5 34.0
Owner/renter occupied households by race in North Plainfield
House owners and renters - White residents 2,060 72.3% Owner occupied788 27.7% Renter occupiedHouse owners and renters - Black or African American residents 1,073 55.1% Owner occupied875 44.9% Renter occupiedHouse owners and renters - American Indian / Alaska Native residents 15 100.0% Owner occupiedHouse owners and renters - Asian residents 338 88.7% Owner occupied43 11.3% Renter occupiedHouse owners and renters - Other race residents 610 33.1% Owner occupied1,235 66.9% Renter occupiedHouse owners and renters - Two or more races residents 871 49.8% Owner occupied877 50.2% Renter occupiedHouse owners and renters - White alone residents 1,659 78.6% Owner occupied451 21.4% Renter occupiedHouse owners and renters - Hispanic or Latino residents 1,540 40.3% Owner occupied2,284 59.7% Renter occupied
Language usage in North Plainfield
English speakers - Total 44.9% of residents of North Plainfield speak English at home.
44.6% of residents speak Spanish at home 4,397 46.5% Speak English very well5,066 53.5% Speak English less than very well10.3% of residents speak other language at home 1,677 76.8% Speak English very well506 23.2% Speak English less than very well
English speakers - Born in the United States 82.4% of residents of North Plainfield speak English at home.
13.2% of residents speak Spanish at home 285 81.0% Speak English very well67 19.0% Speak English less than very well4.3% of residents speak other language at home 115 100.0% Speak English very well
English speakers - Native, born elsewhere 25.7% of residents of North Plainfield speak English at home.
75.0% of residents speak Spanish at home 120 58.0% Speak English very well87 42.0% Speak English less than very well4.3% of residents speak other language at home 12 100.0% Speak English very well
English speakers - Foreign-born 16.6% of residents of North Plainfield speak English at home.
62.7% of residents speak Spanish at home 1,485 25.8% Speak English very well4,269 74.2% Speak English less than very well16.8% of residents speak other language at home 1,052 68.2% Speak English very well491 31.8% Speak English less than very well
White (Caucasian) - Speak only English Native:
76.8% (3,787)Foreign-born:
4.5% (72)
White (Caucasian) - Speak another language Native:
22.9% (1,129)Foreign-born:
97.4% (1,564)
Black or African American - Speak only English Native:
96.9% (3,303)Foreign-born:
70.9% (948)
Black or African American - Speak another language Native:
3.3% (112)Foreign-born:
28.1% (376)
Asian - Speak only English Native:
48.9% (177)Foreign-born:
16.8% (116)
Asian - Speak another language Native:
50.5% (183)Foreign-born:
83.1% (571)
Other race - Speak only English Native:
8.0% (160)Foreign-born:
7.9% (277)
Other race - Speak another language Native:
100.0% (2,010)Foreign-born:
92.0% (3,239)
Two or more races - Speak only English Native:
35.3% (558)Foreign-born:
22.6% (619)
Two or more races - Speak another language Native:
60.2% (952)Foreign-born:
77.5% (2,125)
White alone - Speak only English Native:
85.2% (3,629)Foreign-born:
13.0% (49)
White alone - Speak another language Native:
17.0% (724)Foreign-born:
91.1% (343)
Hispanic or Latino - Speak only English Native:
17.4% (676)Foreign-born:
9.5% (602)
Hispanic or Latino - Speak another language Native:
83.7% (3,254)Foreign-born:
90.7% (5,743)
Foreign-born residents in North Plainfield 9,339 residents are foreign born (33.2% Latin America ).
This city:
40.9%New Jersey:
23.2%
Marital status for residents in North Plainfield Marital status - White (Caucasian) population 15 years and over
Males 39.0% Never married48.3% Now married1.8% Separated4.1% Widowed6.7% DivorcedFemales 36.8% Never married45.3% Now married0.3% Separated6.1% Widowed11.4% DivorcedWomen who gave birth in the past 12 months Now married:
54.3% (68)Unmarried:
45.7% (57)
Women who did not give birth in the past 12 months Now married:
37.6% (502)Unmarried:
62.4% (833)
Marital status - Black or African American population 15 years and over
Males 43.2% Never married49.4% Now married1.3% Separated0.6% Widowed5.5% DivorcedFemales 50.3% Never married25.5% Now married9.3% Separated7.0% Widowed8.0% DivorcedWomen who gave birth in the past 12 months Now married:
97.6% (37)Unmarried:
2.4% (1)
Women who did not give birth in the past 12 months Now married:
23.3% (312)Unmarried:
76.7% (1,028)
Marital status - Asian population 15 years and over
Males 48.7% Never married47.8% Now married0.0% Separated3.5% Widowed0.0% DivorcedFemales 15.4% Never married58.5% Now married0.0% Separated20.4% Widowed5.7% DivorcedWomen who did not give birth in the past 12 months Now married:
71.9% (100)Unmarried:
28.1% (39)
Marital status - Other race population 15 years and over
Males 45.6% Never married46.8% Now married2.3% Separated1.0% Widowed4.4% DivorcedFemales 47.4% Never married37.8% Now married5.7% Separated3.1% Widowed6.0% DivorcedWomen who gave birth in the past 12 months Now married:
34.4% (23)Unmarried:
65.6% (43)
Women who did not give birth in the past 12 months Now married:
40.6% (650)Unmarried:
59.4% (953)
Marital status - Two or more races population 15 years and over
Males 36.3% Never married60.7% Now married0.0% Separated0.5% Widowed2.4% DivorcedFemales 25.9% Never married65.8% Now married2.6% Separated2.6% Widowed3.1% DivorcedWomen who gave birth in the past 12 months Now married:
100.0% (158)Unmarried:
0.0% (0)
Women who did not give birth in the past 12 months Now married:
55.5% (643)Unmarried:
44.5% (515)
Marital status - White alone, not Hispanic / Latino population 15 years and over
Males 37.2% Never married48.8% Now married1.2% Separated5.9% Widowed6.9% DivorcedFemales 33.4% Never married47.3% Now married0.5% Separated6.5% Widowed12.3% DivorcedWomen who gave birth in the past 12 months Now married:
100.0% (71)Unmarried:
0.0% (0)
Women who did not give birth in the past 12 months Now married:
39.7% (325)Unmarried:
60.3% (494)
Marital status - Hispanic or Latino population 15 years and over
Males 43.7% Never married49.5% Now married2.0% Separated0.5% Widowed4.4% DivorcedFemales 41.6% Never married45.8% Now married3.0% Separated3.3% Widowed6.3% DivorcedWomen who gave birth in the past 12 months Now married:
49.5% (107)Unmarried:
50.5% (109)
Women who did not give birth in the past 12 months Now married:
41.8% (1,213)Unmarried:
58.2% (1,691)
Ancestries in North Plainfield
609 4.2% American521 3.6% African482 3.3% Jamaican447 3.0% Italian257 1.8% Palestinian165 1.1% Irish160 1.1% Polish155 1.1% English133 0.9% Scottish126 0.9% German115 0.8% Guyanese109 0.7% Portuguese74 0.5% British West Indian71 0.5% Russian48 0.3% Canadian30 0.2% Haitian17 0.1% Egyptian16 0.1% Slovak16 0.1% Ukrainian12 0.08% Yugoslavian10 0.07% Norwegian9 0.06% Czechoslovakian7 0.05% Lithuanian7 0.05% Northern European7 0.05% West Indian4 0.03% Austrian3 0.02% Armenian
Geographical mobility in North Plainfield Same house 1 year ago 6,435 91.4% White (Caucasian)4,503 95.1% Black or African American16 96.6% American Indian / Alaska Native988 88.6% Asian5,863 99.2% Other race4,653 94.1% Two or more races4,514 92.2% White alone, not Hispanic / Latino10,935 97.2% Hispanic or LatinoMoved within same county 356 5.1% White / Caucasian69 1.5% Black or African American15 1.3% Asian7 0.1% Other race189 3.8% White alone, not Hispanic / Latino84 0.7% Hispanic or LatinoMoved within same state 197 2.8% White / Caucasian85 1.8% Black or African American14 1.2% Asian148 2.5% Other race191 3.9% Two or more races118 2.4% White alone, not Hispanic / Latino455 4.0% Hispanic or LatinoMoved from different state 38 0.5% White / Caucasian28 0.6% Black or African American134 12.0% Asian84 1.4% Other race37 0.8% White alone, not Hispanic / Latino95 0.8% Hispanic or LatinoMoved from abroad 54 0.9% Other race44 0.9% Two or more races28 0.2% Hispanic or Latino
Children Nativity (place of birth) in North Plainfield
Children under 6 years - Living with two parents Both parents native 326 100.0% NativeBoth parents foreign-born 610 100.0% NativeOne native, one foreign-born parent 81 100.0% NativeChildren under 6 years - Living with one parent Foreign-born parent 957 100.0% NativeChildren 6 to 17 years - Living with two parents Both parents native 494 100.0% NativeBoth parents foreign-born 1,125 73.3% Native409 26.7% Foreign-bornOne native, one foreign-born parent 99 100.0% NativeChildren 6 to 17 years - Living with one parent Native parent 227 100.0% NativeForeign-born parent 612 50.2% Native606 49.8% Foreign-born
Grandparents responsible for own grandchildren in North Plainfield
Grandparents (30 to 59 years) White / Caucasian 23 100.0% Not responsible for grandchildrenBlack or African American 27 81.0% Responsible for grandchildren6 19.0% Not responsible for grandchildrenOther race 30 26.8% Responsible for grandchildren81 73.2% Not responsible for grandchildrenTwo or more races 57 40.7% Responsible for grandchildren83 59.3% Not responsible for grandchildrenWhite alone, not Hispanic / Latino 9 100.0% Not responsible for grandchildrenHispanic or Latino 63 30.6% Responsible for grandchildren143 69.4% Not responsible for grandchildrenGrandparents (60 years and over) White / Caucasian 22 9.8% Responsible for grandchildren204 90.2% Not responsible for grandchildrenBlack or African American 29 100.0% Not responsible for grandchildrenOther race 87 78.3% Responsible for grandchildren24 21.7% Not responsible for grandchildrenTwo or more races 289 100.0% Not responsible for grandchildrenWhite alone, not Hispanic / Latino 25 32.6% Responsible for grandchildren52 67.4% Not responsible for grandchildrenHispanic or Latino 62 12.7% Responsible for grandchildren426 87.3% Not responsible for grandchildren