Races in North Kensington, Maryland (MD) Detailed Stats
Data:
Races - White alone (%)
Races - White alone (% change since 2000)
Races - Black alone (%)
Races - Black alone (% change since 2000)
Races - American Indian alone (%)
Races - American Indian alone (% change since 2000)
Races - Asian alone (%)
Races - Asian alone (% change since 2000)
Races - Hispanic (%)
Races - Hispanic (% change since 2000)
Races - Native Hawaiian and Other Pacific Islander alone (%)
Races - Native Hawaiian and Other Pacific Islander alone (% change since 2000)
Races - Two or more races(%)
Races - Two or more races(% change since 2000)
Races - Other race alone (%)
Races - Other race alone (% change since 2000)
Racial diversity
Place of birth - Born in state of residence (%)
Place of birth - Born in state of residence (%) - White
Place of birth - Born in state of residence (%) - Black or African American
Place of birth - Born in state of residence (%) - Asian
Place of birth - Born in state of residence (%) - Hispanic or Latino
Place of birth - Born in state of residence (%) - American Indian and Alaska Native
Place of birth - Born in state of residence (%) - Multirace
Place of birth - Born in state of residence (%) - Other Race
Place of birth - Born in other state (%)
Place of birth - Born in other state (%) - White
Place of birth - Born in other state (%) - Black or African American
Place of birth - Born in other state (%) - Asian
Place of birth - Born in other state (%) - Hispanic or Latino
Place of birth - Born in other state (%) - American Indian and Alaska Native
Place of birth - Born in other state (%) - Multirace
Place of birth - Born in other state (%) - Other Race
Place of birth - Native, outside of US (%)
Place of birth - Native, outside of US (%) - White
Place of birth - Native, outside of US (%) - Black or African American
Place of birth - Native, outside of US (%) - Asian
Place of birth - Native, outside of US (%) - Hispanic or Latino
Place of birth - Native, outside of US (%) - American Indian and Alaska Native
Place of birth - Native, outside of US (%) - Multirace
Place of birth - Native, outside of US (%) - Other Race
Place of birth - Foreign born (%)
Place of birth - Foreign born (%) - White
Place of birth - Foreign born (%) - Black or African American
Place of birth - Foreign born (%) - Asian
Place of birth - Foreign born (%) - Hispanic or Latino
Place of birth - Foreign born (%) - American Indian and Alaska Native
Place of birth - Foreign born (%) - Multirace
Place of birth - Foreign born (%) - Other Race
Residents speaking English at home (%)
Residents speaking English at home - Born in the United States (%)
Residents speaking English at home - Native, born elsewhere (%)
Residents speaking English at home - Foreign born (%)
Residents speaking Spanish at home (%)
Residents speaking Spanish at home - Born in the United States (%)
Residents speaking Spanish at home - Native, born elsewhere (%)
Residents speaking Spanish at home - Foreign born (%)
Residents speaking other language at home (%)
Residents speaking other language at home - Born in the United States (%)
Residents speaking other language at home - Native, born elsewhere (%)
Residents speaking other language at home - Foreign born (%)
Marital status - Never married (%)
Marital status - Now married (%)
Marital status - Separated (%)
Marital status - Widowed (%)
Marital status - Divorced (%)
Ancestries Reported - Arab (%)
Ancestries Reported - Czech (%)
Ancestries Reported - Danish (%)
Ancestries Reported - Dutch (%)
Ancestries Reported - English (%)
Ancestries Reported - French (%)
Ancestries Reported - French Canadian (%)
Ancestries Reported - German (%)
Ancestries Reported - Greek (%)
Ancestries Reported - Hungarian (%)
Ancestries Reported - Irish (%)
Ancestries Reported - Italian (%)
Ancestries Reported - Lithuanian (%)
Ancestries Reported - Norwegian (%)
Ancestries Reported - Polish (%)
Ancestries Reported - Portuguese (%)
Ancestries Reported - Russian (%)
Ancestries Reported - Scotch-Irish (%)
Ancestries Reported - Scottish (%)
Ancestries Reported - Slovak (%)
Ancestries Reported - Subsaharan African (%)
Ancestries Reported - Swedish (%)
Ancestries Reported - Swiss (%)
Ancestries Reported - Ukrainian (%)
Ancestries Reported - United States (%)
Ancestries Reported - Welsh (%)
Ancestries Reported - West Indian (%)
Ancestries Reported - Other (%)
Geographical mobility - Same house 1 year ago (%)
Geographical mobility - Same house 1 year ago (%) - White
Geographical mobility - Same house 1 year ago (%) - Black or African American
Geographical mobility - Same house 1 year ago (%) - Asian
Geographical mobility - Same house 1 year ago (%) - Hispanic or Latino
Geographical mobility - Same house 1 year ago (%) - American Indian and Alaska Native
Geographical mobility - Same house 1 year ago (%) - Multirace
Geographical mobility - Same house 1 year ago (%) - Other Race
Geographical mobility - Moved within same county (%)
Geographical mobility - Moved within same county (%) - White
Geographical mobility - Moved within same county (%) - Black or African American
Geographical mobility - Moved within same county (%) - Asian
Geographical mobility - Moved within same county (%) - Hispanic or Latino
Geographical mobility - Moved within same county (%) - American Indian and Alaska Native
Geographical mobility - Moved within same county (%) - Multirace
Geographical mobility - Moved within same county (%) - Other Race
Geographical mobility - Moved from different county within same state (%)
Geographical mobility - Moved from different county within same state (%) - White
Geographical mobility - Moved from different county within same state (%) - Black or African American
Geographical mobility - Moved from different county within same state (%) - Asian
Geographical mobility - Moved from different county within same state (%) - Hispanic or Latino
Geographical mobility - Moved from different county within same state (%) - American Indian and Alaska Native
Geographical mobility - Moved from different county within same state (%) - Multirace
Geographical mobility - Moved from different county within same state (%) - Other Race
Geographical mobility - Moved from different state (%)
Geographical mobility - Moved from different state (%) - White
Geographical mobility - Moved from different state (%) - Black or African American
Geographical mobility - Moved from different state (%) - Asian
Geographical mobility - Moved from different state (%) - Hispanic or Latino
Geographical mobility - Moved from different state (%) - American Indian and Alaska Native
Geographical mobility - Moved from different state (%) - Multirace
Geographical mobility - Moved from different state (%) - Other Race
Geographical mobility - Moved from abroad (%)
Geographical mobility - Moved from abroad (%) - White
Geographical mobility - Moved from abroad (%) - Black or African American
Geographical mobility - Moved from abroad (%) - Asian
Geographical mobility - Moved from abroad (%) - Hispanic or Latino
Geographical mobility - Moved from abroad (%) - American Indian and Alaska Native
Geographical mobility - Moved from abroad (%) - Multirace
Geographical mobility - Moved from abroad (%) - Other Race
Place of birth for the foreign-born population - Ireland (%)
Place of birth for the foreign-born population - Denmark (%)
Place of birth for the foreign-born population - Norway (%)
Place of birth for the foreign-born population - Sweden (%)
Place of birth for the foreign-born population - United Kingdom (%)
Place of birth for the foreign-born population - England (%)
Place of birth for the foreign-born population - Scotland (%)
Place of birth for the foreign-born population - Other Northern Europe (%)
Place of birth for the foreign-born population - Austria (%)
Place of birth for the foreign-born population - Belgium (%)
Place of birth for the foreign-born population - France (%)
Place of birth for the foreign-born population - Germany (%)
Place of birth for the foreign-born population - Netherlands (%)
Place of birth for the foreign-born population - Switzerland (%)
Place of birth for the foreign-born population - Other Western Europe (%)
Place of birth for the foreign-born population - Greece (%)
Place of birth for the foreign-born population - Italy (%)
Place of birth for the foreign-born population - Portugal (%)
Place of birth for the foreign-born population - Spain (%)
Place of birth for the foreign-born population - Other Southern Europe (%)
Place of birth for the foreign-born population - Albania (%)
Place of birth for the foreign-born population - Belarus (%)
Place of birth for the foreign-born population - Bosnia and Herzegovina (%)
Place of birth for the foreign-born population - Bulgaria (%)
Place of birth for the foreign-born population - Croatia (%)
Place of birth for the foreign-born population - Czechoslovakia (%)
Place of birth for the foreign-born population - Hungary (%)
Place of birth for the foreign-born population - Latvia (%)
Place of birth for the foreign-born population - Lithuania (%)
Place of birth for the foreign-born population - North Macedonia (Macedonia) (%)
Place of birth for the foreign-born population - Moldova (%)
Place of birth for the foreign-born population - Poland (%)
Place of birth for the foreign-born population - Romania (%)
Place of birth for the foreign-born population - Russia (%)
Place of birth for the foreign-born population - Serbia (%)
Place of birth for the foreign-born population - Ukraine (%)
Place of birth for the foreign-born population - Other Eastern Europe (%)
Place of birth for the foreign-born population - China (%)
Place of birth for the foreign-born population - Hong Kong (%)
Place of birth for the foreign-born population - Taiwan (%)
Place of birth for the foreign-born population - Japan (%)
Place of birth for the foreign-born population - Korea (%)
Place of birth for the foreign-born population - Other Eastern Asia (%)
Place of birth for the foreign-born population - Afghanistan (%)
Place of birth for the foreign-born population - Bangladesh (%)
Place of birth for the foreign-born population - India (%)
Place of birth for the foreign-born population - Iran (%)
Place of birth for the foreign-born population - Kazakhstan (%)
Place of birth for the foreign-born population - Nepal (%)
Place of birth for the foreign-born population - Pakistan (%)
Place of birth for the foreign-born population - Sri Lanka (%)
Place of birth for the foreign-born population - Uzbekistan (%)
Place of birth for the foreign-born population - Other South Central Asia (%)
Place of birth for the foreign-born population - Burma (%)
Place of birth for the foreign-born population - Cambodia (%)
Place of birth for the foreign-born population - Indonesia (%)
Place of birth for the foreign-born population - Laos (%)
Place of birth for the foreign-born population - Malaysia (%)
Place of birth for the foreign-born population - Philippines (%)
Place of birth for the foreign-born population - Singapore (%)
Place of birth for the foreign-born population - Thailand (%)
Place of birth for the foreign-born population - Vietnam (%)
Place of birth for the foreign-born population - Other South Eastern Asia (%)
Place of birth for the foreign-born population - Armenia (%)
Place of birth for the foreign-born population - Iraq (%)
Place of birth for the foreign-born population - Israel (%)
Place of birth for the foreign-born population - Jordan (%)
Place of birth for the foreign-born population - Kuwait (%)
Place of birth for the foreign-born population - Lebanon (%)
Place of birth for the foreign-born population - Saudi Arabia (%)
Place of birth for the foreign-born population - Syria (%)
Place of birth for the foreign-born population - Turkey (%)
Place of birth for the foreign-born population - Yemen (%)
Place of birth for the foreign-born population - Other Western Asia (%)
Place of birth for the foreign-born population - Eritrea (%)
Place of birth for the foreign-born population - Ethiopia (%)
Place of birth for the foreign-born population - Kenya (%)
Place of birth for the foreign-born population - Somalia (%)
Place of birth for the foreign-born population - Uganda (%)
Place of birth for the foreign-born population - Zimbabwe (%)
Place of birth for the foreign-born population - Other Eastern Africa (%)
Place of birth for the foreign-born population - Cameroon (%)
Place of birth for the foreign-born population - Congo (%)
Place of birth for the foreign-born population - Democratic Republic of Congo (Zaire) (%)
Place of birth for the foreign-born population - Other Middle Africa (%)
Place of birth for the foreign-born population - Egypt (%)
Place of birth for the foreign-born population - Morocco (%)
Place of birth for the foreign-born population - Sudan (%)
Place of birth for the foreign-born population - Other Northern Africa (%)
Place of birth for the foreign-born population - South Africa (%)
Place of birth for the foreign-born population - Other Southern Africa (%)
Place of birth for the foreign-born population - Cabo Verde (%)
Place of birth for the foreign-born population - Ghana (%)
Place of birth for the foreign-born population - Liberia (%)
Place of birth for the foreign-born population - Nigeria (%)
Place of birth for the foreign-born population - Senegal (%)
Place of birth for the foreign-born population - Sierra Leone (%)
Place of birth for the foreign-born population - Other Western Africa (%)
Place of birth for the foreign-born population - Australia (%)
Place of birth for the foreign-born population - New Zealand (%)
Place of birth for the foreign-born population - Fiji (%)
Place of birth for the foreign-born population - Micronesia (%)
Place of birth for the foreign-born population - Bahamas (%)
Place of birth for the foreign-born population - Barbados (%)
Place of birth for the foreign-born population - Cuba (%)
Place of birth for the foreign-born population - Dominica (%)
Place of birth for the foreign-born population - Dominican Republic (%)
Place of birth for the foreign-born population - Grenada (%)
Place of birth for the foreign-born population - Haiti (%)
Place of birth for the foreign-born population - Jamaica (%)
Place of birth for the foreign-born population - St. Vincent and the Grenadines (%)
Place of birth for the foreign-born population - Trinidad and Tobago (%)
Place of birth for the foreign-born population - West Indies (%)
Place of birth for the foreign-born population - Other Caribbean (%)
Place of birth for the foreign-born population - Belize (%)
Place of birth for the foreign-born population - Costa Rica (%)
Place of birth for the foreign-born population - El Salvador (%)
Place of birth for the foreign-born population - Guatemala (%)
Place of birth for the foreign-born population - Honduras (%)
Place of birth for the foreign-born population - Mexico (%)
Place of birth for the foreign-born population - Nicaragua (%)
Place of birth for the foreign-born population - Panama (%)
Place of birth for the foreign-born population - Other Central America (%)
Place of birth for the foreign-born population - Argentina (%)
Place of birth for the foreign-born population - Bolivia (%)
Place of birth for the foreign-born population - Brazil (%)
Place of birth for the foreign-born population - Chile (%)
Place of birth for the foreign-born population - Colombia (%)
Place of birth for the foreign-born population - Ecuador (%)
Place of birth for the foreign-born population - Guyana (%)
Place of birth for the foreign-born population - Peru (%)
Place of birth for the foreign-born population - Uruguay (%)
Place of birth for the foreign-born population - Venezuela (%)
Place of birth for the foreign-born population - Other South America (%)
Place of birth for the foreign-born population - Canada (%)
Place of birth for the foreign-born population - Other Northern America (%)
Place of birth for the foreign-born population - Other (%)
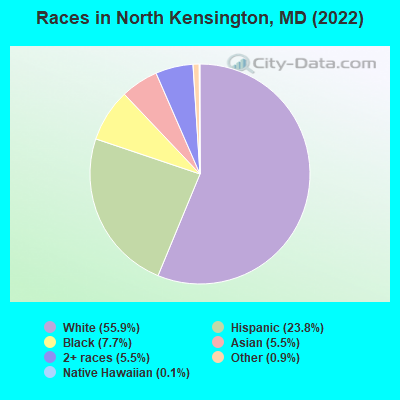
According to 2022 data, the most numerous races in North Kensington, MD are White alone (4,717 residents), Black alone (651 residents), and Hispanic (2,012 residents). 64.6% of North Kensington residents speak English at home. 23.6% of North Kensington, MD residents are foreign-born (13.4% born in Latin America, 4.6% born in Asia, 2.8% born in Europe), which is 32.1% greater than the foreign-born rate of 16.0% across the entire state of Maryland.
Race distribution in North Kensington
2000 2022
3,286,547 62.1% White alone 1,464,735 27.7% Black alone 227,916 4.3% Hispanic 209,738 4.0% Asian alone 82,946 1.6% Two or more races 13,312 0.3% American Indian alone 9,379 0.2% Other race alone 1,913 0.04% Native Hawaiian and Other
2,906,492 47.1% White alone 1,800,914 29.2% Black alone 705,842 11.4% Hispanic 401,818 6.5% Asian alone 291,317 4.7% Two or more races 46,930 0.8% Other race alone 8,930 0.1% American Indian alone 2,417 0.04% Native Hawaiian and Other
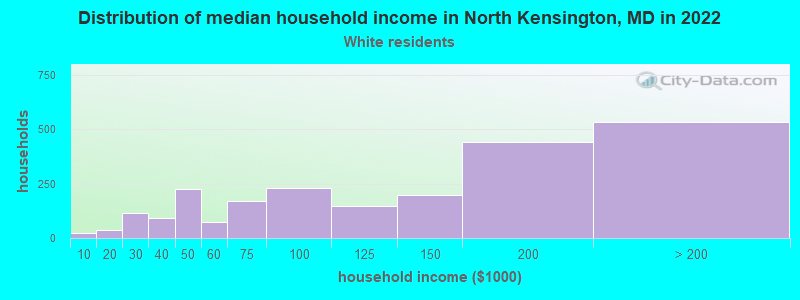
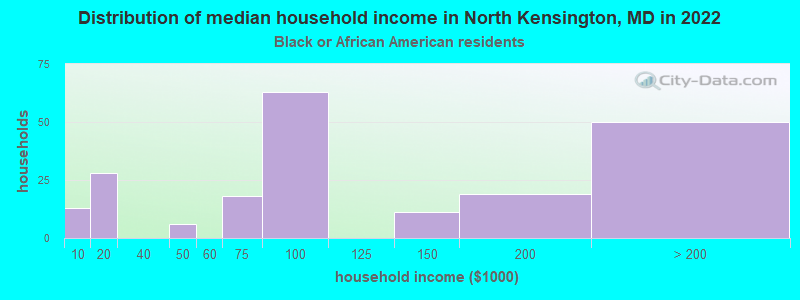
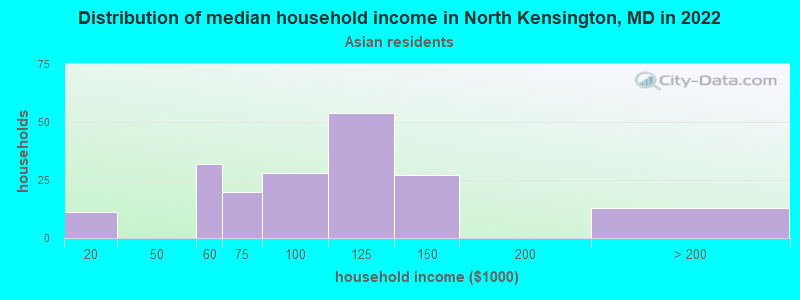
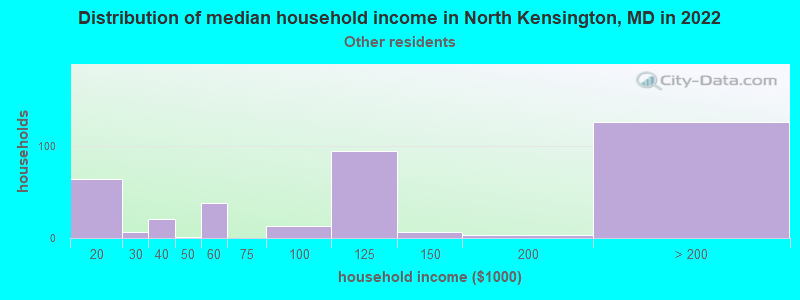
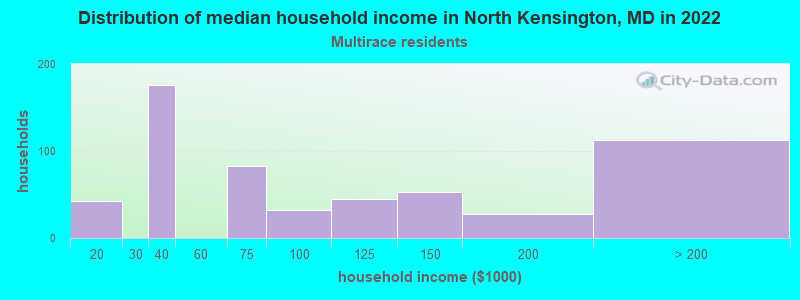
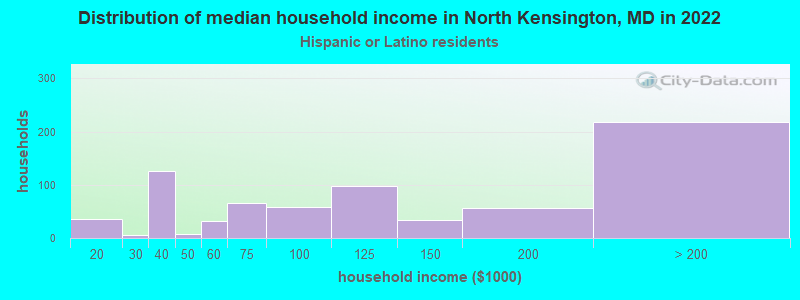
Income and house value in North Kensington Median household income in 2022 $127,266 White non-Hispanic householders$83,374 Black householders$100,623 Asian householders$117,525 Some other race householders$91,500 Two or more races householders$113,634 Hispanic or Latino race householdersMedian 2022 house value $597,389 White Non-Hispanic householders$560,115 Black or African American householders$377,775 American Indian or Alaska Native householders $605,448 Asian householders$541,646 Some other race householders$635,670 Two or more races householders$550,713 Hispanic or Latino householders
Median age by race in North Kensington
47.2 Median age for White residents43.3 49.6 43.6 Median age for Black or African American residents29.0 46.9 -610,526,315.2 Median age for American Indian / Alaska Native residents-555,555,555.0 -671,704,449.4 64.4 Median age for Asian residents63.7 67.6 -763,333,332.6 Median age for Native Hawaiian / Pacific Islander residents-720,061,021.4 -760,942,760.2 36.3 Median age for Other race residents29.9 35.8 46.7 Median age for Two or more races residents43.7 50.2 46.6 Median age for White alone residents44.5 48.7 38.2 Median age for Hispanic or Latino residents36.5 40.5
Owner/renter occupied households by race in North Kensington
House owners and renters - White residents 1,994 89.0% Owner occupied247 11.0% Renter occupiedHouse owners and renters - Black or African American residents 146 68.4% Owner occupied67 31.6% Renter occupiedHouse owners and renters - American Indian / Alaska Native residents 20 100.0% Owner occupiedHouse owners and renters - Asian residents 178 89.5% Owner occupied21 10.5% Renter occupiedHouse owners and renters - Native Hawaiian / Pacific Islander residents 18 100.0% Owner occupiedHouse owners and renters - Other race residents 295 77.5% Owner occupied86 22.5% Renter occupiedHouse owners and renters - Two or more races residents 279 56.6% Owner occupied214 43.4% Renter occupiedHouse owners and renters - White alone residents 1,954 88.3% Owner occupied260 11.7% Renter occupiedHouse owners and renters - Hispanic or Latino residents 525 72.5% Owner occupied200 27.5% Renter occupied
Language usage in North Kensington
English speakers - Total 64.6% of residents of North Kensington speak English at home.
21.4% of residents speak Spanish at home 965 56.8% Speak English very well734 43.2% Speak English less than very well13.1% of residents speak other language at home 643 62.1% Speak English very well392 37.9% Speak English less than very well
English speakers - Born in the United States 83.4% of residents of North Kensington speak English at home.
9.3% of residents speak Spanish at home 331 87.8% Speak English very well46 12.2% Speak English less than very well7.1% of residents speak other language at home 251 88.1% Speak English very well34 11.9% Speak English less than very well
English speakers - Native, born elsewhere 66.9% of residents of North Kensington speak English at home.
27.0% of residents speak Spanish at home 44 100.0% Speak English very well
English speakers - Foreign-born 11.0% of residents of North Kensington speak English at home.
52.8% of residents speak Spanish at home 425 40.5% Speak English very well624 59.5% Speak English less than very well35.3% of residents speak other language at home 361 51.5% Speak English very well340 48.5% Speak English less than very well
White (Caucasian) - Speak only English Native:
93.6% (3,930)Foreign-born:
16.0% (57)
White (Caucasian) - Speak another language Native:
6.7% (280)Foreign-born:
82.8% (295)
Black or African American - Speak only English Native:
96.0% (410)Foreign-born:
33.5% (63)
Black or African American - Speak another language Native:
3.0% (13)Foreign-born:
63.6% (120)
Asian - Speak only English Native:
41.9% (47)Foreign-born:
18.4% (65)
Asian - Speak another language Native:
59.1% (66)Foreign-born:
81.9% (289)
Other race - Speak only English Native:
11.1% (40)Foreign-born:
2.0% (11)
Other race - Speak another language Native:
85.4% (306)Foreign-born:
98.4% (532)
Two or more races - Speak only English Native:
59.9% (439)Foreign-born:
3.9% (26)
Two or more races - Speak another language Native:
41.1% (301)Foreign-born:
95.4% (622)
White alone - Speak only English Native:
94.2% (3,886)Foreign-born:
14.5% (43)
White alone - Speak another language Native:
5.8% (239)Foreign-born:
86.4% (255)
Hispanic or Latino - Speak only English Native:
28.8% (223)Foreign-born:
2.2% (24)
Hispanic or Latino - Speak another language Native:
71.0% (551)Foreign-born:
98.0% (1,061)
Foreign-born residents in North Kensington 1,989 residents are foreign born (13.4% Latin America , 4.6% Asia , 2.8% Europe ).
This city:
23.6%Maryland:
15.7%
Marital status for residents in North Kensington Marital status - White (Caucasian) population 15 years and over
Males 27.5% Never married62.2% Now married1.2% Separated3.6% Widowed5.5% DivorcedFemales 26.4% Never married46.4% Now married2.9% Separated12.1% Widowed12.2% DivorcedWomen who gave birth in the past 12 months Now married:
80.6% (25)Unmarried:
19.4% (6)
Women who did not give birth in the past 12 months Now married:
60.3% (565)Unmarried:
39.7% (372)
Marital status - Black or African American population 15 years and over
Males 43.2% Never married35.0% Now married6.1% Separated3.2% Widowed12.5% DivorcedFemales 54.2% Never married36.4% Now married2.3% Separated0.8% Widowed6.4% DivorcedWomen who did not give birth in the past 12 months Now married:
21.5% (32)Unmarried:
78.5% (117)
Marital status - American Indian / Alaska Native population 15 years and over
Males 100.0% Never married0.0% Now married0.0% Separated0.0% Widowed0.0% DivorcedFemales 0.0% Never married100.0% Now married0.0% Separated0.0% Widowed0.0% DivorcedMarital status - Asian population 15 years and over
Males 29.9% Never married31.4% Now married0.0% Separated3.4% Widowed35.3% DivorcedFemales 7.0% Never married76.2% Now married0.0% Separated16.8% Widowed0.0% DivorcedWomen who gave birth in the past 12 months Now married:
100.0% (7)Unmarried:
0.0% (0)
Women who did not give birth in the past 12 months Now married:
80.7% (71)Unmarried:
19.3% (17)
Marital status - Other race population 15 years and over
Males 24.7% Never married65.0% Now married0.0% Separated0.0% Widowed10.3% DivorcedFemales 21.7% Never married60.2% Now married0.0% Separated8.8% Widowed9.4% DivorcedWomen who did not give birth in the past 12 months Now married:
75.7% (252)Unmarried:
24.3% (81)
Marital status - Two or more races population 15 years and over
Males 32.9% Never married55.7% Now married3.7% Separated0.0% Widowed7.7% DivorcedFemales 24.3% Never married43.4% Now married0.0% Separated11.6% Widowed20.7% DivorcedWomen who gave birth in the past 12 months Now married:
100.0% (10)Unmarried:
0.0% (0)
Women who did not give birth in the past 12 months Now married:
60.1% (141)Unmarried:
39.9% (94)
Marital status - White alone, not Hispanic / Latino population 15 years and over
Males 28.2% Never married60.8% Now married1.3% Separated3.9% Widowed5.9% DivorcedFemales 27.0% Never married46.3% Now married2.6% Separated11.5% Widowed12.6% DivorcedWomen who gave birth in the past 12 months Now married:
80.6% (27)Unmarried:
19.4% (7)
Women who did not give birth in the past 12 months Now married:
61.2% (567)Unmarried:
38.8% (359)
Marital status - Hispanic or Latino population 15 years and over
Males 23.4% Never married68.9% Now married2.0% Separated0.0% Widowed5.7% DivorcedFemales 23.2% Never married54.9% Now married1.9% Separated9.2% Widowed10.7% DivorcedWomen who gave birth in the past 12 months Now married:
100.0% (9)Unmarried:
0.0% (0)
Women who did not give birth in the past 12 months Now married:
68.3% (337)Unmarried:
31.7% (157)
Ancestries in North Kensington
444 10.0% Irish297 6.7% German213 4.8% English137 3.1% Russian121 2.7% American119 2.7% Lithuanian90 2.0% European68 1.5% African66 1.5% Portuguese55 1.2% Polish54 1.2% Ethiopian51 1.1% Bulgarian49 1.1% Scotch-Irish47 1.1% Italian45 1.0% Greek43 1.0% Brazilian34 0.8% Welsh24 0.5% Danish20 0.4% Swedish20 0.4% British20 0.4% French18 0.4% West Indian15 0.3% Trinidadian and Tobagonian15 0.3% Lebanese11 0.2% Slavic11 0.2% Czechoslovakian11 0.2% Ukrainian10 0.2% Scottish10 0.2% Armenian9 0.2% Iranian8 0.2% Eastern European8 0.2% Liberian7 0.2% French Canadian7 0.2% Celtic6 0.1% Moroccan5 0.1% Norwegian4 0.09% Dutch4 0.09% Jamaican
Children Nativity (place of birth) in North Kensington
Children under 6 years - Living with two parents Both parents native 309 100.0% NativeBoth parents foreign-born 76 100.0% NativeOne native, one foreign-born parent 145 100.0% NativeChildren under 6 years - Living with one parent Native parent 59 100.0% NativeForeign-born parent 20 100.0% NativeChildren 6 to 17 years - Living with two parents Both parents native 427 96.3% Native16 3.7% Foreign-bornBoth parents foreign-born 62 41.7% Native87 58.3% Foreign-bornOne native, one foreign-born parent 58 100.0% NativeChildren 6 to 17 years - Living with one parent Native parent 241 100.0% NativeForeign-born parent 123 51.3% Native117 48.7% Foreign-born
Grandparents responsible for own grandchildren in North Kensington
Grandparents (30 to 59 years) White / Caucasian 11 100.0% Not responsible for grandchildrenWhite alone, not Hispanic / Latino 19 100.0% Not responsible for grandchildren
Grandparents (60 years and over) White / Caucasian 38 100.0% Not responsible for grandchildrenWhite alone, not Hispanic / Latino 31 100.0% Not responsible for grandchildren