Races in North Brunswick Township, New Jersey (NJ) Detailed Stats
Ancestries, Foreign-born residents, place of birth

Recent posts about races in North Brunswick Township, New Jersey on our local forum with over 2,400,000 registered users:
 | Looking for ethnically diverse towns (22 replies) |
| Need Advice! Not familiar with Jersey (6 replies) |
24.4% of North Brunswick Township, NJ residents are foreign-born (12.0% born in Asia, 5.5% born in Latin America, 4.5% born in Europe), which is 5.8% greater than the foreign-born rate of 23.0% across the entire state of New Jersey.
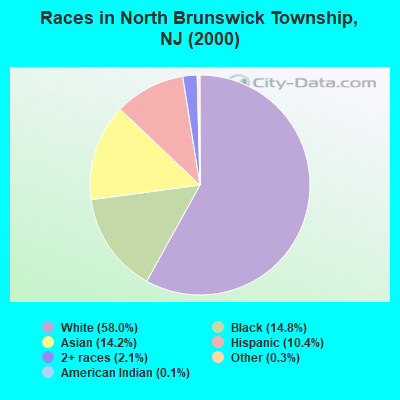
Race distribution in North Brunswick Township

- 21,05658.0%White alone
- 5,37014.8%Black alone
- 5,14214.2%Asian alone
- 3,77510.4%Hispanic
- 7712.1%Two or more races
- 1260.3%Other race alone
- 390.1%American Indian alone
- 80.02%Native Hawaiian and Other
Pacific Islander alone
2000
2022
-
- 5,557,20966.0%White alone
- 1,117,19113.3%Hispanic
- 1,096,17113.0%Black alone
- 477,0125.7%Asian alone
- 133,6891.6%Two or more races
- 19,5650.2%Other race alone
- 11,3380.1%American Indian alone
- 2,1750.03%Native Hawaiian and Other
Pacific Islander alone

-
- 4,766,47651.5%White alone
- 2,028,47021.9%Hispanic
- 1,111,63212.0%Black alone
- 923,54610.0%Asian alone
- 332,2373.6%Two or more races
- 89,8471.0%Other race alone
- 8,5570.09%American Indian alone
- 9340.01%Native Hawaiian and Other
Pacific Islander alone

Income and house value in North Brunswick Township
- Median household income in 2022
- $101,087White non-Hispanic householders
- $82,574Black householders
- $86,204American Indian and Alaska Native householders
- $138,538Asian householders
- $67,023Some other race householders
- $66,362Two or more races householders
- $74,992Hispanic or Latino race householders
- Median 2022 house value
- $486,034White Non-Hispanic householders
- $436,253Black or African American householders
- $529,391Asian householders
- $406,812Some other race householders
- $399,051Two or more races householders
- $395,839Hispanic or Latino householders
Household income for White non-Hispanic householders

Household income for Black householders

Household income for American Indian and Alaska Native householders

Household income for Asian householders

Household income for Two or more races householders

Household income for Hispanic or Latino race householders

Foreign-born residents in North Brunswick Township
8,863 residents are foreign born (12.0% Asia, 5.5% Latin America, 4.5% Europe).
| This city: | 24.4% |
| New Jersey: | 17.5% |
Ancestries in North Brunswick Township

- 13,69633.9%Other
- 6,13915.2%Italian
- 4,50711.1%Irish
- 3,1647.8%German
- 2,4536.1%Polish
- 1,5813.9%Hungarian
- 1,4323.5%English
- 1,1262.8%Russian
- 1,0272.5%United States
- 8092.0%Arab
- 7151.8%Subsaharan African
- 6511.6%West Indian
- 5071.3%French
- 3540.9%Dutch
- 3370.8%Ukrainian
- 2790.7%Greek
- 2440.6%Scottish
- 2290.6%Slovak
- 2260.6%Scotch-Irish
- 1870.5%Portuguese
- 1510.4%Danish
- 1430.4%Lithuanian
- 1310.3%Norwegian
- 1180.3%Swedish
- 910.2%French Canadian
- 880.2%Czech
- 640.2%Welsh
- 80.02%Swiss

Zip codes: 08902.