Races in North Bethesda, Maryland (MD) Detailed Stats
Data:
Races - White alone (%)
Races - White alone (% change since 2000)
Races - Black alone (%)
Races - Black alone (% change since 2000)
Races - American Indian alone (%)
Races - American Indian alone (% change since 2000)
Races - Asian alone (%)
Races - Asian alone (% change since 2000)
Races - Hispanic (%)
Races - Hispanic (% change since 2000)
Races - Native Hawaiian and Other Pacific Islander alone (%)
Races - Native Hawaiian and Other Pacific Islander alone (% change since 2000)
Races - Two or more races(%)
Races - Two or more races(% change since 2000)
Races - Other race alone (%)
Races - Other race alone (% change since 2000)
Racial diversity
Place of birth - Born in state of residence (%)
Place of birth - Born in state of residence (%) - White
Place of birth - Born in state of residence (%) - Black or African American
Place of birth - Born in state of residence (%) - Asian
Place of birth - Born in state of residence (%) - Hispanic or Latino
Place of birth - Born in state of residence (%) - American Indian and Alaska Native
Place of birth - Born in state of residence (%) - Multirace
Place of birth - Born in state of residence (%) - Other Race
Place of birth - Born in other state (%)
Place of birth - Born in other state (%) - White
Place of birth - Born in other state (%) - Black or African American
Place of birth - Born in other state (%) - Asian
Place of birth - Born in other state (%) - Hispanic or Latino
Place of birth - Born in other state (%) - American Indian and Alaska Native
Place of birth - Born in other state (%) - Multirace
Place of birth - Born in other state (%) - Other Race
Place of birth - Native, outside of US (%)
Place of birth - Native, outside of US (%) - White
Place of birth - Native, outside of US (%) - Black or African American
Place of birth - Native, outside of US (%) - Asian
Place of birth - Native, outside of US (%) - Hispanic or Latino
Place of birth - Native, outside of US (%) - American Indian and Alaska Native
Place of birth - Native, outside of US (%) - Multirace
Place of birth - Native, outside of US (%) - Other Race
Place of birth - Foreign born (%)
Place of birth - Foreign born (%) - White
Place of birth - Foreign born (%) - Black or African American
Place of birth - Foreign born (%) - Asian
Place of birth - Foreign born (%) - Hispanic or Latino
Place of birth - Foreign born (%) - American Indian and Alaska Native
Place of birth - Foreign born (%) - Multirace
Place of birth - Foreign born (%) - Other Race
Residents speaking English at home (%)
Residents speaking English at home - Born in the United States (%)
Residents speaking English at home - Native, born elsewhere (%)
Residents speaking English at home - Foreign born (%)
Residents speaking Spanish at home (%)
Residents speaking Spanish at home - Born in the United States (%)
Residents speaking Spanish at home - Native, born elsewhere (%)
Residents speaking Spanish at home - Foreign born (%)
Residents speaking other language at home (%)
Residents speaking other language at home - Born in the United States (%)
Residents speaking other language at home - Native, born elsewhere (%)
Residents speaking other language at home - Foreign born (%)
Marital status - Never married (%)
Marital status - Now married (%)
Marital status - Separated (%)
Marital status - Widowed (%)
Marital status - Divorced (%)
Ancestries Reported - Arab (%)
Ancestries Reported - Czech (%)
Ancestries Reported - Danish (%)
Ancestries Reported - Dutch (%)
Ancestries Reported - English (%)
Ancestries Reported - French (%)
Ancestries Reported - French Canadian (%)
Ancestries Reported - German (%)
Ancestries Reported - Greek (%)
Ancestries Reported - Hungarian (%)
Ancestries Reported - Irish (%)
Ancestries Reported - Italian (%)
Ancestries Reported - Lithuanian (%)
Ancestries Reported - Norwegian (%)
Ancestries Reported - Polish (%)
Ancestries Reported - Portuguese (%)
Ancestries Reported - Russian (%)
Ancestries Reported - Scotch-Irish (%)
Ancestries Reported - Scottish (%)
Ancestries Reported - Slovak (%)
Ancestries Reported - Subsaharan African (%)
Ancestries Reported - Swedish (%)
Ancestries Reported - Swiss (%)
Ancestries Reported - Ukrainian (%)
Ancestries Reported - United States (%)
Ancestries Reported - Welsh (%)
Ancestries Reported - West Indian (%)
Ancestries Reported - Other (%)
Geographical mobility - Same house 1 year ago (%)
Geographical mobility - Same house 1 year ago (%) - White
Geographical mobility - Same house 1 year ago (%) - Black or African American
Geographical mobility - Same house 1 year ago (%) - Asian
Geographical mobility - Same house 1 year ago (%) - Hispanic or Latino
Geographical mobility - Same house 1 year ago (%) - American Indian and Alaska Native
Geographical mobility - Same house 1 year ago (%) - Multirace
Geographical mobility - Same house 1 year ago (%) - Other Race
Geographical mobility - Moved within same county (%)
Geographical mobility - Moved within same county (%) - White
Geographical mobility - Moved within same county (%) - Black or African American
Geographical mobility - Moved within same county (%) - Asian
Geographical mobility - Moved within same county (%) - Hispanic or Latino
Geographical mobility - Moved within same county (%) - American Indian and Alaska Native
Geographical mobility - Moved within same county (%) - Multirace
Geographical mobility - Moved within same county (%) - Other Race
Geographical mobility - Moved from different county within same state (%)
Geographical mobility - Moved from different county within same state (%) - White
Geographical mobility - Moved from different county within same state (%) - Black or African American
Geographical mobility - Moved from different county within same state (%) - Asian
Geographical mobility - Moved from different county within same state (%) - Hispanic or Latino
Geographical mobility - Moved from different county within same state (%) - American Indian and Alaska Native
Geographical mobility - Moved from different county within same state (%) - Multirace
Geographical mobility - Moved from different county within same state (%) - Other Race
Geographical mobility - Moved from different state (%)
Geographical mobility - Moved from different state (%) - White
Geographical mobility - Moved from different state (%) - Black or African American
Geographical mobility - Moved from different state (%) - Asian
Geographical mobility - Moved from different state (%) - Hispanic or Latino
Geographical mobility - Moved from different state (%) - American Indian and Alaska Native
Geographical mobility - Moved from different state (%) - Multirace
Geographical mobility - Moved from different state (%) - Other Race
Geographical mobility - Moved from abroad (%)
Geographical mobility - Moved from abroad (%) - White
Geographical mobility - Moved from abroad (%) - Black or African American
Geographical mobility - Moved from abroad (%) - Asian
Geographical mobility - Moved from abroad (%) - Hispanic or Latino
Geographical mobility - Moved from abroad (%) - American Indian and Alaska Native
Geographical mobility - Moved from abroad (%) - Multirace
Geographical mobility - Moved from abroad (%) - Other Race
Place of birth for the foreign-born population - Ireland (%)
Place of birth for the foreign-born population - Denmark (%)
Place of birth for the foreign-born population - Norway (%)
Place of birth for the foreign-born population - Sweden (%)
Place of birth for the foreign-born population - United Kingdom (%)
Place of birth for the foreign-born population - England (%)
Place of birth for the foreign-born population - Scotland (%)
Place of birth for the foreign-born population - Other Northern Europe (%)
Place of birth for the foreign-born population - Austria (%)
Place of birth for the foreign-born population - Belgium (%)
Place of birth for the foreign-born population - France (%)
Place of birth for the foreign-born population - Germany (%)
Place of birth for the foreign-born population - Netherlands (%)
Place of birth for the foreign-born population - Switzerland (%)
Place of birth for the foreign-born population - Other Western Europe (%)
Place of birth for the foreign-born population - Greece (%)
Place of birth for the foreign-born population - Italy (%)
Place of birth for the foreign-born population - Portugal (%)
Place of birth for the foreign-born population - Spain (%)
Place of birth for the foreign-born population - Other Southern Europe (%)
Place of birth for the foreign-born population - Albania (%)
Place of birth for the foreign-born population - Belarus (%)
Place of birth for the foreign-born population - Bosnia and Herzegovina (%)
Place of birth for the foreign-born population - Bulgaria (%)
Place of birth for the foreign-born population - Croatia (%)
Place of birth for the foreign-born population - Czechoslovakia (%)
Place of birth for the foreign-born population - Hungary (%)
Place of birth for the foreign-born population - Latvia (%)
Place of birth for the foreign-born population - Lithuania (%)
Place of birth for the foreign-born population - North Macedonia (Macedonia) (%)
Place of birth for the foreign-born population - Moldova (%)
Place of birth for the foreign-born population - Poland (%)
Place of birth for the foreign-born population - Romania (%)
Place of birth for the foreign-born population - Russia (%)
Place of birth for the foreign-born population - Serbia (%)
Place of birth for the foreign-born population - Ukraine (%)
Place of birth for the foreign-born population - Other Eastern Europe (%)
Place of birth for the foreign-born population - China (%)
Place of birth for the foreign-born population - Hong Kong (%)
Place of birth for the foreign-born population - Taiwan (%)
Place of birth for the foreign-born population - Japan (%)
Place of birth for the foreign-born population - Korea (%)
Place of birth for the foreign-born population - Other Eastern Asia (%)
Place of birth for the foreign-born population - Afghanistan (%)
Place of birth for the foreign-born population - Bangladesh (%)
Place of birth for the foreign-born population - India (%)
Place of birth for the foreign-born population - Iran (%)
Place of birth for the foreign-born population - Kazakhstan (%)
Place of birth for the foreign-born population - Nepal (%)
Place of birth for the foreign-born population - Pakistan (%)
Place of birth for the foreign-born population - Sri Lanka (%)
Place of birth for the foreign-born population - Uzbekistan (%)
Place of birth for the foreign-born population - Other South Central Asia (%)
Place of birth for the foreign-born population - Burma (%)
Place of birth for the foreign-born population - Cambodia (%)
Place of birth for the foreign-born population - Indonesia (%)
Place of birth for the foreign-born population - Laos (%)
Place of birth for the foreign-born population - Malaysia (%)
Place of birth for the foreign-born population - Philippines (%)
Place of birth for the foreign-born population - Singapore (%)
Place of birth for the foreign-born population - Thailand (%)
Place of birth for the foreign-born population - Vietnam (%)
Place of birth for the foreign-born population - Other South Eastern Asia (%)
Place of birth for the foreign-born population - Armenia (%)
Place of birth for the foreign-born population - Iraq (%)
Place of birth for the foreign-born population - Israel (%)
Place of birth for the foreign-born population - Jordan (%)
Place of birth for the foreign-born population - Kuwait (%)
Place of birth for the foreign-born population - Lebanon (%)
Place of birth for the foreign-born population - Saudi Arabia (%)
Place of birth for the foreign-born population - Syria (%)
Place of birth for the foreign-born population - Turkey (%)
Place of birth for the foreign-born population - Yemen (%)
Place of birth for the foreign-born population - Other Western Asia (%)
Place of birth for the foreign-born population - Eritrea (%)
Place of birth for the foreign-born population - Ethiopia (%)
Place of birth for the foreign-born population - Kenya (%)
Place of birth for the foreign-born population - Somalia (%)
Place of birth for the foreign-born population - Uganda (%)
Place of birth for the foreign-born population - Zimbabwe (%)
Place of birth for the foreign-born population - Other Eastern Africa (%)
Place of birth for the foreign-born population - Cameroon (%)
Place of birth for the foreign-born population - Congo (%)
Place of birth for the foreign-born population - Democratic Republic of Congo (Zaire) (%)
Place of birth for the foreign-born population - Other Middle Africa (%)
Place of birth for the foreign-born population - Egypt (%)
Place of birth for the foreign-born population - Morocco (%)
Place of birth for the foreign-born population - Sudan (%)
Place of birth for the foreign-born population - Other Northern Africa (%)
Place of birth for the foreign-born population - South Africa (%)
Place of birth for the foreign-born population - Other Southern Africa (%)
Place of birth for the foreign-born population - Cabo Verde (%)
Place of birth for the foreign-born population - Ghana (%)
Place of birth for the foreign-born population - Liberia (%)
Place of birth for the foreign-born population - Nigeria (%)
Place of birth for the foreign-born population - Senegal (%)
Place of birth for the foreign-born population - Sierra Leone (%)
Place of birth for the foreign-born population - Other Western Africa (%)
Place of birth for the foreign-born population - Australia (%)
Place of birth for the foreign-born population - New Zealand (%)
Place of birth for the foreign-born population - Fiji (%)
Place of birth for the foreign-born population - Micronesia (%)
Place of birth for the foreign-born population - Bahamas (%)
Place of birth for the foreign-born population - Barbados (%)
Place of birth for the foreign-born population - Cuba (%)
Place of birth for the foreign-born population - Dominica (%)
Place of birth for the foreign-born population - Dominican Republic (%)
Place of birth for the foreign-born population - Grenada (%)
Place of birth for the foreign-born population - Haiti (%)
Place of birth for the foreign-born population - Jamaica (%)
Place of birth for the foreign-born population - St. Vincent and the Grenadines (%)
Place of birth for the foreign-born population - Trinidad and Tobago (%)
Place of birth for the foreign-born population - West Indies (%)
Place of birth for the foreign-born population - Other Caribbean (%)
Place of birth for the foreign-born population - Belize (%)
Place of birth for the foreign-born population - Costa Rica (%)
Place of birth for the foreign-born population - El Salvador (%)
Place of birth for the foreign-born population - Guatemala (%)
Place of birth for the foreign-born population - Honduras (%)
Place of birth for the foreign-born population - Mexico (%)
Place of birth for the foreign-born population - Nicaragua (%)
Place of birth for the foreign-born population - Panama (%)
Place of birth for the foreign-born population - Other Central America (%)
Place of birth for the foreign-born population - Argentina (%)
Place of birth for the foreign-born population - Bolivia (%)
Place of birth for the foreign-born population - Brazil (%)
Place of birth for the foreign-born population - Chile (%)
Place of birth for the foreign-born population - Colombia (%)
Place of birth for the foreign-born population - Ecuador (%)
Place of birth for the foreign-born population - Guyana (%)
Place of birth for the foreign-born population - Peru (%)
Place of birth for the foreign-born population - Uruguay (%)
Place of birth for the foreign-born population - Venezuela (%)
Place of birth for the foreign-born population - Other South America (%)
Place of birth for the foreign-born population - Canada (%)
Place of birth for the foreign-born population - Other Northern America (%)
Place of birth for the foreign-born population - Other (%)
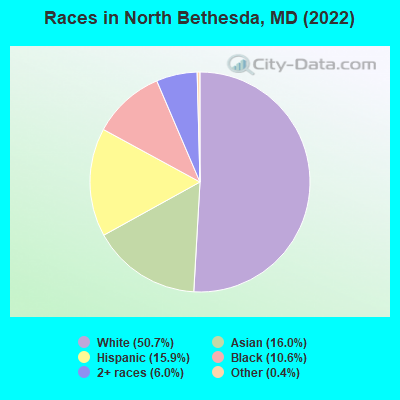
According to 2022 data, the most numerous races in North Bethesda, MD are White alone (25,136 residents), Black alone (5,231 residents), and Hispanic (7,863 residents). 61.4% of North Bethesda residents speak English at home. 32.9% of North Bethesda, MD residents are foreign-born (13.7% born in Asia, 8.9% born in Latin America, 5.9% born in Europe), which is 51.4% greater than the foreign-born rate of 16.0% across the entire state of Maryland.
Race distribution in North Bethesda
2000 2022
3,286,547 62.1% White alone 1,464,735 27.7% Black alone 227,916 4.3% Hispanic 209,738 4.0% Asian alone 82,946 1.6% Two or more races 13,312 0.3% American Indian alone 9,379 0.2% Other race alone 1,913 0.04% Native Hawaiian and Other
2,906,492 47.1% White alone 1,800,914 29.2% Black alone 705,842 11.4% Hispanic 401,818 6.5% Asian alone 291,317 4.7% Two or more races 46,930 0.8% Other race alone 8,930 0.1% American Indian alone 2,417 0.04% Native Hawaiian and Other
Income and house value in North Bethesda Median household income in 2022 $135,539 White non-Hispanic householders$97,916 Black householders$116,642 Asian householders$47,261 Some other race householders$118,787 Two or more races householders$115,013 Hispanic or Latino race householdersMedian 2022 house value $915,808 White Non-Hispanic householders$847,091 Black or African American householdersover $1,000,000 American Indian or Alaska Native householders $783,059 Asian householders$638,754 Some other race householders$905,813 Two or more races householders$804,924 Hispanic or Latino householders
Median age by race in North Bethesda
45.0 Median age for White residents44.0 45.9 40.9 Median age for Black or African American residents42.5 40.0 37.6 Median age for American Indian / Alaska Native residents33.3 51.5 39.9 Median age for Asian residents36.0 42.4 -763,333,332.6 Median age for Native Hawaiian / Pacific Islander residents-720,061,021.4 -760,942,760.2 31.8 Median age for Other race residents28.5 33.3 37.6 Median age for Two or more races residents35.0 45.1 45.0 Median age for White alone residents44.0 47.6 36.8 Median age for Hispanic or Latino residents34.4 37.3
Owner/renter occupied households by race in North Bethesda
House owners and renters - White residents 7,460 57.8% Owner occupied5,447 42.2% Renter occupiedHouse owners and renters - Black or African American residents 597 24.2% Owner occupied1,867 75.8% Renter occupiedHouse owners and renters - American Indian / Alaska Native residents 34 35.8% Owner occupied60 64.2% Renter occupiedHouse owners and renters - Asian residents 1,652 54.0% Owner occupied1,406 46.0% Renter occupiedHouse owners and renters - Native Hawaiian / Pacific Islander residents 2 100.0% Renter occupiedHouse owners and renters - Other race residents 223 34.1% Owner occupied432 65.9% Renter occupiedHouse owners and renters - Two or more races residents 697 30.0% Owner occupied1,623 70.0% Renter occupiedHouse owners and renters - White alone residents 7,397 59.0% Owner occupied5,147 41.0% Renter occupiedHouse owners and renters - Hispanic or Latino residents 764 27.7% Owner occupied1,997 72.3% Renter occupied
Language usage in North Bethesda
English speakers - Total 61.4% of residents of North Bethesda speak English at home.
12.7% of residents speak Spanish at home 3,706 61.6% Speak English very well2,310 38.4% Speak English less than very well25.7% of residents speak other language at home 8,529 69.8% Speak English very well3,694 30.2% Speak English less than very well
English speakers - Born in the United States 88.6% of residents of North Bethesda speak English at home.
5.1% of residents speak Spanish at home 951 88.5% Speak English very well123 11.5% Speak English less than very well6.5% of residents speak other language at home 1,294 95.0% Speak English very well68 5.0% Speak English less than very well
English speakers - Native, born elsewhere 55.1% of residents of North Bethesda speak English at home.
28.2% of residents speak Spanish at home 225 86.2% Speak English very well36 13.8% Speak English less than very well17.4% of residents speak other language at home 67 41.6% Speak English very well94 58.4% Speak English less than very well
English speakers - Foreign-born 15.3% of residents of North Bethesda speak English at home.
22.9% of residents speak Spanish at home 1,590 43.0% Speak English very well2,105 57.0% Speak English less than very well61.6% of residents speak other language at home 6,578 66.2% Speak English very well3,361 33.8% Speak English less than very well
White (Caucasian) - Speak only English Native:
92.2% (18,923)Foreign-born:
16.8% (785)
White (Caucasian) - Speak another language Native:
7.7% (1,576)Foreign-born:
82.1% (3,842)
Black or African American - Speak only English Native:
90.4% (3,370)Foreign-born:
23.9% (357)
Black or African American - Speak another language Native:
9.3% (345)Foreign-born:
75.6% (1,130)
American Indian / Alaska Native - Speak another language Native:
27.8% (16)Foreign-born:
100.0% (107)
Asian - Speak only English Native:
64.3% (1,275)Foreign-born:
20.3% (1,109)
Asian - Speak another language Native:
32.2% (639)Foreign-born:
80.1% (4,374)
Other race - Speak only English Native:
11.9% (99)Foreign-born:
0.9% (12)
Other race - Speak another language Native:
84.9% (709)Foreign-born:
99.7% (1,347)
Two or more races - Speak only English Native:
72.8% (2,957)Foreign-born:
13.6% (308)
Two or more races - Speak another language Native:
25.3% (1,028)Foreign-born:
86.5% (1,960)
White alone - Speak only English Native:
93.5% (18,463)Foreign-born:
15.5% (734)
White alone - Speak another language Native:
6.4% (1,271)Foreign-born:
85.3% (4,044)
Hispanic or Latino - Speak only English Native:
46.5% (1,680)Foreign-born:
3.0% (114)
Hispanic or Latino - Speak another language Native:
55.0% (1,990)Foreign-born:
97.1% (3,690)
Foreign-born residents in North Bethesda 16,311 residents are foreign born (13.7% Asia , 8.9% Latin America , 5.9% Europe ).
This city:
32.9%Maryland:
15.7%
Marital status for residents in North Bethesda Marital status - White (Caucasian) population 15 years and over
Males 31.1% Never married54.8% Now married1.7% Separated3.4% Widowed8.9% DivorcedFemales 33.1% Never married45.8% Now married1.2% Separated8.5% Widowed11.5% DivorcedWomen who gave birth in the past 12 months Now married:
68.5% (140)Unmarried:
31.5% (64)
Women who did not give birth in the past 12 months Now married:
40.1% (2,240)Unmarried:
59.9% (3,344)
Marital status - Black or African American population 15 years and over
Males 46.0% Never married37.6% Now married4.6% Separated0.0% Widowed11.8% DivorcedFemales 42.2% Never married35.1% Now married1.7% Separated9.0% Widowed12.0% DivorcedWomen who gave birth in the past 12 months Now married:
100.0% (35)Unmarried:
0.0% (0)
Women who did not give birth in the past 12 months Now married:
27.9% (367)Unmarried:
72.1% (948)
Marital status - American Indian / Alaska Native population 15 years and over
Males 57.6% Never married42.4% Now married0.0% Separated0.0% Widowed0.0% DivorcedFemales 25.9% Never married14.8% Now married21.0% Separated0.0% Widowed38.3% DivorcedWomen who did not give birth in the past 12 months Now married:
36.4% (18)Unmarried:
63.6% (31)
Marital status - Asian population 15 years and over
Males 34.5% Never married59.9% Now married1.1% Separated0.9% Widowed3.5% DivorcedFemales 24.8% Never married54.0% Now married3.4% Separated8.8% Widowed9.1% DivorcedWomen who gave birth in the past 12 months Now married:
100.0% (102)Unmarried:
0.0% (0)
Women who did not give birth in the past 12 months Now married:
52.1% (1,180)Unmarried:
47.9% (1,086)
Marital status - Other race population 15 years and over
Males 34.0% Never married58.2% Now married5.7% Separated0.0% Widowed2.2% DivorcedFemales 23.9% Never married46.0% Now married2.3% Separated3.5% Widowed24.2% DivorcedWomen who gave birth in the past 12 months Now married:
81.5% (54)Unmarried:
18.5% (12)
Women who did not give birth in the past 12 months Now married:
50.4% (374)Unmarried:
49.6% (368)
Marital status - Two or more races population 15 years and over
Males 46.9% Never married32.5% Now married0.6% Separated0.0% Widowed20.0% DivorcedFemales 28.3% Never married63.1% Now married1.4% Separated3.8% Widowed3.4% DivorcedWomen who gave birth in the past 12 months Now married:
80.2% (80)Unmarried:
19.8% (20)
Women who did not give birth in the past 12 months Now married:
56.1% (714)Unmarried:
43.9% (558)
Marital status - White alone, not Hispanic / Latino population 15 years and over
Males 30.3% Never married55.1% Now married1.3% Separated3.7% Widowed9.5% DivorcedFemales 33.1% Never married44.9% Now married1.2% Separated9.1% Widowed11.6% DivorcedWomen who gave birth in the past 12 months Now married:
75.1% (132)Unmarried:
24.9% (44)
Women who did not give birth in the past 12 months Now married:
38.8% (2,065)Unmarried:
61.2% (3,261)
Marital status - Hispanic or Latino population 15 years and over
Males 40.1% Never married42.1% Now married3.4% Separated0.5% Widowed13.8% DivorcedFemales 27.3% Never married56.9% Now married1.2% Separated1.7% Widowed12.9% DivorcedWomen who gave birth in the past 12 months Now married:
63.5% (66)Unmarried:
36.5% (38)
Women who did not give birth in the past 12 months Now married:
52.6% (1,022)Unmarried:
47.4% (920)
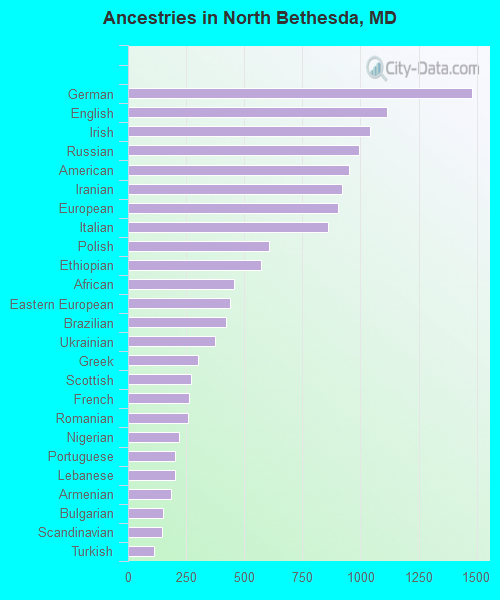
Ancestries in North Bethesda
1,479 4.9% German1,113 3.7% English1,041 3.5% Irish993 3.3% Russian952 3.2% American922 3.1% Iranian904 3.0% European859 2.9% Italian605 2.0% Polish573 1.9% Ethiopian458 1.5% African437 1.5% Eastern European421 1.4% Brazilian374 1.2% Ukrainian299 1.0% Greek270 0.9% Scottish263 0.9% French257 0.9% Romanian218 0.7% Nigerian204 0.7% Portuguese201 0.7% Lebanese186 0.6% Armenian151 0.5% Bulgarian148 0.5% Scandinavian110 0.4% Turkish92 0.3% Slovak92 0.3% Jamaican90 0.3% Egyptian90 0.3% British82 0.3% Iraqi79 0.3% Scotch-Irish72 0.2% Dutch70 0.2% Austrian70 0.2% Sudanese68 0.2% Lithuanian65 0.2% Finnish57 0.2% Israeli57 0.2% Hungarian53 0.2% Welsh52 0.2% Trinidadian and Tobagonian47 0.2% Serbian47 0.2% Swedish45 0.2% Croatian44 0.1% Arab37 0.1% Northern European37 0.1% Ghanaian28 0.09% Jordanian28 0.09% Zimbabwean28 0.09% Haitian24 0.08% Czech24 0.08% Norwegian21 0.07% Moroccan21 0.07% Slavic20 0.07% French Canadian19 0.06% Latvian16 0.05% Kenyan16 0.05% Albanian16 0.05% Bahamian15 0.05% Belgian13 0.04% West Indian10 0.03% Czechoslovakian9 0.03% U.S. Virgin Islander8 0.03% Syrian8 0.03% Danish7 0.02% Palestinian7 0.02% Guyanese6 0.02% Swiss6 0.02% Senegalese2 0.01% Canadian
Geographical mobility in North Bethesda Same house 1 year ago 22,318 86.0% White (Caucasian)4,062 76.4% Black or African American189 98.9% American Indian / Alaska Native6,050 77.8% Asian2 100.0% Native Hawaiian / Pacific Islander2,047 85.8% Other race5,616 85.9% Two or more races21,426 86.0% White alone, not Hispanic / Latino6,600 84.9% Hispanic or LatinoMoved within same county 1,592 6.1% White / Caucasian313 5.9% Black or African American800 10.3% Asian117 4.9% Other race332 5.1% Two or more races1,534 6.2% White alone, not Hispanic / Latino410 5.3% Hispanic or LatinoMoved within same state 270 1.0% White / Caucasian596 11.2% Black or African American41 0.5% Asian42 1.7% Other race65 1.0% Two or more races260 1.0% White alone, not Hispanic / Latino159 2.1% Hispanic or LatinoMoved from different state 1,425 5.5% White / Caucasian262 4.9% Black or African American424 5.5% Asian6 0.3% Other race271 4.1% Two or more races1,427 5.7% White alone, not Hispanic / Latino268 3.5% Hispanic or LatinoMoved from abroad 203 0.8% White85 1.6% Black or African American508 6.5% Asian121 5.1% Other race93 1.4% Two or more races135 0.5% White alone, not Hispanic / Latino265 3.4% Hispanic or Latino
Children Nativity (place of birth) in North Bethesda
Children under 6 years - Living with two parents Both parents native 741 100.0% NativeBoth parents foreign-born 717 71.4% Native287 28.6% Foreign-bornOne native, one foreign-born parent 324 100.0% NativeChildren under 6 years - Living with one parent Native parent 195 100.0% NativeForeign-born parent 301 95.3% Native15 4.7% Foreign-bornChildren 6 to 17 years - Living with two parents Both parents native 2,058 99.6% Native8 0.4% Foreign-bornBoth parents foreign-born 992 55.3% Native802 44.7% Foreign-bornOne native, one foreign-born parent 850 96.6% Native30 3.4% Foreign-bornChildren 6 to 17 years - Living with one parent Native parent 441 100.0% NativeForeign-born parent 1,144 54.4% Native960 45.6% Foreign-born
Place of birth for residents in North Bethesda 7,084 Asia4,680 Americas4,605 Latin America3,059 Europe2,788 Eastern Asia2,187 Central America2,159 South Central Asia1,913 South America1,829 Eastern Europe1,486 Africa1,364 South Eastern Asia1,303 China719 Western Asia714 Western Europe561 Western Africa504 Caribbean390 Eastern Africa312 Northern Africa259 Northern Europe256 Southern Europe162 Middle Africa74 Northern America42 Southern Africa910 El Salvador860 India795 Japan785 China774 Philippines689 Korea631 Iran566 Russia478 Peru466 Brazil450 Costa Rica423 Taiwan368 Bolivia364 Honduras340 Vietnam312 Ukraine297 Colombia287 France285 Ethiopia284 Germany240 Moldova217 Mexico200 Nigeria192 Bangladesh170 Argentina149 Ghana138 Cameroon136 United Kingdom133 Pakistan117 Trinidad and Tobago117 Israel117 Nicaragua115 Lebanon111 Haiti110 Serbia108 Czechoslovakia101 Cuba101 Morocco98 Bulgaria95 Senegal94 Hong Kong93 Sri Lanka92 Italy91 Venezuela90 Guatemala88 Egypt88 Jamaica88 Armenia87 Georgia77 Spain75 Netherlands75 Burma (Myanmar)74 Canada74 Turkey68 Dominican Republic67 Jordan61 Algeria61 Sudan60 Portugal60 Iraq56 Laos40 Ireland37 Kenya36 Panama36 Indonesia33 Zimbabwe33 Poland31 Kazakhstan31 Norway31 Cambodia30 Nepal29 England29 Malaysia25 Austria25 Switzerland24 Latvia23 Eritrea22 South Africa22 Sweden22 Azerbaijan20 Romania20 Thailand19 Saudi Arabia19 United Arab Emirates18 Kuwait16 Hungary16 Chile15 Uruguay14 Belgium13 Greece10 Dominica10 Liberia10 Congo9 Albania8 Syria8 Guyana7 Bahamas7 Tanzania7 Sierra Leone3 Uganda2 Uzbekistan
Grandparents responsible for own grandchildren in North Bethesda
Grandparents (30 to 59 years) White / Caucasian 87 100.0% Not responsible for grandchildrenTwo or more races 9 100.0% Not responsible for grandchildrenHispanic or Latino 96 100.0% Not responsible for grandchildrenGrandparents (60 years and over) White / Caucasian 52 22.2% Responsible for grandchildren183 77.8% Not responsible for grandchildrenTwo or more races 10 100.0% Responsible for grandchildrenHispanic or Latino 1 13.1% Responsible for grandchildren10 86.9% Not responsible for grandchildren