Races in North Atlanta, Georgia (GA) Detailed Stats
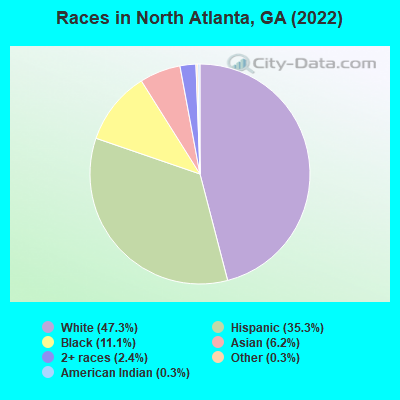
According to 2022 data, the most numerous races in North Atlanta, GA are White alone (20,036 residents), Black alone (4,712 residents), and Hispanic (14,952 residents). 57.6% of North Atlanta residents speak English at home. 28.1% of North Atlanta, GA residents are foreign-born (19.6% born in Latin America, 3.1% born in Asia), which is 64.4% greater than the foreign-born rate of 10.0% across the entire state of Georgia.
Race distribution in North Atlanta
2000 2022
5,128,661 62.6% White alone 2,331,465 28.5% Black alone 435,227 5.3% Hispanic 171,513 2.1% Asian alone 87,364 1.1% Two or more races 17,670 0.2% American Indian alone 11,275 0.1% Other race alone 3,278 0.04% Native Hawaiian and Other
5,415,657 49.6% White alone 3,349,240 30.7% Black alone 1,132,604 10.4% Hispanic 479,156 4.4% Asian alone 462,923 4.2% Two or more races 54,416 0.5% Other race alone 11,923 0.1% American Indian alone 6,957 0.06% Native Hawaiian and Other
Income and house value in North Atlanta Median household income in 2022 $124,477 White non-Hispanic householders$65,875 Black householders$46,377 American Indian and Alaska Native householders$120,171 Asian householders$46,768 Some other race householders$115,671 Two or more races householders$46,185 Hispanic or Latino race householdersMedian 2022 house value $682,502 White Non-Hispanic householders$353,782 Black or African American householders$375,152 American Indian or Alaska Native householders $606,786 Asian householdersover $1,000,000 Native Hawaiian and other Pacific Islander householders$403,381 Some other race householders$744,236 Two or more races householders$427,916 Hispanic or Latino householders
Median age by race in North Atlanta
33.7 Median age for White residents34.1 33.5 31.9 Median age for Black or African American residents30.0 32.8 17.5 Median age for American Indian / Alaska Native residents18.9 15.5 29.5 Median age for Asian residents28.4 37.1 34.9 Median age for Other race residents38.8 31.2 42.8 Median age for Two or more races residents70.5 35.3 36.3 Median age for White alone residents37.6 35.0 28.3 Median age for Hispanic or Latino residents28.6 28.5
Owner/renter occupied households by race in North Atlanta
House owners and renters - White residents 5,858 51.7% Owner occupied5,478 48.3% Renter occupiedHouse owners and renters - Black or African American residents 533 19.1% Owner occupied2,256 80.9% Renter occupiedHouse owners and renters - American Indian / Alaska Native residents 124 100.0% Renter occupiedHouse owners and renters - Asian residents 277 39.9% Owner occupied418 60.1% Renter occupiedHouse owners and renters - Native Hawaiian / Pacific Islander residents 12 100.0% Owner occupiedHouse owners and renters - Other race residents 336 23.8% Owner occupied1,076 76.2% Renter occupiedHouse owners and renters - Two or more races residents 119 11.4% Owner occupied923 88.6% Renter occupiedHouse owners and renters - White alone residents 5,489 58.6% Owner occupied3,875 41.4% Renter occupiedHouse owners and renters - Hispanic or Latino residents 918 23.0% Owner occupied3,079 77.0% Renter occupied
Language usage in North Atlanta
English speakers - Total 57.6% of residents of North Atlanta speak English at home.
30.6% of residents speak Spanish at home 5,082 41.6% Speak English very well7,130 58.4% Speak English less than very well10.7% of residents speak other language at home 2,601 61.1% Speak English very well1,656 38.9% Speak English less than very well
English speakers - Born in the United States 91.0% of residents of North Atlanta speak English at home.
7.0% of residents speak Spanish at home 893 88.7% Speak English very well114 11.3% Speak English less than very well2.3% of residents speak other language at home 311 95.4% Speak English very well15 4.6% Speak English less than very well
English speakers - Native, born elsewhere 67.0% of residents of North Atlanta speak English at home.
22.1% of residents speak Spanish at home 81 39.3% Speak English very well125 60.7% Speak English less than very well2.9% of residents speak other language at home 11 40.7% Speak English very well16 59.3% Speak English less than very well
English speakers - Foreign-born 6.7% of residents of North Atlanta speak English at home.
53.8% of residents speak Spanish at home 1,693 22.1% Speak English very well5,960 77.9% Speak English less than very well25.5% of residents speak other language at home 2,183 60.2% Speak English very well1,444 39.8% Speak English less than very well
White (Caucasian) - Speak only English Native:
87.5% (16,951)Foreign-born:
11.9% (494)
White (Caucasian) - Speak another language Native:
12.0% (2,333)Foreign-born:
81.5% (3,381)
Black or African American - Speak only English Native:
94.6% (3,320)Foreign-born:
28.6% (444)
Black or African American - Speak another language Native:
5.6% (198)Foreign-born:
76.0% (1,180)
American Indian / Alaska Native - Speak another language Native:
100.0% (48)Foreign-born:
100.0% (1,025)
Asian - Speak only English Native:
84.0% (367)Foreign-born:
12.4% (213)
Asian - Speak another language Native:
26.7% (117)Foreign-born:
85.0% (1,461)
Other race - Speak another language Native:
84.5% (1,375)Foreign-born:
99.0% (3,191)
Two or more races - Speak only English Native:
71.3% (470)Foreign-born:
26.2% (258)
Two or more races - Speak another language Native:
34.2% (225)Foreign-born:
57.9% (570)
White alone - Speak only English Native:
97.7% (16,609)Foreign-born:
35.8% (526)
White alone - Speak another language Native:
2.3% (394)Foreign-born:
61.3% (900)
Hispanic or Latino - Speak only English Native:
13.1% (723)Foreign-born:
0.1% (11)
Hispanic or Latino - Speak another language Native:
87.0% (4,804)Foreign-born:
99.0% (7,702)
Foreign-born residents in North Atlanta 11,896 residents are foreign born (19.6% Latin America , 3.1% Asia ).
This city:
28.1%Georgia:
100.0%
Marital status for residents in North Atlanta Marital status - White (Caucasian) population 15 years and over
Males 49.7% Never married42.2% Now married0.5% Separated1.0% Widowed6.6% DivorcedFemales 39.1% Never married45.3% Now married1.8% Separated5.2% Widowed8.6% DivorcedWomen who gave birth in the past 12 months Now married:
100.0% (369)Unmarried:
0.0% (0)
Women who did not give birth in the past 12 months Now married:
41.9% (2,733)Unmarried:
58.1% (3,784)
Marital status - Black or African American population 15 years and over
Males 77.5% Never married16.7% Now married0.0% Separated2.3% Widowed3.4% DivorcedFemales 69.6% Never married10.8% Now married1.7% Separated1.9% Widowed16.0% DivorcedWomen who gave birth in the past 12 months Now married:
100.0% (20)Unmarried:
0.0% (0)
Women who did not give birth in the past 12 months Now married:
17.8% (343)Unmarried:
82.2% (1,584)
Marital status - American Indian / Alaska Native population 15 years and over
Males 70.5% Never married29.5% Now married0.0% Separated0.0% Widowed0.0% DivorcedFemales 43.4% Never married56.6% Now married0.0% Separated0.0% Widowed0.0% DivorcedWomen who gave birth in the past 12 months Now married:
100.0% (66)Unmarried:
0.0% (0)
Women who did not give birth in the past 12 months Now married:
0.0% (0)Unmarried:
100.0% (51)
Marital status - Asian population 15 years and over
Males 51.2% Never married47.2% Now married0.0% Separated1.6% Widowed0.0% DivorcedFemales 41.1% Never married56.9% Now married0.0% Separated2.0% Widowed0.0% DivorcedWomen who gave birth in the past 12 months Now married:
100.0% (43)Unmarried:
0.0% (0)
Women who did not give birth in the past 12 months Now married:
49.8% (397)Unmarried:
50.2% (400)
Marital status - Other race population 15 years and over
Males 49.2% Never married44.4% Now married1.2% Separated1.0% Widowed4.1% DivorcedFemales 34.8% Never married58.8% Now married1.0% Separated3.6% Widowed1.8% DivorcedWomen who gave birth in the past 12 months Now married:
100.0% (62)Unmarried:
0.0% (0)
Women who did not give birth in the past 12 months Now married:
54.8% (759)Unmarried:
45.2% (625)
Marital status - Two or more races population 15 years and over
Males 59.0% Never married31.9% Now married0.0% Separated0.0% Widowed9.0% DivorcedFemales 26.9% Never married61.3% Now married0.0% Separated11.8% Widowed0.0% DivorcedWomen who gave birth in the past 12 months Now married:
100.0% (76)Unmarried:
0.0% (0)
Women who did not give birth in the past 12 months Now married:
61.9% (187)Unmarried:
38.1% (115)
Marital status - White alone, not Hispanic / Latino population 15 years and over
Males 44.2% Never married46.2% Now married0.7% Separated1.4% Widowed7.4% DivorcedFemales 38.9% Never married44.5% Now married0.7% Separated6.0% Widowed9.9% DivorcedWomen who gave birth in the past 12 months Now married:
100.0% (245)Unmarried:
0.0% (0)
Women who did not give birth in the past 12 months Now married:
39.7% (2,045)Unmarried:
60.3% (3,107)
Marital status - Hispanic or Latino population 15 years and over
Males 60.0% Never married34.5% Now married0.7% Separated1.0% Widowed3.8% DivorcedFemales 41.5% Never married48.5% Now married4.6% Separated3.0% Widowed2.5% DivorcedWomen who gave birth in the past 12 months Now married:
100.0% (242)Unmarried:
0.0% (0)
Women who did not give birth in the past 12 months Now married:
49.4% (1,742)Unmarried:
50.6% (1,783)
Ancestries in North Atlanta
1,755 6.5% English1,338 5.0% American1,120 4.2% Irish912 3.4% European797 3.0% German708 2.6% Ethiopian399 1.5% Italian357 1.3% British321 1.2% Nigerian316 1.2% Polish306 1.1% Russian220 0.8% Scottish184 0.7% Scotch-Irish184 0.7% African166 0.6% Ghanaian160 0.6% French157 0.6% Brazilian141 0.5% Welsh132 0.5% Canadian125 0.5% West Indian106 0.4% Eastern European91 0.3% Norwegian69 0.3% Hungarian68 0.3% Dutch67 0.2% Swedish50 0.2% Greek49 0.2% Austrian45 0.2% Iranian42 0.2% Lebanese42 0.2% Jamaican41 0.2% Slavic40 0.1% Australian35 0.1% French Canadian29 0.1% Bulgarian27 0.1% Romanian25 0.09% Belgian24 0.09% Turkish24 0.09% New Zealander23 0.09% Maltese21 0.08% Slovak21 0.08% South African20 0.07% Cajun20 0.07% Ukrainian18 0.07% Czech15 0.06% Scandinavian14 0.05% Danish13 0.05% Swiss11 0.04% Arab11 0.04% Latvian9 0.03% Yugoslavian8 0.03% British West Indian
Geographical mobility in North Atlanta Same house 1 year ago 22,395 84.3% White (Caucasian)3,903 80.8% Black or African American607 100.0% American Indian / Alaska Native1,814 80.8% Asian16 88.3% Native Hawaiian / Pacific Islander5,729 92.0% Other race1,415 83.6% Two or more races15,872 82.2% White alone, not Hispanic / Latino16,546 97.0% Hispanic or LatinoMoved within same county 1,448 5.4% White / Caucasian306 6.3% Black or African American52 2.3% Asian261 4.2% Other race125 7.4% Two or more races1,035 5.4% White alone, not Hispanic / Latino511 3.0% Hispanic or LatinoMoved within same state 1,661 6.2% White / Caucasian346 7.2% Black or African American156 6.9% Asian263 4.2% Other race87 5.2% Two or more races1,474 7.6% White alone, not Hispanic / Latino472 2.8% Hispanic or LatinoMoved from different state 729 2.7% White / Caucasian140 2.9% Black or African American166 7.4% Asian6 0.1% Other race658 3.4% White alone, not Hispanic / Latino116 0.7% Hispanic or LatinoMoved from abroad 89 0.3% White11 0.2% Black or African American22 0.3% Other race89 0.5% White alone, not Hispanic / Latino
Children Nativity (place of birth) in North Atlanta
Children under 6 years - Living with two parents Both parents native 1,136 100.0% NativeBoth parents foreign-born 1,026 95.3% Native51 4.7% Foreign-bornOne native, one foreign-born parent 518 100.0% NativeChildren under 6 years - Living with one parent Native parent 193 100.0% NativeForeign-born parent 619 100.0% NativeChildren 6 to 17 years - Living with two parents Both parents native 824 96.4% Native31 3.6% Foreign-bornBoth parents foreign-born 1,234 74.2% Native430 25.8% Foreign-bornOne native, one foreign-born parent 237 83.1% Native48 16.9% Foreign-bornChildren 6 to 17 years - Living with one parent Foreign-born parent 1,053 69.3% Native465 30.7% Foreign-born
Grandparents responsible for own grandchildren in North Atlanta
Grandparents (30 to 59 years) White / Caucasian 47 100.0% Not responsible for grandchildrenOther race 14 32.2% Responsible for grandchildren29 67.8% Not responsible for grandchildrenHispanic or Latino 20 19.3% Responsible for grandchildren83 80.7% Not responsible for grandchildrenGrandparents (60 years and over) White / Caucasian 48 47.0% Responsible for grandchildren54 53.0% Not responsible for grandchildrenOther race 18 39.4% Responsible for grandchildren28 60.6% Not responsible for grandchildrenHispanic or Latino 20 46.2% Responsible for grandchildren24 53.8% Not responsible for grandchildren