Races in Norridge, Illinois (IL) Detailed Stats
Data:
Races - White alone (%)
Races - White alone (% change since 2000)
Races - Black alone (%)
Races - Black alone (% change since 2000)
Races - American Indian alone (%)
Races - American Indian alone (% change since 2000)
Races - Asian alone (%)
Races - Asian alone (% change since 2000)
Races - Hispanic (%)
Races - Hispanic (% change since 2000)
Races - Native Hawaiian and Other Pacific Islander alone (%)
Races - Native Hawaiian and Other Pacific Islander alone (% change since 2000)
Races - Two or more races(%)
Races - Two or more races(% change since 2000)
Races - Other race alone (%)
Races - Other race alone (% change since 2000)
Racial diversity
Place of birth - Born in state of residence (%)
Place of birth - Born in state of residence (%) - White
Place of birth - Born in state of residence (%) - Black or African American
Place of birth - Born in state of residence (%) - Asian
Place of birth - Born in state of residence (%) - Hispanic or Latino
Place of birth - Born in state of residence (%) - American Indian and Alaska Native
Place of birth - Born in state of residence (%) - Multirace
Place of birth - Born in state of residence (%) - Other Race
Place of birth - Born in other state (%)
Place of birth - Born in other state (%) - White
Place of birth - Born in other state (%) - Black or African American
Place of birth - Born in other state (%) - Asian
Place of birth - Born in other state (%) - Hispanic or Latino
Place of birth - Born in other state (%) - American Indian and Alaska Native
Place of birth - Born in other state (%) - Multirace
Place of birth - Born in other state (%) - Other Race
Place of birth - Native, outside of US (%)
Place of birth - Native, outside of US (%) - White
Place of birth - Native, outside of US (%) - Black or African American
Place of birth - Native, outside of US (%) - Asian
Place of birth - Native, outside of US (%) - Hispanic or Latino
Place of birth - Native, outside of US (%) - American Indian and Alaska Native
Place of birth - Native, outside of US (%) - Multirace
Place of birth - Native, outside of US (%) - Other Race
Place of birth - Foreign born (%)
Place of birth - Foreign born (%) - White
Place of birth - Foreign born (%) - Black or African American
Place of birth - Foreign born (%) - Asian
Place of birth - Foreign born (%) - Hispanic or Latino
Place of birth - Foreign born (%) - American Indian and Alaska Native
Place of birth - Foreign born (%) - Multirace
Place of birth - Foreign born (%) - Other Race
Residents speaking English at home (%)
Residents speaking English at home - Born in the United States (%)
Residents speaking English at home - Native, born elsewhere (%)
Residents speaking English at home - Foreign born (%)
Residents speaking Spanish at home (%)
Residents speaking Spanish at home - Born in the United States (%)
Residents speaking Spanish at home - Native, born elsewhere (%)
Residents speaking Spanish at home - Foreign born (%)
Residents speaking other language at home (%)
Residents speaking other language at home - Born in the United States (%)
Residents speaking other language at home - Native, born elsewhere (%)
Residents speaking other language at home - Foreign born (%)
Marital status - Never married (%)
Marital status - Now married (%)
Marital status - Separated (%)
Marital status - Widowed (%)
Marital status - Divorced (%)
Ancestries Reported - Arab (%)
Ancestries Reported - Czech (%)
Ancestries Reported - Danish (%)
Ancestries Reported - Dutch (%)
Ancestries Reported - English (%)
Ancestries Reported - French (%)
Ancestries Reported - French Canadian (%)
Ancestries Reported - German (%)
Ancestries Reported - Greek (%)
Ancestries Reported - Hungarian (%)
Ancestries Reported - Irish (%)
Ancestries Reported - Italian (%)
Ancestries Reported - Lithuanian (%)
Ancestries Reported - Norwegian (%)
Ancestries Reported - Polish (%)
Ancestries Reported - Portuguese (%)
Ancestries Reported - Russian (%)
Ancestries Reported - Scotch-Irish (%)
Ancestries Reported - Scottish (%)
Ancestries Reported - Slovak (%)
Ancestries Reported - Subsaharan African (%)
Ancestries Reported - Swedish (%)
Ancestries Reported - Swiss (%)
Ancestries Reported - Ukrainian (%)
Ancestries Reported - United States (%)
Ancestries Reported - Welsh (%)
Ancestries Reported - West Indian (%)
Ancestries Reported - Other (%)
Geographical mobility - Same house 1 year ago (%)
Geographical mobility - Same house 1 year ago (%) - White
Geographical mobility - Same house 1 year ago (%) - Black or African American
Geographical mobility - Same house 1 year ago (%) - Asian
Geographical mobility - Same house 1 year ago (%) - Hispanic or Latino
Geographical mobility - Same house 1 year ago (%) - American Indian and Alaska Native
Geographical mobility - Same house 1 year ago (%) - Multirace
Geographical mobility - Same house 1 year ago (%) - Other Race
Geographical mobility - Moved within same county (%)
Geographical mobility - Moved within same county (%) - White
Geographical mobility - Moved within same county (%) - Black or African American
Geographical mobility - Moved within same county (%) - Asian
Geographical mobility - Moved within same county (%) - Hispanic or Latino
Geographical mobility - Moved within same county (%) - American Indian and Alaska Native
Geographical mobility - Moved within same county (%) - Multirace
Geographical mobility - Moved within same county (%) - Other Race
Geographical mobility - Moved from different county within same state (%)
Geographical mobility - Moved from different county within same state (%) - White
Geographical mobility - Moved from different county within same state (%) - Black or African American
Geographical mobility - Moved from different county within same state (%) - Asian
Geographical mobility - Moved from different county within same state (%) - Hispanic or Latino
Geographical mobility - Moved from different county within same state (%) - American Indian and Alaska Native
Geographical mobility - Moved from different county within same state (%) - Multirace
Geographical mobility - Moved from different county within same state (%) - Other Race
Geographical mobility - Moved from different state (%)
Geographical mobility - Moved from different state (%) - White
Geographical mobility - Moved from different state (%) - Black or African American
Geographical mobility - Moved from different state (%) - Asian
Geographical mobility - Moved from different state (%) - Hispanic or Latino
Geographical mobility - Moved from different state (%) - American Indian and Alaska Native
Geographical mobility - Moved from different state (%) - Multirace
Geographical mobility - Moved from different state (%) - Other Race
Geographical mobility - Moved from abroad (%)
Geographical mobility - Moved from abroad (%) - White
Geographical mobility - Moved from abroad (%) - Black or African American
Geographical mobility - Moved from abroad (%) - Asian
Geographical mobility - Moved from abroad (%) - Hispanic or Latino
Geographical mobility - Moved from abroad (%) - American Indian and Alaska Native
Geographical mobility - Moved from abroad (%) - Multirace
Geographical mobility - Moved from abroad (%) - Other Race
Place of birth for the foreign-born population - Ireland (%)
Place of birth for the foreign-born population - Denmark (%)
Place of birth for the foreign-born population - Norway (%)
Place of birth for the foreign-born population - Sweden (%)
Place of birth for the foreign-born population - United Kingdom (%)
Place of birth for the foreign-born population - England (%)
Place of birth for the foreign-born population - Scotland (%)
Place of birth for the foreign-born population - Other Northern Europe (%)
Place of birth for the foreign-born population - Austria (%)
Place of birth for the foreign-born population - Belgium (%)
Place of birth for the foreign-born population - France (%)
Place of birth for the foreign-born population - Germany (%)
Place of birth for the foreign-born population - Netherlands (%)
Place of birth for the foreign-born population - Switzerland (%)
Place of birth for the foreign-born population - Other Western Europe (%)
Place of birth for the foreign-born population - Greece (%)
Place of birth for the foreign-born population - Italy (%)
Place of birth for the foreign-born population - Portugal (%)
Place of birth for the foreign-born population - Spain (%)
Place of birth for the foreign-born population - Other Southern Europe (%)
Place of birth for the foreign-born population - Albania (%)
Place of birth for the foreign-born population - Belarus (%)
Place of birth for the foreign-born population - Bosnia and Herzegovina (%)
Place of birth for the foreign-born population - Bulgaria (%)
Place of birth for the foreign-born population - Croatia (%)
Place of birth for the foreign-born population - Czechoslovakia (%)
Place of birth for the foreign-born population - Hungary (%)
Place of birth for the foreign-born population - Latvia (%)
Place of birth for the foreign-born population - Lithuania (%)
Place of birth for the foreign-born population - North Macedonia (Macedonia) (%)
Place of birth for the foreign-born population - Moldova (%)
Place of birth for the foreign-born population - Poland (%)
Place of birth for the foreign-born population - Romania (%)
Place of birth for the foreign-born population - Russia (%)
Place of birth for the foreign-born population - Serbia (%)
Place of birth for the foreign-born population - Ukraine (%)
Place of birth for the foreign-born population - Other Eastern Europe (%)
Place of birth for the foreign-born population - China (%)
Place of birth for the foreign-born population - Hong Kong (%)
Place of birth for the foreign-born population - Taiwan (%)
Place of birth for the foreign-born population - Japan (%)
Place of birth for the foreign-born population - Korea (%)
Place of birth for the foreign-born population - Other Eastern Asia (%)
Place of birth for the foreign-born population - Afghanistan (%)
Place of birth for the foreign-born population - Bangladesh (%)
Place of birth for the foreign-born population - India (%)
Place of birth for the foreign-born population - Iran (%)
Place of birth for the foreign-born population - Kazakhstan (%)
Place of birth for the foreign-born population - Nepal (%)
Place of birth for the foreign-born population - Pakistan (%)
Place of birth for the foreign-born population - Sri Lanka (%)
Place of birth for the foreign-born population - Uzbekistan (%)
Place of birth for the foreign-born population - Other South Central Asia (%)
Place of birth for the foreign-born population - Burma (%)
Place of birth for the foreign-born population - Cambodia (%)
Place of birth for the foreign-born population - Indonesia (%)
Place of birth for the foreign-born population - Laos (%)
Place of birth for the foreign-born population - Malaysia (%)
Place of birth for the foreign-born population - Philippines (%)
Place of birth for the foreign-born population - Singapore (%)
Place of birth for the foreign-born population - Thailand (%)
Place of birth for the foreign-born population - Vietnam (%)
Place of birth for the foreign-born population - Other South Eastern Asia (%)
Place of birth for the foreign-born population - Armenia (%)
Place of birth for the foreign-born population - Iraq (%)
Place of birth for the foreign-born population - Israel (%)
Place of birth for the foreign-born population - Jordan (%)
Place of birth for the foreign-born population - Kuwait (%)
Place of birth for the foreign-born population - Lebanon (%)
Place of birth for the foreign-born population - Saudi Arabia (%)
Place of birth for the foreign-born population - Syria (%)
Place of birth for the foreign-born population - Turkey (%)
Place of birth for the foreign-born population - Yemen (%)
Place of birth for the foreign-born population - Other Western Asia (%)
Place of birth for the foreign-born population - Eritrea (%)
Place of birth for the foreign-born population - Ethiopia (%)
Place of birth for the foreign-born population - Kenya (%)
Place of birth for the foreign-born population - Somalia (%)
Place of birth for the foreign-born population - Uganda (%)
Place of birth for the foreign-born population - Zimbabwe (%)
Place of birth for the foreign-born population - Other Eastern Africa (%)
Place of birth for the foreign-born population - Cameroon (%)
Place of birth for the foreign-born population - Congo (%)
Place of birth for the foreign-born population - Democratic Republic of Congo (Zaire) (%)
Place of birth for the foreign-born population - Other Middle Africa (%)
Place of birth for the foreign-born population - Egypt (%)
Place of birth for the foreign-born population - Morocco (%)
Place of birth for the foreign-born population - Sudan (%)
Place of birth for the foreign-born population - Other Northern Africa (%)
Place of birth for the foreign-born population - South Africa (%)
Place of birth for the foreign-born population - Other Southern Africa (%)
Place of birth for the foreign-born population - Cabo Verde (%)
Place of birth for the foreign-born population - Ghana (%)
Place of birth for the foreign-born population - Liberia (%)
Place of birth for the foreign-born population - Nigeria (%)
Place of birth for the foreign-born population - Senegal (%)
Place of birth for the foreign-born population - Sierra Leone (%)
Place of birth for the foreign-born population - Other Western Africa (%)
Place of birth for the foreign-born population - Australia (%)
Place of birth for the foreign-born population - New Zealand (%)
Place of birth for the foreign-born population - Fiji (%)
Place of birth for the foreign-born population - Micronesia (%)
Place of birth for the foreign-born population - Bahamas (%)
Place of birth for the foreign-born population - Barbados (%)
Place of birth for the foreign-born population - Cuba (%)
Place of birth for the foreign-born population - Dominica (%)
Place of birth for the foreign-born population - Dominican Republic (%)
Place of birth for the foreign-born population - Grenada (%)
Place of birth for the foreign-born population - Haiti (%)
Place of birth for the foreign-born population - Jamaica (%)
Place of birth for the foreign-born population - St. Vincent and the Grenadines (%)
Place of birth for the foreign-born population - Trinidad and Tobago (%)
Place of birth for the foreign-born population - West Indies (%)
Place of birth for the foreign-born population - Other Caribbean (%)
Place of birth for the foreign-born population - Belize (%)
Place of birth for the foreign-born population - Costa Rica (%)
Place of birth for the foreign-born population - El Salvador (%)
Place of birth for the foreign-born population - Guatemala (%)
Place of birth for the foreign-born population - Honduras (%)
Place of birth for the foreign-born population - Mexico (%)
Place of birth for the foreign-born population - Nicaragua (%)
Place of birth for the foreign-born population - Panama (%)
Place of birth for the foreign-born population - Other Central America (%)
Place of birth for the foreign-born population - Argentina (%)
Place of birth for the foreign-born population - Bolivia (%)
Place of birth for the foreign-born population - Brazil (%)
Place of birth for the foreign-born population - Chile (%)
Place of birth for the foreign-born population - Colombia (%)
Place of birth for the foreign-born population - Ecuador (%)
Place of birth for the foreign-born population - Guyana (%)
Place of birth for the foreign-born population - Peru (%)
Place of birth for the foreign-born population - Uruguay (%)
Place of birth for the foreign-born population - Venezuela (%)
Place of birth for the foreign-born population - Other South America (%)
Place of birth for the foreign-born population - Canada (%)
Place of birth for the foreign-born population - Other Northern America (%)
Place of birth for the foreign-born population - Other (%)
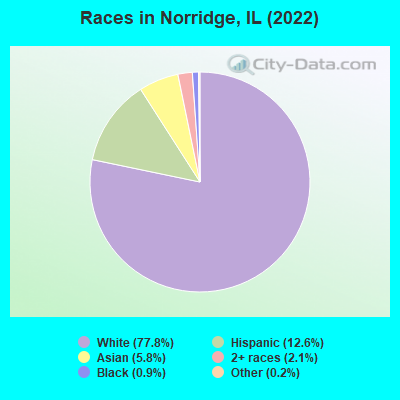
According to 2022 data, the most numerous races in Norridge, IL are White alone (11,628 residents), Hispanic (1,878 residents), and Black alone (128 residents). 47.1% of Norridge residents speak English at home. 38.6% of Norridge, IL residents are foreign-born (26.7% born in Europe, 7.0% born in Asia, 4.1% born in Latin America), which is 63.7% greater than the foreign-born rate of 14.0% across the entire state of Illinois.
Race distribution in Norridge
2000 2022
8,424,140 67.8% White alone 1,856,152 14.9% Black alone 1,530,262 12.3% Hispanic 419,916 3.4% Asian alone 153,996 1.2% Two or more races 13,479 0.1% Other race alone 18,232 0.1% American Indian alone 3,116 0.03% Native Hawaiian and Other
7,356,301 58.5% White alone 2,299,726 18.3% Hispanic 1,660,423 13.2% Black alone 747,296 5.9% Asian alone 458,599 3.6% Two or more races 45,386 0.4% Other race alone 10,405 0.08% American Indian alone 3,896 0.03% Native Hawaiian and Other
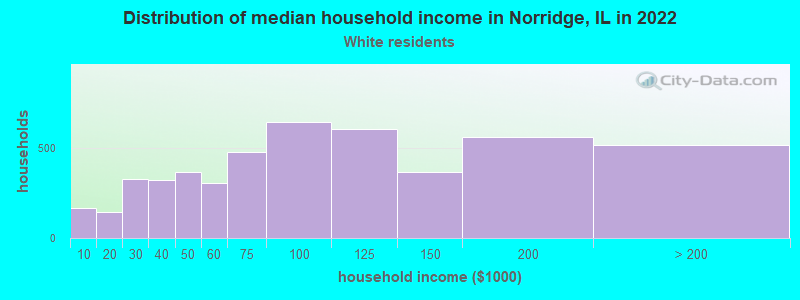
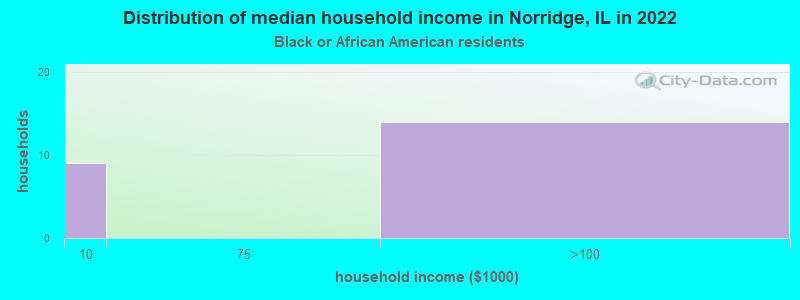
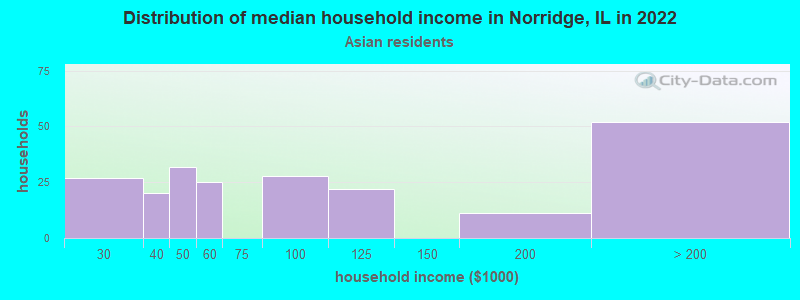
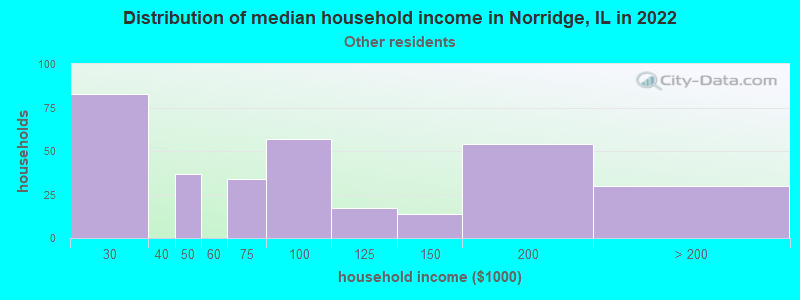
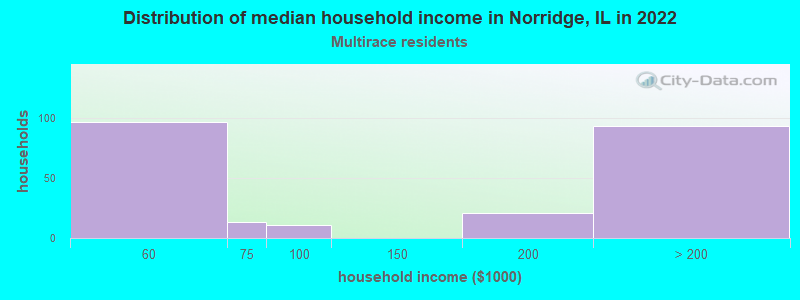
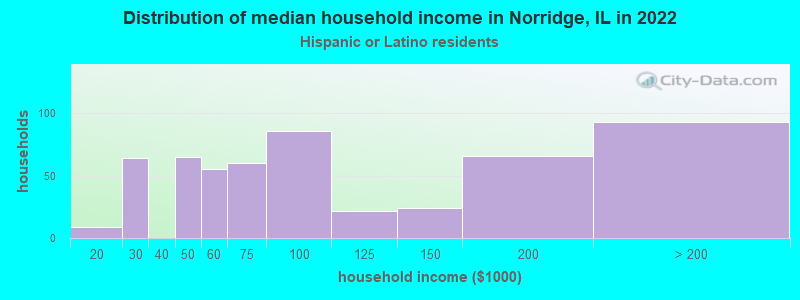
Income and house value in Norridge Median household income in 2022 $82,261 White non-Hispanic householders$81,542 Asian householders$75,070 Some other race householders$78,559 Hispanic or Latino race householdersMedian 2022 house value $356,669 White Non-Hispanic householders $373,518 Asian householders$423,179 Some other race householders$270,473 Two or more races householders$331,839 Hispanic or Latino householders
Median age by race in Norridge
50.9 Median age for White residents52.2 50.2 67.1 Median age for Black or African American residents73.2 67.8 37.6 Median age for American Indian / Alaska Native residents-736,736,736.0 35.4 42.8 Median age for Asian residents45.9 41.4 -687,999,999.3 Median age for Native Hawaiian / Pacific Islander residents-918,721,460.3 -610,229,276.3 40.3 Median age for Other race residents36.2 48.8 21.9 Median age for Two or more races residents21.8 22.2 50.8 Median age for White alone residents51.7 49.5 33.4 Median age for Hispanic or Latino residents28.6 39.2
Owner/renter occupied households by race in Norridge
House owners and renters - White residents 4,065 84.4% Owner occupied754 15.6% Renter occupiedHouse owners and renters - Black or African American residents 21 100.0% Renter occupiedHouse owners and renters - American Indian / Alaska Native residents 21 100.0% Owner occupiedHouse owners and renters - Asian residents 142 67.7% Owner occupied68 32.3% Renter occupiedHouse owners and renters - Other race residents 242 68.6% Owner occupied111 31.4% Renter occupiedHouse owners and renters - Two or more races residents 242 100.0% Owner occupiedHouse owners and renters - White alone residents 4,194 83.6% Owner occupied823 16.4% Renter occupiedHouse owners and renters - Hispanic or Latino residents 487 86.0% Owner occupied79 14.0% Renter occupied
Language usage in Norridge
English speakers - Total 47.1% of residents of Norridge speak English at home.
7.8% of residents speak Spanish at home 681 60.6% Speak English very well442 39.4% Speak English less than very well45.7% of residents speak other language at home 3,313 50.6% Speak English very well3,236 49.4% Speak English less than very well
English speakers - Born in the United States 75.1% of residents of Norridge speak English at home.
28.1% of residents speak other language at home 185 100.0% Speak English very well
English speakers - Native, born elsewhere 18.9% of residents of Norridge speak English at home.
59.2% of residents speak Spanish at home 128 94.8% Speak English very well7 5.2% Speak English less than very well23.2% of residents speak other language at home 27 50.9% Speak English very well26 49.1% Speak English less than very well
English speakers - Foreign-born 6.7% of residents of Norridge speak English at home.
9.0% of residents speak Spanish at home 141 27.1% Speak English very well379 72.9% Speak English less than very well84.0% of residents speak other language at home 1,796 37.1% Speak English very well3,051 62.9% Speak English less than very well
White (Caucasian) - Speak only English Native:
81.2% (5,472)Foreign-born:
7.5% (259)
White (Caucasian) - Speak another language Native:
16.6% (1,117)Foreign-born:
92.0% (3,166)
Asian - Speak only English Native:
19.5% (30)Foreign-born:
4.6% (31)
Asian - Speak another language Native:
80.2% (125)Foreign-born:
96.3% (657)
Other race - Speak only English Native:
21.6% (103)Foreign-born:
11.3% (64)
Other race - Speak another language Native:
78.1% (372)Foreign-born:
87.9% (496)
Two or more races - Speak another language Native:
25.2% (187)Foreign-born:
100.0% (87)
White alone - Speak only English Native:
77.9% (5,289)Foreign-born:
6.0% (259)
White alone - Speak another language Native:
23.6% (1,600)Foreign-born:
95.1% (4,143)
Hispanic or Latino - Speak only English Native:
52.6% (631)Foreign-born:
13.2% (82)
Hispanic or Latino - Speak another language Native:
48.7% (584)Foreign-born:
85.7% (532)
Foreign-born residents in Norridge 5,774 residents are foreign born (26.7% Europe , 7.0% Asia , 4.1% Latin America ).
This city:
38.6%Illinois:
14.1%
Marital status for residents in Norridge Marital status - White (Caucasian) population 15 years and over
Males 30.3% Never married56.9% Now married1.8% Separated2.8% Widowed8.3% DivorcedFemales 26.4% Never married50.0% Now married0.3% Separated14.8% Widowed8.5% DivorcedWomen who gave birth in the past 12 months Now married:
100.0% (93)Unmarried:
0.0% (0)
Women who did not give birth in the past 12 months Now married:
39.6% (816)Unmarried:
60.4% (1,242)
Marital status - Black or African American population 15 years and over
Males 66.7% Never married14.8% Now married0.0% Separated0.0% Widowed18.5% DivorcedFemales 39.3% Never married16.9% Now married0.0% Separated24.7% Widowed19.1% DivorcedWomen who did not give birth in the past 12 months Now married:
0.0% (0)Unmarried:
100.0% (8)
Marital status - Asian population 15 years and over
Males 8.6% Never married71.4% Now married3.9% Separated9.0% Widowed7.1% DivorcedFemales 26.2% Never married48.5% Now married5.4% Separated2.6% Widowed17.3% DivorcedWomen who did not give birth in the past 12 months Now married:
46.3% (120)Unmarried:
53.7% (139)
Marital status - Other race population 15 years and over
Males 67.0% Never married33.0% Now married0.0% Separated0.0% Widowed0.0% DivorcedFemales 14.4% Never married48.6% Now married11.6% Separated7.2% Widowed18.2% DivorcedWomen who did not give birth in the past 12 months Now married:
45.7% (85)Unmarried:
54.3% (101)
Marital status - Two or more races population 15 years and over
Males 59.9% Never married21.2% Now married0.0% Separated0.0% Widowed18.9% DivorcedFemales 45.9% Never married26.6% Now married0.0% Separated21.5% Widowed6.0% DivorcedWomen who did not give birth in the past 12 months Now married:
22.0% (40)Unmarried:
78.0% (143)
Marital status - White alone, not Hispanic / Latino population 15 years and over
Males 29.5% Never married57.5% Now married1.8% Separated2.7% Widowed8.6% DivorcedFemales 25.6% Never married50.1% Now married0.3% Separated15.4% Widowed8.6% DivorcedWomen who gave birth in the past 12 months Now married:
100.0% (97)Unmarried:
0.0% (0)
Women who did not give birth in the past 12 months Now married:
39.3% (825)Unmarried:
60.7% (1,274)
Marital status - Hispanic or Latino population 15 years and over
Males 55.5% Never married38.3% Now married0.0% Separated1.0% Widowed5.1% DivorcedFemales 27.9% Never married46.5% Now married5.3% Separated10.0% Widowed10.3% DivorcedWomen who gave birth in the past 12 months Now married:
100.0% (8)Unmarried:
0.0% (0)
Women who did not give birth in the past 12 months Now married:
45.2% (196)Unmarried:
54.8% (238)
Ancestries in Norridge
3,102 34.0% Polish1,085 11.9% Italian749 8.2% American509 5.6% Irish483 5.3% German343 3.8% Syrian251 2.8% Yugoslavian225 2.5% Serbian220 2.4% Greek210 2.3% Ukrainian107 1.2% Palestinian106 1.2% Norwegian91 1.0% Romanian55 0.6% Czech46 0.5% Arab36 0.4% English33 0.4% Scandinavian32 0.4% Scottish26 0.3% Slovak21 0.2% French20 0.2% Albanian20 0.2% Macedonian18 0.2% Lithuanian14 0.2% Dutch14 0.2% European12 0.1% Assyrian11 0.1% Croatian7 0.08% Austrian
Children Nativity (place of birth) in Norridge
Children under 6 years - Living with two parents Both parents native 304 100.0% NativeBoth parents foreign-born 144 100.0% NativeOne native, one foreign-born parent 110 100.0% NativeChildren under 6 years - Living with one parent Native parent 56 100.0% NativeForeign-born parent 59 100.0% NativeChildren 6 to 17 years - Living with two parents Both parents native 333 100.0% NativeBoth parents foreign-born 357 74.7% Native121 25.3% Foreign-bornOne native, one foreign-born parent 285 100.0% NativeChildren 6 to 17 years - Living with one parent Native parent 381 100.0% NativeForeign-born parent 217 53.8% Native186 46.2% Foreign-born
Grandparents responsible for own grandchildren in Norridge
Grandparents (30 to 59 years) White / Caucasian 19 63.1% Responsible for grandchildren11 36.9% Not responsible for grandchildrenWhite alone, not Hispanic / Latino 25 72.6% Responsible for grandchildren9 27.4% Not responsible for grandchildren
Grandparents (60 years and over) White / Caucasian 93 100.0% Not responsible for grandchildrenWhite alone, not Hispanic / Latino 119 100.0% Not responsible for grandchildren