Races in Normal, Illinois (IL) Detailed Stats
Data:
Races - White alone (%)
Races - White alone (% change since 2000)
Races - Black alone (%)
Races - Black alone (% change since 2000)
Races - American Indian alone (%)
Races - American Indian alone (% change since 2000)
Races - Asian alone (%)
Races - Asian alone (% change since 2000)
Races - Hispanic (%)
Races - Hispanic (% change since 2000)
Races - Native Hawaiian and Other Pacific Islander alone (%)
Races - Native Hawaiian and Other Pacific Islander alone (% change since 2000)
Races - Two or more races(%)
Races - Two or more races(% change since 2000)
Races - Other race alone (%)
Races - Other race alone (% change since 2000)
Racial diversity
Place of birth - Born in state of residence (%)
Place of birth - Born in state of residence (%) - White
Place of birth - Born in state of residence (%) - Black or African American
Place of birth - Born in state of residence (%) - Asian
Place of birth - Born in state of residence (%) - Hispanic or Latino
Place of birth - Born in state of residence (%) - American Indian and Alaska Native
Place of birth - Born in state of residence (%) - Multirace
Place of birth - Born in state of residence (%) - Other Race
Place of birth - Born in other state (%)
Place of birth - Born in other state (%) - White
Place of birth - Born in other state (%) - Black or African American
Place of birth - Born in other state (%) - Asian
Place of birth - Born in other state (%) - Hispanic or Latino
Place of birth - Born in other state (%) - American Indian and Alaska Native
Place of birth - Born in other state (%) - Multirace
Place of birth - Born in other state (%) - Other Race
Place of birth - Native, outside of US (%)
Place of birth - Native, outside of US (%) - White
Place of birth - Native, outside of US (%) - Black or African American
Place of birth - Native, outside of US (%) - Asian
Place of birth - Native, outside of US (%) - Hispanic or Latino
Place of birth - Native, outside of US (%) - American Indian and Alaska Native
Place of birth - Native, outside of US (%) - Multirace
Place of birth - Native, outside of US (%) - Other Race
Place of birth - Foreign born (%)
Place of birth - Foreign born (%) - White
Place of birth - Foreign born (%) - Black or African American
Place of birth - Foreign born (%) - Asian
Place of birth - Foreign born (%) - Hispanic or Latino
Place of birth - Foreign born (%) - American Indian and Alaska Native
Place of birth - Foreign born (%) - Multirace
Place of birth - Foreign born (%) - Other Race
Residents speaking English at home (%)
Residents speaking English at home - Born in the United States (%)
Residents speaking English at home - Native, born elsewhere (%)
Residents speaking English at home - Foreign born (%)
Residents speaking Spanish at home (%)
Residents speaking Spanish at home - Born in the United States (%)
Residents speaking Spanish at home - Native, born elsewhere (%)
Residents speaking Spanish at home - Foreign born (%)
Residents speaking other language at home (%)
Residents speaking other language at home - Born in the United States (%)
Residents speaking other language at home - Native, born elsewhere (%)
Residents speaking other language at home - Foreign born (%)
Marital status - Never married (%)
Marital status - Now married (%)
Marital status - Separated (%)
Marital status - Widowed (%)
Marital status - Divorced (%)
Ancestries Reported - Arab (%)
Ancestries Reported - Czech (%)
Ancestries Reported - Danish (%)
Ancestries Reported - Dutch (%)
Ancestries Reported - English (%)
Ancestries Reported - French (%)
Ancestries Reported - French Canadian (%)
Ancestries Reported - German (%)
Ancestries Reported - Greek (%)
Ancestries Reported - Hungarian (%)
Ancestries Reported - Irish (%)
Ancestries Reported - Italian (%)
Ancestries Reported - Lithuanian (%)
Ancestries Reported - Norwegian (%)
Ancestries Reported - Polish (%)
Ancestries Reported - Portuguese (%)
Ancestries Reported - Russian (%)
Ancestries Reported - Scotch-Irish (%)
Ancestries Reported - Scottish (%)
Ancestries Reported - Slovak (%)
Ancestries Reported - Subsaharan African (%)
Ancestries Reported - Swedish (%)
Ancestries Reported - Swiss (%)
Ancestries Reported - Ukrainian (%)
Ancestries Reported - United States (%)
Ancestries Reported - Welsh (%)
Ancestries Reported - West Indian (%)
Ancestries Reported - Other (%)
Geographical mobility - Same house 1 year ago (%)
Geographical mobility - Same house 1 year ago (%) - White
Geographical mobility - Same house 1 year ago (%) - Black or African American
Geographical mobility - Same house 1 year ago (%) - Asian
Geographical mobility - Same house 1 year ago (%) - Hispanic or Latino
Geographical mobility - Same house 1 year ago (%) - American Indian and Alaska Native
Geographical mobility - Same house 1 year ago (%) - Multirace
Geographical mobility - Same house 1 year ago (%) - Other Race
Geographical mobility - Moved within same county (%)
Geographical mobility - Moved within same county (%) - White
Geographical mobility - Moved within same county (%) - Black or African American
Geographical mobility - Moved within same county (%) - Asian
Geographical mobility - Moved within same county (%) - Hispanic or Latino
Geographical mobility - Moved within same county (%) - American Indian and Alaska Native
Geographical mobility - Moved within same county (%) - Multirace
Geographical mobility - Moved within same county (%) - Other Race
Geographical mobility - Moved from different county within same state (%)
Geographical mobility - Moved from different county within same state (%) - White
Geographical mobility - Moved from different county within same state (%) - Black or African American
Geographical mobility - Moved from different county within same state (%) - Asian
Geographical mobility - Moved from different county within same state (%) - Hispanic or Latino
Geographical mobility - Moved from different county within same state (%) - American Indian and Alaska Native
Geographical mobility - Moved from different county within same state (%) - Multirace
Geographical mobility - Moved from different county within same state (%) - Other Race
Geographical mobility - Moved from different state (%)
Geographical mobility - Moved from different state (%) - White
Geographical mobility - Moved from different state (%) - Black or African American
Geographical mobility - Moved from different state (%) - Asian
Geographical mobility - Moved from different state (%) - Hispanic or Latino
Geographical mobility - Moved from different state (%) - American Indian and Alaska Native
Geographical mobility - Moved from different state (%) - Multirace
Geographical mobility - Moved from different state (%) - Other Race
Geographical mobility - Moved from abroad (%)
Geographical mobility - Moved from abroad (%) - White
Geographical mobility - Moved from abroad (%) - Black or African American
Geographical mobility - Moved from abroad (%) - Asian
Geographical mobility - Moved from abroad (%) - Hispanic or Latino
Geographical mobility - Moved from abroad (%) - American Indian and Alaska Native
Geographical mobility - Moved from abroad (%) - Multirace
Geographical mobility - Moved from abroad (%) - Other Race
Place of birth for the foreign-born population - Ireland (%)
Place of birth for the foreign-born population - Denmark (%)
Place of birth for the foreign-born population - Norway (%)
Place of birth for the foreign-born population - Sweden (%)
Place of birth for the foreign-born population - United Kingdom (%)
Place of birth for the foreign-born population - England (%)
Place of birth for the foreign-born population - Scotland (%)
Place of birth for the foreign-born population - Other Northern Europe (%)
Place of birth for the foreign-born population - Austria (%)
Place of birth for the foreign-born population - Belgium (%)
Place of birth for the foreign-born population - France (%)
Place of birth for the foreign-born population - Germany (%)
Place of birth for the foreign-born population - Netherlands (%)
Place of birth for the foreign-born population - Switzerland (%)
Place of birth for the foreign-born population - Other Western Europe (%)
Place of birth for the foreign-born population - Greece (%)
Place of birth for the foreign-born population - Italy (%)
Place of birth for the foreign-born population - Portugal (%)
Place of birth for the foreign-born population - Spain (%)
Place of birth for the foreign-born population - Other Southern Europe (%)
Place of birth for the foreign-born population - Albania (%)
Place of birth for the foreign-born population - Belarus (%)
Place of birth for the foreign-born population - Bosnia and Herzegovina (%)
Place of birth for the foreign-born population - Bulgaria (%)
Place of birth for the foreign-born population - Croatia (%)
Place of birth for the foreign-born population - Czechoslovakia (%)
Place of birth for the foreign-born population - Hungary (%)
Place of birth for the foreign-born population - Latvia (%)
Place of birth for the foreign-born population - Lithuania (%)
Place of birth for the foreign-born population - North Macedonia (Macedonia) (%)
Place of birth for the foreign-born population - Moldova (%)
Place of birth for the foreign-born population - Poland (%)
Place of birth for the foreign-born population - Romania (%)
Place of birth for the foreign-born population - Russia (%)
Place of birth for the foreign-born population - Serbia (%)
Place of birth for the foreign-born population - Ukraine (%)
Place of birth for the foreign-born population - Other Eastern Europe (%)
Place of birth for the foreign-born population - China (%)
Place of birth for the foreign-born population - Hong Kong (%)
Place of birth for the foreign-born population - Taiwan (%)
Place of birth for the foreign-born population - Japan (%)
Place of birth for the foreign-born population - Korea (%)
Place of birth for the foreign-born population - Other Eastern Asia (%)
Place of birth for the foreign-born population - Afghanistan (%)
Place of birth for the foreign-born population - Bangladesh (%)
Place of birth for the foreign-born population - India (%)
Place of birth for the foreign-born population - Iran (%)
Place of birth for the foreign-born population - Kazakhstan (%)
Place of birth for the foreign-born population - Nepal (%)
Place of birth for the foreign-born population - Pakistan (%)
Place of birth for the foreign-born population - Sri Lanka (%)
Place of birth for the foreign-born population - Uzbekistan (%)
Place of birth for the foreign-born population - Other South Central Asia (%)
Place of birth for the foreign-born population - Burma (%)
Place of birth for the foreign-born population - Cambodia (%)
Place of birth for the foreign-born population - Indonesia (%)
Place of birth for the foreign-born population - Laos (%)
Place of birth for the foreign-born population - Malaysia (%)
Place of birth for the foreign-born population - Philippines (%)
Place of birth for the foreign-born population - Singapore (%)
Place of birth for the foreign-born population - Thailand (%)
Place of birth for the foreign-born population - Vietnam (%)
Place of birth for the foreign-born population - Other South Eastern Asia (%)
Place of birth for the foreign-born population - Armenia (%)
Place of birth for the foreign-born population - Iraq (%)
Place of birth for the foreign-born population - Israel (%)
Place of birth for the foreign-born population - Jordan (%)
Place of birth for the foreign-born population - Kuwait (%)
Place of birth for the foreign-born population - Lebanon (%)
Place of birth for the foreign-born population - Saudi Arabia (%)
Place of birth for the foreign-born population - Syria (%)
Place of birth for the foreign-born population - Turkey (%)
Place of birth for the foreign-born population - Yemen (%)
Place of birth for the foreign-born population - Other Western Asia (%)
Place of birth for the foreign-born population - Eritrea (%)
Place of birth for the foreign-born population - Ethiopia (%)
Place of birth for the foreign-born population - Kenya (%)
Place of birth for the foreign-born population - Somalia (%)
Place of birth for the foreign-born population - Uganda (%)
Place of birth for the foreign-born population - Zimbabwe (%)
Place of birth for the foreign-born population - Other Eastern Africa (%)
Place of birth for the foreign-born population - Cameroon (%)
Place of birth for the foreign-born population - Congo (%)
Place of birth for the foreign-born population - Democratic Republic of Congo (Zaire) (%)
Place of birth for the foreign-born population - Other Middle Africa (%)
Place of birth for the foreign-born population - Egypt (%)
Place of birth for the foreign-born population - Morocco (%)
Place of birth for the foreign-born population - Sudan (%)
Place of birth for the foreign-born population - Other Northern Africa (%)
Place of birth for the foreign-born population - South Africa (%)
Place of birth for the foreign-born population - Other Southern Africa (%)
Place of birth for the foreign-born population - Cabo Verde (%)
Place of birth for the foreign-born population - Ghana (%)
Place of birth for the foreign-born population - Liberia (%)
Place of birth for the foreign-born population - Nigeria (%)
Place of birth for the foreign-born population - Senegal (%)
Place of birth for the foreign-born population - Sierra Leone (%)
Place of birth for the foreign-born population - Other Western Africa (%)
Place of birth for the foreign-born population - Australia (%)
Place of birth for the foreign-born population - New Zealand (%)
Place of birth for the foreign-born population - Fiji (%)
Place of birth for the foreign-born population - Micronesia (%)
Place of birth for the foreign-born population - Bahamas (%)
Place of birth for the foreign-born population - Barbados (%)
Place of birth for the foreign-born population - Cuba (%)
Place of birth for the foreign-born population - Dominica (%)
Place of birth for the foreign-born population - Dominican Republic (%)
Place of birth for the foreign-born population - Grenada (%)
Place of birth for the foreign-born population - Haiti (%)
Place of birth for the foreign-born population - Jamaica (%)
Place of birth for the foreign-born population - St. Vincent and the Grenadines (%)
Place of birth for the foreign-born population - Trinidad and Tobago (%)
Place of birth for the foreign-born population - West Indies (%)
Place of birth for the foreign-born population - Other Caribbean (%)
Place of birth for the foreign-born population - Belize (%)
Place of birth for the foreign-born population - Costa Rica (%)
Place of birth for the foreign-born population - El Salvador (%)
Place of birth for the foreign-born population - Guatemala (%)
Place of birth for the foreign-born population - Honduras (%)
Place of birth for the foreign-born population - Mexico (%)
Place of birth for the foreign-born population - Nicaragua (%)
Place of birth for the foreign-born population - Panama (%)
Place of birth for the foreign-born population - Other Central America (%)
Place of birth for the foreign-born population - Argentina (%)
Place of birth for the foreign-born population - Bolivia (%)
Place of birth for the foreign-born population - Brazil (%)
Place of birth for the foreign-born population - Chile (%)
Place of birth for the foreign-born population - Colombia (%)
Place of birth for the foreign-born population - Ecuador (%)
Place of birth for the foreign-born population - Guyana (%)
Place of birth for the foreign-born population - Peru (%)
Place of birth for the foreign-born population - Uruguay (%)
Place of birth for the foreign-born population - Venezuela (%)
Place of birth for the foreign-born population - Other South America (%)
Place of birth for the foreign-born population - Canada (%)
Place of birth for the foreign-born population - Other Northern America (%)
Place of birth for the foreign-born population - Other (%)
Latest news about races in Normal, IL collected exclusively by city-data.com from local newspapers, TV, and radio stations
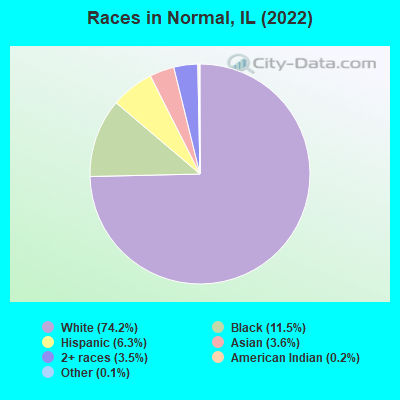
According to 2022 data, the most numerous races in Normal, IL are White alone (39,209 residents), Hispanic (3,338 residents), and Black alone (6,065 residents). 92.2% of Normal residents speak English at home. 6.3% of Normal, IL residents are foreign-born (2.4% born in Asia, 1.7% born in Africa, 1.1% born in Latin America, 1.0% born in Europe), which is 122.6% less than the foreign-born rate of 14.0% across the entire state of Illinois.
Race distribution in Normal
2000 2022
8,424,140 67.8% White alone 1,856,152 14.9% Black alone 1,530,262 12.3% Hispanic 419,916 3.4% Asian alone 153,996 1.2% Two or more races 13,479 0.1% Other race alone 18,232 0.1% American Indian alone 3,116 0.03% Native Hawaiian and Other
7,356,301 58.5% White alone 2,299,726 18.3% Hispanic 1,660,423 13.2% Black alone 747,296 5.9% Asian alone 458,599 3.6% Two or more races 45,386 0.4% Other race alone 10,405 0.08% American Indian alone 3,896 0.03% Native Hawaiian and Other
Income and house value in Normal Median household income in 2022 $63,836 White non-Hispanic householders$22,453 Black householders$187,082 Asian householders$53,752 Two or more races householders$50,916 Hispanic or Latino race householdersMedian 2022 house value $200,671 White Non-Hispanic householders$203,175 Black or African American householders$108,516 American Indian or Alaska Native householders $219,536 Asian householders$141,905 Some other race householders$212,858 Two or more races householders$204,845 Hispanic or Latino householders
Median age by race in Normal
26.8 Median age for White residents27.3 26.5 21.3 Median age for Black or African American residents20.3 22.2 19.3 Median age for American Indian / Alaska Native residents38.8 19.5 28.1 Median age for Asian residents35.1 27.7 -593,236,714.4 Median age for Native Hawaiian / Pacific Islander residents-666,666,666.0 -666,666,666.0 72.1 Median age for Other race residents45.8 44.3 23.2 Median age for Two or more races residents20.4 23.3 27.4 Median age for White alone residents28.4 27.2 19.6 Median age for Hispanic or Latino residents22.7 20.0
Owner/renter occupied households by race in Normal
House owners and renters - White residents 9,471 58.5% Owner occupied6,723 41.5% Renter occupiedHouse owners and renters - Black or African American residents 367 19.0% Owner occupied1,566 81.0% Renter occupiedHouse owners and renters - American Indian / Alaska Native residents 17 69.9% Owner occupied7 30.1% Renter occupiedHouse owners and renters - Asian residents 454 82.2% Owner occupied98 17.8% Renter occupiedHouse owners and renters - Native Hawaiian / Pacific Islander residents 9 100.0% Renter occupiedHouse owners and renters - Other race residents 87 68.4% Owner occupied40 31.6% Renter occupiedHouse owners and renters - Two or more races residents 439 50.3% Owner occupied433 49.7% Renter occupiedHouse owners and renters - White alone residents 9,416 58.7% Owner occupied6,621 41.3% Renter occupiedHouse owners and renters - Hispanic or Latino residents 443 62.1% Owner occupied270 37.9% Renter occupied
Language usage in Normal
English speakers - Total 92.2% of residents of Normal speak English at home.
3.4% of residents speak Spanish at home 1,351 78.1% Speak English very well379 21.9% Speak English less than very well4.7% of residents speak other language at home 2,139 90.3% Speak English very well230 9.7% Speak English less than very well
English speakers - Born in the United States 96.1% of residents of Normal speak English at home.
1.4% of residents speak Spanish at home 80 65.0% Speak English very well43 35.0% Speak English less than very well2.5% of residents speak other language at home 216 100.0% Speak English very well
English speakers - Native, born elsewhere 73.0% of residents of Normal speak English at home.
19.6% of residents speak Spanish at home 72 100.0% Speak English very well2.7% of residents speak other language at home 10 100.0% Speak English very well
English speakers - Foreign-born 29.9% of residents of Normal speak English at home.
15.2% of residents speak Spanish at home 248 56.5% Speak English very well191 43.5% Speak English less than very well57.2% of residents speak other language at home 1,460 88.6% Speak English very well188 11.4% Speak English less than very well
White (Caucasian) - Speak only English Native:
97.7% (37,755)Foreign-born:
66.8% (295)
White (Caucasian) - Speak another language Native:
2.2% (867)Foreign-born:
81.1% (358)
Black or African American - Speak only English Native:
98.2% (5,001)Foreign-born:
20.1% (136)
Black or African American - Speak another language Native:
1.8% (92)Foreign-born:
77.9% (528)
American Indian / Alaska Native - Speak only English Native:
22.5% (27)Foreign-born:
49.5% (41)
American Indian / Alaska Native - Speak another language Native:
81.9% (99)Foreign-born:
31.3% (26)
Asian - Speak only English Native:
79.1% (649)Foreign-born:
12.7% (146)
Asian - Speak another language Native:
26.5% (218)Foreign-born:
84.0% (971)
Other race - Speak only English Native:
45.3% (90)Foreign-born:
15.1% (32)
Other race - Speak another language Native:
56.5% (112)Foreign-born:
85.0% (181)
Two or more races - Speak another language Native:
20.0% (545)Foreign-born:
86.2% (125)
White alone - Speak only English Native:
98.7% (37,043)Foreign-born:
66.8% (297)
White alone - Speak another language Native:
1.3% (495)Foreign-born:
33.6% (150)
Hispanic or Latino - Speak only English Native:
57.3% (1,454)Foreign-born:
10.1% (60)
Hispanic or Latino - Speak another language Native:
43.2% (1,098)Foreign-born:
77.3% (460)
Foreign-born residents in Normal 3,325 residents are foreign born (2.4% Asia , 1.7% Africa , 1.1% Latin America , 1.0% Europe ).
This city:
6.3%Illinois:
14.1%
Marital status for residents in Normal Marital status - White (Caucasian) population 15 years and over
Males 53.7% Never married36.9% Now married0.4% Separated2.9% Widowed6.2% DivorcedFemales 51.2% Never married34.5% Now married0.6% Separated4.9% Widowed8.8% DivorcedWomen who gave birth in the past 12 months Now married:
92.2% (356)Unmarried:
7.8% (30)
Women who did not give birth in the past 12 months Now married:
23.1% (2,965)Unmarried:
76.9% (9,862)
Marital status - Black or African American population 15 years and over
Males 66.0% Never married25.3% Now married2.5% Separated0.3% Widowed5.9% DivorcedFemales 59.3% Never married16.1% Now married3.0% Separated5.0% Widowed16.7% DivorcedWomen who gave birth in the past 12 months Now married:
0.0% (0)Unmarried:
100.0% (280)
Women who did not give birth in the past 12 months Now married:
15.6% (317)Unmarried:
84.4% (1,713)
Marital status - American Indian / Alaska Native population 15 years and over
Males 54.5% Never married45.5% Now married0.0% Separated0.0% Widowed0.0% DivorcedFemales 100.0% Never married0.0% Now married0.0% Separated0.0% Widowed0.0% DivorcedWomen who did not give birth in the past 12 months Now married:
0.0% (0)Unmarried:
100.0% (103)
Marital status - Asian population 15 years and over
Males 43.0% Never married54.6% Now married0.0% Separated0.9% Widowed1.4% DivorcedFemales 51.4% Never married48.6% Now married0.0% Separated0.0% Widowed0.0% DivorcedWomen who gave birth in the past 12 months Now married:
100.0% (9)Unmarried:
0.0% (0)
Women who did not give birth in the past 12 months Now married:
42.1% (325)Unmarried:
57.9% (447)
Marital status - Native Hawaiian / Pacific Islander population 15 years and over
Males 100.0% Never married0.0% Now married0.0% Separated0.0% Widowed0.0% DivorcedFemales 100.0% Never married0.0% Now married0.0% Separated0.0% Widowed0.0% DivorcedWomen who did not give birth in the past 12 months Now married:
0.0% (0)Unmarried:
100.0% (11)
Marital status - Other race population 15 years and over
Males 51.9% Never married48.1% Now married0.0% Separated0.0% Widowed0.0% DivorcedFemales 33.7% Never married50.6% Now married0.0% Separated0.0% Widowed15.7% DivorcedWomen who gave birth in the past 12 months Now married:
100.0% (12)Unmarried:
0.0% (0)
Women who did not give birth in the past 12 months Now married:
11.1% (8)Unmarried:
88.9% (65)
Marital status - Two or more races population 15 years and over
Males 73.6% Never married17.5% Now married0.0% Separated6.2% Widowed2.7% DivorcedFemales 64.7% Never married24.1% Now married1.6% Separated0.4% Widowed9.2% DivorcedWomen who gave birth in the past 12 months Now married:
100.0% (16)Unmarried:
0.0% (0)
Women who did not give birth in the past 12 months Now married:
24.4% (351)Unmarried:
75.6% (1,087)
Marital status - White alone, not Hispanic / Latino population 15 years and over
Males 52.5% Never married37.6% Now married0.3% Separated3.0% Widowed6.5% DivorcedFemales 50.6% Never married34.8% Now married0.6% Separated5.1% Widowed9.0% DivorcedWomen who gave birth in the past 12 months Now married:
92.0% (348)Unmarried:
8.0% (30)
Women who did not give birth in the past 12 months Now married:
23.1% (2,865)Unmarried:
76.9% (9,552)
Marital status - Hispanic or Latino population 15 years and over
Males 72.3% Never married24.4% Now married0.6% Separated2.7% Widowed0.0% DivorcedFemales 58.4% Never married31.6% Now married0.0% Separated0.0% Widowed10.0% DivorcedWomen who gave birth in the past 12 months Now married:
100.0% (13)Unmarried:
0.0% (0)
Women who did not give birth in the past 12 months Now married:
26.1% (313)Unmarried:
73.9% (886)
Ancestries in Normal
5,785 21.3% German3,190 11.7% English3,107 11.4% Irish1,929 7.1% American1,019 3.7% Polish624 2.3% European575 2.1% Italian461 1.7% African394 1.4% Swedish244 0.9% Russian224 0.8% Norwegian174 0.6% French164 0.6% Dutch155 0.6% Scottish147 0.5% Welsh95 0.3% Palestinian87 0.3% Nigerian74 0.3% Ethiopian73 0.3% French Canadian70 0.3% Northern European59 0.2% Greek53 0.2% Belgian49 0.2% Scandinavian48 0.2% Slavic48 0.2% Danish43 0.2% Moroccan43 0.2% British43 0.2% Scotch-Irish36 0.1% Czech34 0.1% Romanian32 0.1% Austrian32 0.1% Kenyan31 0.1% Turkish29 0.1% Arab27 0.10% Jamaican25 0.09% Canadian24 0.09% Serbian23 0.08% Pennsylvania German23 0.08% Czechoslovakian22 0.08% Eastern European19 0.07% Macedonian14 0.05% Ukrainian14 0.05% Belizean10 0.04% Hungarian10 0.04% Haitian9 0.03% Slovak8 0.03% South African7 0.03% Basque6 0.02% Finnish
Geographical mobility in Normal Same house 1 year ago 30,772 76.9% White (Caucasian)4,654 78.7% Black or African American92 45.2% American Indian / Alaska Native1,640 76.8% Asian203 46.9% Other race2,433 74.6% Two or more races30,100 77.3% White alone, not Hispanic / Latino2,345 71.8% Hispanic or LatinoMoved within same county 3,751 9.4% White / Caucasian399 6.7% Black or African American75 36.9% American Indian / Alaska Native162 7.6% Asian152 35.2% Other race347 10.6% Two or more races3,734 9.6% White alone, not Hispanic / Latino226 6.9% Hispanic or LatinoMoved within same state 4,132 10.3% White / Caucasian853 14.4% Black or African American225 10.5% Asian13 100.0% Native Hawaiian / Pacific Islander22 5.1% Other race438 13.4% Two or more races3,694 9.5% White alone, not Hispanic / Latino692 21.2% Hispanic or LatinoMoved from different state 1,503 3.8% White / Caucasian25 0.4% Black or African American36 8.4% Other race87 2.7% Two or more races1,443 3.7% White alone, not Hispanic / Latino99 3.0% Hispanic or LatinoMoved from abroad 35 0.1% White108 1.8% Black or African American37 18.4% American Indian / Alaska Native137 6.4% Asian39 0.1% White alone, not Hispanic / Latino16 0.5% Hispanic or Latino
Children Nativity (place of birth) in Normal
Children under 6 years - Living with two parents Both parents native 1,700 100.0% NativeBoth parents foreign-born 91 43.8% Native116 56.2% Foreign-bornOne native, one foreign-born parent 86 100.0% NativeChildren under 6 years - Living with one parent Native parent 556 100.0% NativeChildren 6 to 17 years - Living with two parents Both parents native 3,878 98.5% Native58 1.5% Foreign-bornBoth parents foreign-born 440 97.1% Native13 2.9% Foreign-bornOne native, one foreign-born parent 213 100.0% NativeChildren 6 to 17 years - Living with one parent Native parent 1,102 99.2% Native9 0.8% Foreign-bornForeign-born parent 363 67.6% Native174 32.4% Foreign-born
Grandparents responsible for own grandchildren in Normal
Grandparents (30 to 59 years) White / Caucasian 37 34.7% Responsible for grandchildren69 65.3% Not responsible for grandchildrenBlack or African American 36 65.1% Responsible for grandchildren20 34.9% Not responsible for grandchildrenOther race 46 100.0% Not responsible for grandchildrenWhite alone, not Hispanic / Latino 37 34.4% Responsible for grandchildren70 65.6% Not responsible for grandchildrenHispanic or Latino 41 100.0% Not responsible for grandchildrenGrandparents (60 years and over) White / Caucasian 25 21.1% Responsible for grandchildren95 78.9% Not responsible for grandchildrenWhite alone, not Hispanic / Latino 25 20.3% Responsible for grandchildren100 79.7% Not responsible for grandchildren