Races in Norcross, Georgia (GA) Detailed Stats
Data:
Races - White alone (%)
Races - White alone (% change since 2000)
Races - Black alone (%)
Races - Black alone (% change since 2000)
Races - American Indian alone (%)
Races - American Indian alone (% change since 2000)
Races - Asian alone (%)
Races - Asian alone (% change since 2000)
Races - Hispanic (%)
Races - Hispanic (% change since 2000)
Races - Native Hawaiian and Other Pacific Islander alone (%)
Races - Native Hawaiian and Other Pacific Islander alone (% change since 2000)
Races - Two or more races(%)
Races - Two or more races(% change since 2000)
Races - Other race alone (%)
Races - Other race alone (% change since 2000)
Racial diversity
Place of birth - Born in state of residence (%)
Place of birth - Born in state of residence (%) - White
Place of birth - Born in state of residence (%) - Black or African American
Place of birth - Born in state of residence (%) - Asian
Place of birth - Born in state of residence (%) - Hispanic or Latino
Place of birth - Born in state of residence (%) - American Indian and Alaska Native
Place of birth - Born in state of residence (%) - Multirace
Place of birth - Born in state of residence (%) - Other Race
Place of birth - Born in other state (%)
Place of birth - Born in other state (%) - White
Place of birth - Born in other state (%) - Black or African American
Place of birth - Born in other state (%) - Asian
Place of birth - Born in other state (%) - Hispanic or Latino
Place of birth - Born in other state (%) - American Indian and Alaska Native
Place of birth - Born in other state (%) - Multirace
Place of birth - Born in other state (%) - Other Race
Place of birth - Native, outside of US (%)
Place of birth - Native, outside of US (%) - White
Place of birth - Native, outside of US (%) - Black or African American
Place of birth - Native, outside of US (%) - Asian
Place of birth - Native, outside of US (%) - Hispanic or Latino
Place of birth - Native, outside of US (%) - American Indian and Alaska Native
Place of birth - Native, outside of US (%) - Multirace
Place of birth - Native, outside of US (%) - Other Race
Place of birth - Foreign born (%)
Place of birth - Foreign born (%) - White
Place of birth - Foreign born (%) - Black or African American
Place of birth - Foreign born (%) - Asian
Place of birth - Foreign born (%) - Hispanic or Latino
Place of birth - Foreign born (%) - American Indian and Alaska Native
Place of birth - Foreign born (%) - Multirace
Place of birth - Foreign born (%) - Other Race
Residents speaking English at home (%)
Residents speaking English at home - Born in the United States (%)
Residents speaking English at home - Native, born elsewhere (%)
Residents speaking English at home - Foreign born (%)
Residents speaking Spanish at home (%)
Residents speaking Spanish at home - Born in the United States (%)
Residents speaking Spanish at home - Native, born elsewhere (%)
Residents speaking Spanish at home - Foreign born (%)
Residents speaking other language at home (%)
Residents speaking other language at home - Born in the United States (%)
Residents speaking other language at home - Native, born elsewhere (%)
Residents speaking other language at home - Foreign born (%)
Marital status - Never married (%)
Marital status - Now married (%)
Marital status - Separated (%)
Marital status - Widowed (%)
Marital status - Divorced (%)
Ancestries Reported - Arab (%)
Ancestries Reported - Czech (%)
Ancestries Reported - Danish (%)
Ancestries Reported - Dutch (%)
Ancestries Reported - English (%)
Ancestries Reported - French (%)
Ancestries Reported - French Canadian (%)
Ancestries Reported - German (%)
Ancestries Reported - Greek (%)
Ancestries Reported - Hungarian (%)
Ancestries Reported - Irish (%)
Ancestries Reported - Italian (%)
Ancestries Reported - Lithuanian (%)
Ancestries Reported - Norwegian (%)
Ancestries Reported - Polish (%)
Ancestries Reported - Portuguese (%)
Ancestries Reported - Russian (%)
Ancestries Reported - Scotch-Irish (%)
Ancestries Reported - Scottish (%)
Ancestries Reported - Slovak (%)
Ancestries Reported - Subsaharan African (%)
Ancestries Reported - Swedish (%)
Ancestries Reported - Swiss (%)
Ancestries Reported - Ukrainian (%)
Ancestries Reported - United States (%)
Ancestries Reported - Welsh (%)
Ancestries Reported - West Indian (%)
Ancestries Reported - Other (%)
Geographical mobility - Same house 1 year ago (%)
Geographical mobility - Same house 1 year ago (%) - White
Geographical mobility - Same house 1 year ago (%) - Black or African American
Geographical mobility - Same house 1 year ago (%) - Asian
Geographical mobility - Same house 1 year ago (%) - Hispanic or Latino
Geographical mobility - Same house 1 year ago (%) - American Indian and Alaska Native
Geographical mobility - Same house 1 year ago (%) - Multirace
Geographical mobility - Same house 1 year ago (%) - Other Race
Geographical mobility - Moved within same county (%)
Geographical mobility - Moved within same county (%) - White
Geographical mobility - Moved within same county (%) - Black or African American
Geographical mobility - Moved within same county (%) - Asian
Geographical mobility - Moved within same county (%) - Hispanic or Latino
Geographical mobility - Moved within same county (%) - American Indian and Alaska Native
Geographical mobility - Moved within same county (%) - Multirace
Geographical mobility - Moved within same county (%) - Other Race
Geographical mobility - Moved from different county within same state (%)
Geographical mobility - Moved from different county within same state (%) - White
Geographical mobility - Moved from different county within same state (%) - Black or African American
Geographical mobility - Moved from different county within same state (%) - Asian
Geographical mobility - Moved from different county within same state (%) - Hispanic or Latino
Geographical mobility - Moved from different county within same state (%) - American Indian and Alaska Native
Geographical mobility - Moved from different county within same state (%) - Multirace
Geographical mobility - Moved from different county within same state (%) - Other Race
Geographical mobility - Moved from different state (%)
Geographical mobility - Moved from different state (%) - White
Geographical mobility - Moved from different state (%) - Black or African American
Geographical mobility - Moved from different state (%) - Asian
Geographical mobility - Moved from different state (%) - Hispanic or Latino
Geographical mobility - Moved from different state (%) - American Indian and Alaska Native
Geographical mobility - Moved from different state (%) - Multirace
Geographical mobility - Moved from different state (%) - Other Race
Geographical mobility - Moved from abroad (%)
Geographical mobility - Moved from abroad (%) - White
Geographical mobility - Moved from abroad (%) - Black or African American
Geographical mobility - Moved from abroad (%) - Asian
Geographical mobility - Moved from abroad (%) - Hispanic or Latino
Geographical mobility - Moved from abroad (%) - American Indian and Alaska Native
Geographical mobility - Moved from abroad (%) - Multirace
Geographical mobility - Moved from abroad (%) - Other Race
Place of birth for the foreign-born population - Ireland (%)
Place of birth for the foreign-born population - Denmark (%)
Place of birth for the foreign-born population - Norway (%)
Place of birth for the foreign-born population - Sweden (%)
Place of birth for the foreign-born population - United Kingdom (%)
Place of birth for the foreign-born population - England (%)
Place of birth for the foreign-born population - Scotland (%)
Place of birth for the foreign-born population - Other Northern Europe (%)
Place of birth for the foreign-born population - Austria (%)
Place of birth for the foreign-born population - Belgium (%)
Place of birth for the foreign-born population - France (%)
Place of birth for the foreign-born population - Germany (%)
Place of birth for the foreign-born population - Netherlands (%)
Place of birth for the foreign-born population - Switzerland (%)
Place of birth for the foreign-born population - Other Western Europe (%)
Place of birth for the foreign-born population - Greece (%)
Place of birth for the foreign-born population - Italy (%)
Place of birth for the foreign-born population - Portugal (%)
Place of birth for the foreign-born population - Spain (%)
Place of birth for the foreign-born population - Other Southern Europe (%)
Place of birth for the foreign-born population - Albania (%)
Place of birth for the foreign-born population - Belarus (%)
Place of birth for the foreign-born population - Bosnia and Herzegovina (%)
Place of birth for the foreign-born population - Bulgaria (%)
Place of birth for the foreign-born population - Croatia (%)
Place of birth for the foreign-born population - Czechoslovakia (%)
Place of birth for the foreign-born population - Hungary (%)
Place of birth for the foreign-born population - Latvia (%)
Place of birth for the foreign-born population - Lithuania (%)
Place of birth for the foreign-born population - North Macedonia (Macedonia) (%)
Place of birth for the foreign-born population - Moldova (%)
Place of birth for the foreign-born population - Poland (%)
Place of birth for the foreign-born population - Romania (%)
Place of birth for the foreign-born population - Russia (%)
Place of birth for the foreign-born population - Serbia (%)
Place of birth for the foreign-born population - Ukraine (%)
Place of birth for the foreign-born population - Other Eastern Europe (%)
Place of birth for the foreign-born population - China (%)
Place of birth for the foreign-born population - Hong Kong (%)
Place of birth for the foreign-born population - Taiwan (%)
Place of birth for the foreign-born population - Japan (%)
Place of birth for the foreign-born population - Korea (%)
Place of birth for the foreign-born population - Other Eastern Asia (%)
Place of birth for the foreign-born population - Afghanistan (%)
Place of birth for the foreign-born population - Bangladesh (%)
Place of birth for the foreign-born population - India (%)
Place of birth for the foreign-born population - Iran (%)
Place of birth for the foreign-born population - Kazakhstan (%)
Place of birth for the foreign-born population - Nepal (%)
Place of birth for the foreign-born population - Pakistan (%)
Place of birth for the foreign-born population - Sri Lanka (%)
Place of birth for the foreign-born population - Uzbekistan (%)
Place of birth for the foreign-born population - Other South Central Asia (%)
Place of birth for the foreign-born population - Burma (%)
Place of birth for the foreign-born population - Cambodia (%)
Place of birth for the foreign-born population - Indonesia (%)
Place of birth for the foreign-born population - Laos (%)
Place of birth for the foreign-born population - Malaysia (%)
Place of birth for the foreign-born population - Philippines (%)
Place of birth for the foreign-born population - Singapore (%)
Place of birth for the foreign-born population - Thailand (%)
Place of birth for the foreign-born population - Vietnam (%)
Place of birth for the foreign-born population - Other South Eastern Asia (%)
Place of birth for the foreign-born population - Armenia (%)
Place of birth for the foreign-born population - Iraq (%)
Place of birth for the foreign-born population - Israel (%)
Place of birth for the foreign-born population - Jordan (%)
Place of birth for the foreign-born population - Kuwait (%)
Place of birth for the foreign-born population - Lebanon (%)
Place of birth for the foreign-born population - Saudi Arabia (%)
Place of birth for the foreign-born population - Syria (%)
Place of birth for the foreign-born population - Turkey (%)
Place of birth for the foreign-born population - Yemen (%)
Place of birth for the foreign-born population - Other Western Asia (%)
Place of birth for the foreign-born population - Eritrea (%)
Place of birth for the foreign-born population - Ethiopia (%)
Place of birth for the foreign-born population - Kenya (%)
Place of birth for the foreign-born population - Somalia (%)
Place of birth for the foreign-born population - Uganda (%)
Place of birth for the foreign-born population - Zimbabwe (%)
Place of birth for the foreign-born population - Other Eastern Africa (%)
Place of birth for the foreign-born population - Cameroon (%)
Place of birth for the foreign-born population - Congo (%)
Place of birth for the foreign-born population - Democratic Republic of Congo (Zaire) (%)
Place of birth for the foreign-born population - Other Middle Africa (%)
Place of birth for the foreign-born population - Egypt (%)
Place of birth for the foreign-born population - Morocco (%)
Place of birth for the foreign-born population - Sudan (%)
Place of birth for the foreign-born population - Other Northern Africa (%)
Place of birth for the foreign-born population - South Africa (%)
Place of birth for the foreign-born population - Other Southern Africa (%)
Place of birth for the foreign-born population - Cabo Verde (%)
Place of birth for the foreign-born population - Ghana (%)
Place of birth for the foreign-born population - Liberia (%)
Place of birth for the foreign-born population - Nigeria (%)
Place of birth for the foreign-born population - Senegal (%)
Place of birth for the foreign-born population - Sierra Leone (%)
Place of birth for the foreign-born population - Other Western Africa (%)
Place of birth for the foreign-born population - Australia (%)
Place of birth for the foreign-born population - New Zealand (%)
Place of birth for the foreign-born population - Fiji (%)
Place of birth for the foreign-born population - Micronesia (%)
Place of birth for the foreign-born population - Bahamas (%)
Place of birth for the foreign-born population - Barbados (%)
Place of birth for the foreign-born population - Cuba (%)
Place of birth for the foreign-born population - Dominica (%)
Place of birth for the foreign-born population - Dominican Republic (%)
Place of birth for the foreign-born population - Grenada (%)
Place of birth for the foreign-born population - Haiti (%)
Place of birth for the foreign-born population - Jamaica (%)
Place of birth for the foreign-born population - St. Vincent and the Grenadines (%)
Place of birth for the foreign-born population - Trinidad and Tobago (%)
Place of birth for the foreign-born population - West Indies (%)
Place of birth for the foreign-born population - Other Caribbean (%)
Place of birth for the foreign-born population - Belize (%)
Place of birth for the foreign-born population - Costa Rica (%)
Place of birth for the foreign-born population - El Salvador (%)
Place of birth for the foreign-born population - Guatemala (%)
Place of birth for the foreign-born population - Honduras (%)
Place of birth for the foreign-born population - Mexico (%)
Place of birth for the foreign-born population - Nicaragua (%)
Place of birth for the foreign-born population - Panama (%)
Place of birth for the foreign-born population - Other Central America (%)
Place of birth for the foreign-born population - Argentina (%)
Place of birth for the foreign-born population - Bolivia (%)
Place of birth for the foreign-born population - Brazil (%)
Place of birth for the foreign-born population - Chile (%)
Place of birth for the foreign-born population - Colombia (%)
Place of birth for the foreign-born population - Ecuador (%)
Place of birth for the foreign-born population - Guyana (%)
Place of birth for the foreign-born population - Peru (%)
Place of birth for the foreign-born population - Uruguay (%)
Place of birth for the foreign-born population - Venezuela (%)
Place of birth for the foreign-born population - Other South America (%)
Place of birth for the foreign-born population - Canada (%)
Place of birth for the foreign-born population - Other Northern America (%)
Place of birth for the foreign-born population - Other (%)
Latest news about races in Norcross, GA collected exclusively by city-data.com from local newspapers, TV, and radio stations
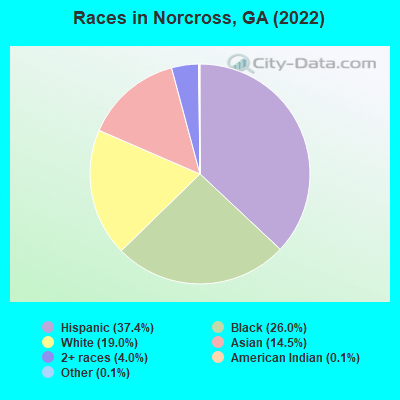
According to 2022 data, the most numerous races in Norcross, GA are White alone (3,394 residents), Black alone (4,637 residents), and Hispanic (6,671 residents). 52.1% of Norcross residents speak English at home. 30.9% of Norcross, GA residents are foreign-born (18.1% born in Latin America, 10.1% born in Asia), which is 67.7% greater than the foreign-born rate of 10.0% across the entire state of Georgia.
Race distribution in Norcross
2000 2022
5,128,661 62.6% White alone 2,331,465 28.5% Black alone 435,227 5.3% Hispanic 171,513 2.1% Asian alone 87,364 1.1% Two or more races 17,670 0.2% American Indian alone 11,275 0.1% Other race alone 3,278 0.04% Native Hawaiian and Other
5,415,657 49.6% White alone 3,349,240 30.7% Black alone 1,132,604 10.4% Hispanic 479,156 4.4% Asian alone 462,923 4.2% Two or more races 54,416 0.5% Other race alone 11,923 0.1% American Indian alone 6,957 0.06% Native Hawaiian and Other
Income and house value in Norcross Median household income in 2022 $109,977 White non-Hispanic householders$66,897 Black householders$87,180 Asian householders$57,113 Some other race householders$53,124 Two or more races householders$57,021 Hispanic or Latino race householdersMedian 2022 house value $455,699 White Non-Hispanic householders$403,194 Black or African American householders $436,216 Asian householders$359,606 Some other race householders$313,705 Two or more races householders$345,736 Hispanic or Latino householders
Median age by race in Norcross
46.4 Median age for White residents42.6 55.2 33.4 Median age for Black or African American residents34.9 32.0 38.1 Median age for American Indian / Alaska Native residents-574,468,084.5 42.6 39.4 Median age for Asian residents40.0 39.4 -1,080,291,969.7 Median age for Native Hawaiian / Pacific Islander residents-1,248,062,014.3 -776,776,776.0 24.4 Median age for Other race residents21.6 28.3 31.9 Median age for Two or more races residents23.4 35.9 51.5 Median age for White alone residents49.5 58.4 26.4 Median age for Hispanic or Latino residents23.1 28.5
Owner/renter occupied households by race in Norcross
House owners and renters - White residents 1,603 79.5% Owner occupied413 20.5% Renter occupiedHouse owners and renters - Black or African American residents 867 40.3% Owner occupied1,285 59.7% Renter occupiedHouse owners and renters - American Indian / Alaska Native residents 15 100.0% Owner occupiedHouse owners and renters - Asian residents 718 82.1% Owner occupied156 17.9% Renter occupiedHouse owners and renters - Other race residents 300 31.6% Owner occupied650 68.4% Renter occupiedHouse owners and renters - Two or more races residents 300 35.9% Owner occupied536 64.1% Renter occupiedHouse owners and renters - White alone residents 1,510 84.1% Owner occupied285 15.9% Renter occupiedHouse owners and renters - Hispanic or Latino residents 748 40.3% Owner occupied1,108 59.7% Renter occupied
Language usage in Norcross
English speakers - Total 52.1% of residents of Norcross speak English at home.
31.9% of residents speak Spanish at home 2,046 38.4% Speak English very well3,286 61.6% Speak English less than very well15.9% of residents speak other language at home 1,375 51.8% Speak English very well1,282 48.2% Speak English less than very well
English speakers - Born in the United States 87.9% of residents of Norcross speak English at home.
7.2% of residents speak Spanish at home 155 50.3% Speak English very well153 49.7% Speak English less than very well5.2% of residents speak other language at home 175 78.8% Speak English very well47 21.2% Speak English less than very well
English speakers - Native, born elsewhere 58.9% of residents of Norcross speak English at home.
25.0% of residents speak Spanish at home 80 72.7% Speak English very well30 27.3% Speak English less than very well13.6% of residents speak other language at home 28 46.7% Speak English very well32 53.3% Speak English less than very well
English speakers - Foreign-born 7.7% of residents of Norcross speak English at home.
55.6% of residents speak Spanish at home 640 20.7% Speak English very well2,452 79.3% Speak English less than very well36.5% of residents speak other language at home 919 45.2% Speak English very well1,112 54.8% Speak English less than very well
White (Caucasian) - Speak only English Native:
85.1% (3,211)Foreign-born:
6.1% (24)
White (Caucasian) - Speak another language Native:
13.3% (503)Foreign-born:
91.7% (356)
Black or African American - Speak only English Native:
96.7% (4,130)Foreign-born:
25.8% (144)
Black or African American - Speak another language Native:
3.3% (143)Foreign-born:
70.6% (393)
Asian - Speak only English Native:
43.1% (287)Foreign-born:
9.0% (166)
Asian - Speak another language Native:
56.1% (374)Foreign-born:
90.8% (1,671)
Other race - Speak only English Native:
13.0% (197)Foreign-born:
3.5% (80)
Other race - Speak another language Native:
87.1% (1,318)Foreign-born:
96.4% (2,202)
Two or more races - Speak only English Native:
40.9% (485)Foreign-born:
2.9% (26)
Two or more races - Speak another language Native:
55.6% (659)Foreign-born:
98.4% (873)
White alone - Speak only English Native:
95.9% (3,037)Foreign-born:
14.4% (24)
White alone - Speak another language Native:
4.1% (130)Foreign-born:
86.8% (147)
Hispanic or Latino - Speak only English Native:
20.1% (570)Foreign-born:
3.5% (113)
Hispanic or Latino - Speak another language Native:
78.9% (2,235)Foreign-born:
96.4% (3,085)
Foreign-born residents in Norcross 5,523 residents are foreign born (18.1% Latin America , 10.1% Asia ).
This city:
30.9%Georgia:
10.4%
Marital status for residents in Norcross Marital status - White (Caucasian) population 15 years and over
Males 34.2% Never married58.8% Now married0.0% Separated0.0% Widowed7.0% DivorcedFemales 13.9% Never married54.8% Now married2.8% Separated17.0% Widowed11.5% DivorcedWomen who gave birth in the past 12 months Now married:
100.0% (43)Unmarried:
0.0% (0)
Women who did not give birth in the past 12 months Now married:
52.3% (287)Unmarried:
47.7% (261)
Marital status - Black or African American population 15 years and over
Males 49.8% Never married44.6% Now married0.0% Separated0.0% Widowed5.7% DivorcedFemales 39.8% Never married43.1% Now married1.9% Separated3.3% Widowed12.0% DivorcedWomen who gave birth in the past 12 months Now married:
100.0% (84)Unmarried:
0.0% (0)
Women who did not give birth in the past 12 months Now married:
41.6% (588)Unmarried:
58.4% (824)
Marital status - American Indian / Alaska Native population 15 years and over
Males 0.0% Never married35.0% Now married0.0% Separated65.0% Widowed0.0% DivorcedFemales 93.2% Never married6.8% Now married0.0% Separated0.0% Widowed0.0% DivorcedWomen who did not give birth in the past 12 months Now married:
0.0% (0)Unmarried:
100.0% (65)
Marital status - Asian population 15 years and over
Males 23.9% Never married73.8% Now married0.0% Separated0.0% Widowed2.3% DivorcedFemales 19.1% Never married65.7% Now married0.0% Separated3.6% Widowed11.6% DivorcedWomen who gave birth in the past 12 months Now married:
100.0% (21)Unmarried:
0.0% (0)
Women who did not give birth in the past 12 months Now married:
68.1% (582)Unmarried:
31.9% (272)
Marital status - Other race population 15 years and over
Males 44.6% Never married52.8% Now married0.0% Separated0.0% Widowed2.6% DivorcedFemales 30.8% Never married53.3% Now married7.9% Separated5.2% Widowed2.7% DivorcedWomen who gave birth in the past 12 months Now married:
100.0% (80)Unmarried:
0.0% (0)
Women who did not give birth in the past 12 months Now married:
67.1% (728)Unmarried:
32.9% (357)
Marital status - Two or more races population 15 years and over
Males 59.4% Never married36.7% Now married0.0% Separated0.0% Widowed3.9% DivorcedFemales 21.5% Never married41.5% Now married26.9% Separated3.3% Widowed6.8% DivorcedWomen who gave birth in the past 12 months Now married:
42.2% (24)Unmarried:
57.8% (33)
Women who did not give birth in the past 12 months Now married:
74.6% (529)Unmarried:
25.4% (180)
Marital status - White alone, not Hispanic / Latino population 15 years and over
Males 21.8% Never married69.6% Now married0.0% Separated0.0% Widowed8.6% DivorcedFemales 8.9% Never married60.2% Now married0.7% Separated17.2% Widowed13.1% DivorcedWomen who gave birth in the past 12 months Now married:
100.0% (48)Unmarried:
0.0% (0)
Women who did not give birth in the past 12 months Now married:
57.9% (227)Unmarried:
42.1% (165)
Marital status - Hispanic or Latino population 15 years and over
Males 51.1% Never married46.6% Now married0.0% Separated0.0% Widowed2.3% DivorcedFemales 32.8% Never married43.8% Now married14.3% Separated7.0% Widowed2.1% DivorcedWomen who gave birth in the past 12 months Now married:
100.0% (73)Unmarried:
0.0% (0)
Women who did not give birth in the past 12 months Now married:
61.7% (1,100)Unmarried:
38.3% (684)
Ancestries in Norcross
343 2.6% American301 2.3% English138 1.1% European133 1.0% Haitian117 0.9% Scottish111 0.8% Irish107 0.8% Jamaican105 0.8% German78 0.6% French67 0.5% Ghanaian59 0.5% Belizean50 0.4% Swiss49 0.4% Ethiopian48 0.4% Italian41 0.3% South African38 0.3% Afghan34 0.3% Scotch-Irish28 0.2% African26 0.2% Polish24 0.2% Welsh14 0.1% Norwegian12 0.09% Armenian9 0.07% Danish9 0.07% Greek9 0.07% Russian8 0.06% French Canadian8 0.06% Yugoslavian6 0.05% Croatian4 0.03% Swedish
Geographical mobility in Norcross Same house 1 year ago 3,794 89.7% White (Caucasian)4,607 93.0% Black or African American52 56.0% American Indian / Alaska Native2,320 89.9% Asian3,974 93.8% Other race2,166 92.4% Two or more races2,933 87.2% White alone, not Hispanic / Latino6,174 94.1% Hispanic or LatinoMoved within same county 114 2.7% White / Caucasian247 5.0% Black or African American32 1.2% Asian31 0.7% Other race47 2.0% Two or more races138 4.1% White alone, not Hispanic / Latino78 1.2% Hispanic or LatinoMoved within same state 246 5.8% White / Caucasian47 1.0% Black or African American43 1.7% Asian45 1.1% Other race19 0.8% Two or more races197 5.9% White alone, not Hispanic / Latino102 1.6% Hispanic or LatinoMoved from different state 78 1.8% White / Caucasian56 1.1% Black or African American43 46.1% American Indian / Alaska Native285 11.0% Asian96 4.1% Two or more races83 2.5% White alone, not Hispanic / Latino43 0.7% Hispanic or LatinoMoved from abroad 36 0.7% Black or African American100 2.4% Other race133 2.0% Hispanic or Latino
Children Nativity (place of birth) in Norcross
Children under 6 years - Living with two parents Both parents native 297 99.9% Native0 0.1% Foreign-bornBoth parents foreign-born 404 96.4% Native15 3.6% Foreign-bornOne native, one foreign-born parent 73 100.0% NativeChildren under 6 years - Living with one parent Native parent 104 100.0% NativeForeign-born parent 341 100.0% NativeChildren 6 to 17 years - Living with two parents Both parents native 892 100.0% NativeBoth parents foreign-born 963 79.4% Native250 20.6% Foreign-bornOne native, one foreign-born parent 74 100.0% NativeChildren 6 to 17 years - Living with one parent Native parent 224 100.0% NativeForeign-born parent 630 55.0% Native515 45.0% Foreign-born
Grandparents responsible for own grandchildren in Norcross
Grandparents (30 to 59 years) White / Caucasian 22 100.0% Not responsible for grandchildrenBlack or African American 43 100.0% Not responsible for grandchildrenAsian 25 100.0% Not responsible for grandchildrenOther race 68 100.0% Not responsible for grandchildrenHispanic or Latino 111 100.0% Not responsible for grandchildrenGrandparents (60 years and over) White / Caucasian 28 78.0% Responsible for grandchildren8 22.0% Not responsible for grandchildrenBlack or African American 108 100.0% Not responsible for grandchildrenAsian 116 100.0% Not responsible for grandchildrenOther race 35 100.0% Not responsible for grandchildrenHispanic or Latino 5 8.8% Responsible for grandchildren49 91.2% Not responsible for grandchildren