Races in New Tulsa, Oklahoma (OK) Detailed Stats
Ancestries, Foreign-born residents, place of birth

Recent posts about races in New Tulsa, Oklahoma on our local forum with over 2,400,000 registered users:
 | Relocating to Tulsa - HELP PLEASE!! (20 replies) |
2.3% of New Tulsa, OK residents are foreign-born (1.8% born in Latin America, 0.5% born in Europe), which is 162.2% less than the foreign-born rate of 6.0% across the entire state of Oklahoma.
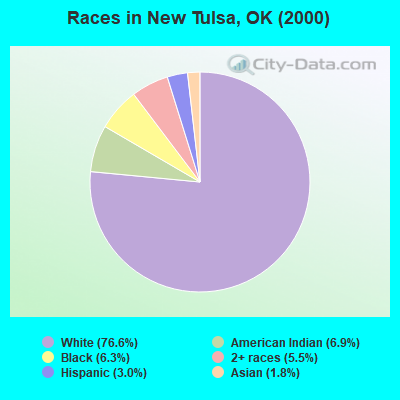
Race distribution in New Tulsa

- 43576.6%White alone
- 396.9%American Indian alone
- 366.3%Black alone
- 315.5%Two or more races
- 173.0%Hispanic
- 101.8%Asian alone
2000
2022
-
- 2,556,36874.1%White alone
- 266,1587.7%American Indian alone
- 257,9817.5%Black alone
- 179,3045.2%Hispanic
- 140,2494.1%Two or more races
- 46,1721.3%Asian alone
- 2,3220.07%Other race alone
- 2,1000.06%Native Hawaiian and Other
Pacific Islander alone

-
- 2,517,40362.6%White alone
- 486,69212.1%Hispanic
- 364,4539.1%Two or more races
- 273,6506.8%American Indian alone
- 268,5436.7%Black alone
- 92,6722.3%Asian alone
- 10,7860.3%Other race alone
- 5,6010.1%Native Hawaiian and Other
Pacific Islander alone

Income and house value in New Tulsa
- Median household income in 2022
- $70,301White non-Hispanic householders
- $76,677Black householders
- $63,750American Indian and Alaska Native householders
- $78,272Two or more races householders
- $38,177Hispanic or Latino race householders
- Median 2022 house value
- $216,139White Non-Hispanic householders
- $124,536American Indian or Alaska Native householders
- $207,560Two or more races householders
Household income for White non-Hispanic householders

Household income for Black householders

Household income for American Indian and Alaska Native householders

Household income for Two or more races householders

Household income for Hispanic or Latino race householders

Foreign-born residents in New Tulsa
13 residents are foreign born (1.8% Latin America, 0.5% Europe).
| This city: | 2.3% |
| Oklahoma: | 3.8% |
Ancestries in New Tulsa

- 22442.4%Other
- 8415.9%German
- 8015.2%Irish
- 264.9%United States
- 234.4%Dutch
- 234.4%French
- 193.6%Italian
- 163.0%English
- 91.7%Swedish
- 71.3%Polish
- 40.8%French Canadian
- 30.6%Portuguese
- 30.6%Scotch-Irish
- 20.4%Czech
- 20.4%Welsh
- 20.4%West Indian
- 10.2%Russian

Zip codes: 74014.