Races in New Port Richey East, Florida (FL) Detailed Stats
Data:
Races - White alone (%)
Races - White alone (% change since 2000)
Races - Black alone (%)
Races - Black alone (% change since 2000)
Races - American Indian alone (%)
Races - American Indian alone (% change since 2000)
Races - Asian alone (%)
Races - Asian alone (% change since 2000)
Races - Hispanic (%)
Races - Hispanic (% change since 2000)
Races - Native Hawaiian and Other Pacific Islander alone (%)
Races - Native Hawaiian and Other Pacific Islander alone (% change since 2000)
Races - Two or more races(%)
Races - Two or more races(% change since 2000)
Races - Other race alone (%)
Races - Other race alone (% change since 2000)
Racial diversity
Place of birth - Born in state of residence (%)
Place of birth - Born in state of residence (%) - White
Place of birth - Born in state of residence (%) - Black or African American
Place of birth - Born in state of residence (%) - Asian
Place of birth - Born in state of residence (%) - Hispanic or Latino
Place of birth - Born in state of residence (%) - American Indian and Alaska Native
Place of birth - Born in state of residence (%) - Multirace
Place of birth - Born in state of residence (%) - Other Race
Place of birth - Born in other state (%)
Place of birth - Born in other state (%) - White
Place of birth - Born in other state (%) - Black or African American
Place of birth - Born in other state (%) - Asian
Place of birth - Born in other state (%) - Hispanic or Latino
Place of birth - Born in other state (%) - American Indian and Alaska Native
Place of birth - Born in other state (%) - Multirace
Place of birth - Born in other state (%) - Other Race
Place of birth - Native, outside of US (%)
Place of birth - Native, outside of US (%) - White
Place of birth - Native, outside of US (%) - Black or African American
Place of birth - Native, outside of US (%) - Asian
Place of birth - Native, outside of US (%) - Hispanic or Latino
Place of birth - Native, outside of US (%) - American Indian and Alaska Native
Place of birth - Native, outside of US (%) - Multirace
Place of birth - Native, outside of US (%) - Other Race
Place of birth - Foreign born (%)
Place of birth - Foreign born (%) - White
Place of birth - Foreign born (%) - Black or African American
Place of birth - Foreign born (%) - Asian
Place of birth - Foreign born (%) - Hispanic or Latino
Place of birth - Foreign born (%) - American Indian and Alaska Native
Place of birth - Foreign born (%) - Multirace
Place of birth - Foreign born (%) - Other Race
Residents speaking English at home (%)
Residents speaking English at home - Born in the United States (%)
Residents speaking English at home - Native, born elsewhere (%)
Residents speaking English at home - Foreign born (%)
Residents speaking Spanish at home (%)
Residents speaking Spanish at home - Born in the United States (%)
Residents speaking Spanish at home - Native, born elsewhere (%)
Residents speaking Spanish at home - Foreign born (%)
Residents speaking other language at home (%)
Residents speaking other language at home - Born in the United States (%)
Residents speaking other language at home - Native, born elsewhere (%)
Residents speaking other language at home - Foreign born (%)
Marital status - Never married (%)
Marital status - Now married (%)
Marital status - Separated (%)
Marital status - Widowed (%)
Marital status - Divorced (%)
Ancestries Reported - Arab (%)
Ancestries Reported - Czech (%)
Ancestries Reported - Danish (%)
Ancestries Reported - Dutch (%)
Ancestries Reported - English (%)
Ancestries Reported - French (%)
Ancestries Reported - French Canadian (%)
Ancestries Reported - German (%)
Ancestries Reported - Greek (%)
Ancestries Reported - Hungarian (%)
Ancestries Reported - Irish (%)
Ancestries Reported - Italian (%)
Ancestries Reported - Lithuanian (%)
Ancestries Reported - Norwegian (%)
Ancestries Reported - Polish (%)
Ancestries Reported - Portuguese (%)
Ancestries Reported - Russian (%)
Ancestries Reported - Scotch-Irish (%)
Ancestries Reported - Scottish (%)
Ancestries Reported - Slovak (%)
Ancestries Reported - Subsaharan African (%)
Ancestries Reported - Swedish (%)
Ancestries Reported - Swiss (%)
Ancestries Reported - Ukrainian (%)
Ancestries Reported - United States (%)
Ancestries Reported - Welsh (%)
Ancestries Reported - West Indian (%)
Ancestries Reported - Other (%)
Geographical mobility - Same house 1 year ago (%)
Geographical mobility - Same house 1 year ago (%) - White
Geographical mobility - Same house 1 year ago (%) - Black or African American
Geographical mobility - Same house 1 year ago (%) - Asian
Geographical mobility - Same house 1 year ago (%) - Hispanic or Latino
Geographical mobility - Same house 1 year ago (%) - American Indian and Alaska Native
Geographical mobility - Same house 1 year ago (%) - Multirace
Geographical mobility - Same house 1 year ago (%) - Other Race
Geographical mobility - Moved within same county (%)
Geographical mobility - Moved within same county (%) - White
Geographical mobility - Moved within same county (%) - Black or African American
Geographical mobility - Moved within same county (%) - Asian
Geographical mobility - Moved within same county (%) - Hispanic or Latino
Geographical mobility - Moved within same county (%) - American Indian and Alaska Native
Geographical mobility - Moved within same county (%) - Multirace
Geographical mobility - Moved within same county (%) - Other Race
Geographical mobility - Moved from different county within same state (%)
Geographical mobility - Moved from different county within same state (%) - White
Geographical mobility - Moved from different county within same state (%) - Black or African American
Geographical mobility - Moved from different county within same state (%) - Asian
Geographical mobility - Moved from different county within same state (%) - Hispanic or Latino
Geographical mobility - Moved from different county within same state (%) - American Indian and Alaska Native
Geographical mobility - Moved from different county within same state (%) - Multirace
Geographical mobility - Moved from different county within same state (%) - Other Race
Geographical mobility - Moved from different state (%)
Geographical mobility - Moved from different state (%) - White
Geographical mobility - Moved from different state (%) - Black or African American
Geographical mobility - Moved from different state (%) - Asian
Geographical mobility - Moved from different state (%) - Hispanic or Latino
Geographical mobility - Moved from different state (%) - American Indian and Alaska Native
Geographical mobility - Moved from different state (%) - Multirace
Geographical mobility - Moved from different state (%) - Other Race
Geographical mobility - Moved from abroad (%)
Geographical mobility - Moved from abroad (%) - White
Geographical mobility - Moved from abroad (%) - Black or African American
Geographical mobility - Moved from abroad (%) - Asian
Geographical mobility - Moved from abroad (%) - Hispanic or Latino
Geographical mobility - Moved from abroad (%) - American Indian and Alaska Native
Geographical mobility - Moved from abroad (%) - Multirace
Geographical mobility - Moved from abroad (%) - Other Race
Place of birth for the foreign-born population - Ireland (%)
Place of birth for the foreign-born population - Denmark (%)
Place of birth for the foreign-born population - Norway (%)
Place of birth for the foreign-born population - Sweden (%)
Place of birth for the foreign-born population - United Kingdom (%)
Place of birth for the foreign-born population - England (%)
Place of birth for the foreign-born population - Scotland (%)
Place of birth for the foreign-born population - Other Northern Europe (%)
Place of birth for the foreign-born population - Austria (%)
Place of birth for the foreign-born population - Belgium (%)
Place of birth for the foreign-born population - France (%)
Place of birth for the foreign-born population - Germany (%)
Place of birth for the foreign-born population - Netherlands (%)
Place of birth for the foreign-born population - Switzerland (%)
Place of birth for the foreign-born population - Other Western Europe (%)
Place of birth for the foreign-born population - Greece (%)
Place of birth for the foreign-born population - Italy (%)
Place of birth for the foreign-born population - Portugal (%)
Place of birth for the foreign-born population - Spain (%)
Place of birth for the foreign-born population - Other Southern Europe (%)
Place of birth for the foreign-born population - Albania (%)
Place of birth for the foreign-born population - Belarus (%)
Place of birth for the foreign-born population - Bosnia and Herzegovina (%)
Place of birth for the foreign-born population - Bulgaria (%)
Place of birth for the foreign-born population - Croatia (%)
Place of birth for the foreign-born population - Czechoslovakia (%)
Place of birth for the foreign-born population - Hungary (%)
Place of birth for the foreign-born population - Latvia (%)
Place of birth for the foreign-born population - Lithuania (%)
Place of birth for the foreign-born population - North Macedonia (Macedonia) (%)
Place of birth for the foreign-born population - Moldova (%)
Place of birth for the foreign-born population - Poland (%)
Place of birth for the foreign-born population - Romania (%)
Place of birth for the foreign-born population - Russia (%)
Place of birth for the foreign-born population - Serbia (%)
Place of birth for the foreign-born population - Ukraine (%)
Place of birth for the foreign-born population - Other Eastern Europe (%)
Place of birth for the foreign-born population - China (%)
Place of birth for the foreign-born population - Hong Kong (%)
Place of birth for the foreign-born population - Taiwan (%)
Place of birth for the foreign-born population - Japan (%)
Place of birth for the foreign-born population - Korea (%)
Place of birth for the foreign-born population - Other Eastern Asia (%)
Place of birth for the foreign-born population - Afghanistan (%)
Place of birth for the foreign-born population - Bangladesh (%)
Place of birth for the foreign-born population - India (%)
Place of birth for the foreign-born population - Iran (%)
Place of birth for the foreign-born population - Kazakhstan (%)
Place of birth for the foreign-born population - Nepal (%)
Place of birth for the foreign-born population - Pakistan (%)
Place of birth for the foreign-born population - Sri Lanka (%)
Place of birth for the foreign-born population - Uzbekistan (%)
Place of birth for the foreign-born population - Other South Central Asia (%)
Place of birth for the foreign-born population - Burma (%)
Place of birth for the foreign-born population - Cambodia (%)
Place of birth for the foreign-born population - Indonesia (%)
Place of birth for the foreign-born population - Laos (%)
Place of birth for the foreign-born population - Malaysia (%)
Place of birth for the foreign-born population - Philippines (%)
Place of birth for the foreign-born population - Singapore (%)
Place of birth for the foreign-born population - Thailand (%)
Place of birth for the foreign-born population - Vietnam (%)
Place of birth for the foreign-born population - Other South Eastern Asia (%)
Place of birth for the foreign-born population - Armenia (%)
Place of birth for the foreign-born population - Iraq (%)
Place of birth for the foreign-born population - Israel (%)
Place of birth for the foreign-born population - Jordan (%)
Place of birth for the foreign-born population - Kuwait (%)
Place of birth for the foreign-born population - Lebanon (%)
Place of birth for the foreign-born population - Saudi Arabia (%)
Place of birth for the foreign-born population - Syria (%)
Place of birth for the foreign-born population - Turkey (%)
Place of birth for the foreign-born population - Yemen (%)
Place of birth for the foreign-born population - Other Western Asia (%)
Place of birth for the foreign-born population - Eritrea (%)
Place of birth for the foreign-born population - Ethiopia (%)
Place of birth for the foreign-born population - Kenya (%)
Place of birth for the foreign-born population - Somalia (%)
Place of birth for the foreign-born population - Uganda (%)
Place of birth for the foreign-born population - Zimbabwe (%)
Place of birth for the foreign-born population - Other Eastern Africa (%)
Place of birth for the foreign-born population - Cameroon (%)
Place of birth for the foreign-born population - Congo (%)
Place of birth for the foreign-born population - Democratic Republic of Congo (Zaire) (%)
Place of birth for the foreign-born population - Other Middle Africa (%)
Place of birth for the foreign-born population - Egypt (%)
Place of birth for the foreign-born population - Morocco (%)
Place of birth for the foreign-born population - Sudan (%)
Place of birth for the foreign-born population - Other Northern Africa (%)
Place of birth for the foreign-born population - South Africa (%)
Place of birth for the foreign-born population - Other Southern Africa (%)
Place of birth for the foreign-born population - Cabo Verde (%)
Place of birth for the foreign-born population - Ghana (%)
Place of birth for the foreign-born population - Liberia (%)
Place of birth for the foreign-born population - Nigeria (%)
Place of birth for the foreign-born population - Senegal (%)
Place of birth for the foreign-born population - Sierra Leone (%)
Place of birth for the foreign-born population - Other Western Africa (%)
Place of birth for the foreign-born population - Australia (%)
Place of birth for the foreign-born population - New Zealand (%)
Place of birth for the foreign-born population - Fiji (%)
Place of birth for the foreign-born population - Micronesia (%)
Place of birth for the foreign-born population - Bahamas (%)
Place of birth for the foreign-born population - Barbados (%)
Place of birth for the foreign-born population - Cuba (%)
Place of birth for the foreign-born population - Dominica (%)
Place of birth for the foreign-born population - Dominican Republic (%)
Place of birth for the foreign-born population - Grenada (%)
Place of birth for the foreign-born population - Haiti (%)
Place of birth for the foreign-born population - Jamaica (%)
Place of birth for the foreign-born population - St. Vincent and the Grenadines (%)
Place of birth for the foreign-born population - Trinidad and Tobago (%)
Place of birth for the foreign-born population - West Indies (%)
Place of birth for the foreign-born population - Other Caribbean (%)
Place of birth for the foreign-born population - Belize (%)
Place of birth for the foreign-born population - Costa Rica (%)
Place of birth for the foreign-born population - El Salvador (%)
Place of birth for the foreign-born population - Guatemala (%)
Place of birth for the foreign-born population - Honduras (%)
Place of birth for the foreign-born population - Mexico (%)
Place of birth for the foreign-born population - Nicaragua (%)
Place of birth for the foreign-born population - Panama (%)
Place of birth for the foreign-born population - Other Central America (%)
Place of birth for the foreign-born population - Argentina (%)
Place of birth for the foreign-born population - Bolivia (%)
Place of birth for the foreign-born population - Brazil (%)
Place of birth for the foreign-born population - Chile (%)
Place of birth for the foreign-born population - Colombia (%)
Place of birth for the foreign-born population - Ecuador (%)
Place of birth for the foreign-born population - Guyana (%)
Place of birth for the foreign-born population - Peru (%)
Place of birth for the foreign-born population - Uruguay (%)
Place of birth for the foreign-born population - Venezuela (%)
Place of birth for the foreign-born population - Other South America (%)
Place of birth for the foreign-born population - Canada (%)
Place of birth for the foreign-born population - Other Northern America (%)
Place of birth for the foreign-born population - Other (%)
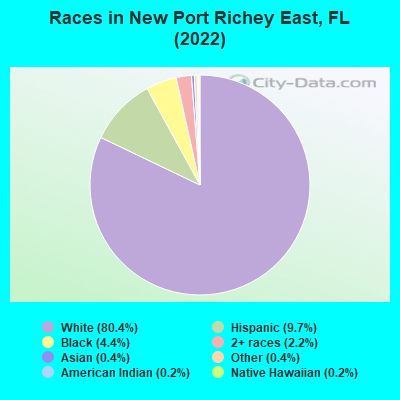
According to 2022 data, the most numerous races in New Port Richey East, FL are White alone (9,605 residents), Hispanic (1,164 residents), and Black alone (523 residents). 87.8% of New Port Richey East residents speak English at home. 6.3% of New Port Richey East, FL residents are foreign-born (3.4% born in Europe, 1.6% born in Latin America, 0.7% born in North America), which is 235.4% less than the foreign-born rate of 21.0% across the entire state of Florida.
Race distribution in New Port Richey East
2000 2022
10,458,509 65.4% White alone 2,682,715 16.8% Hispanic 2,264,268 14.2% Black alone 261,693 1.6% Asian alone 236,954 1.5% Two or more races 42,358 0.3% American Indian alone 28,994 0.2% Other race alone 6,887 0.04% Native Hawaiian and Other
11,309,403 50.8% White alone 6,025,039 27.1% Hispanic 3,241,015 14.6% Black alone 861,630 3.9% Two or more races 623,692 2.8% Asian alone 152,054 0.7% Other race alone 22,504 0.1% American Indian alone 9,486 0.04% Native Hawaiian and Other
Income and house value in New Port Richey East Median household income in 2022 $52,914 White non-Hispanic householders$34,508 Black householders$58,831 Two or more races householders$28,277 Hispanic or Latino race householdersMedian 2022 house value $229,666 White Non-Hispanic householders$338,630 Black or African American householders $238,997 Asian householders$135,452 Some other race householders$241,706 Hispanic or Latino householders
Median age by race in New Port Richey East
55.2 Median age for White residents52.4 59.1 28.1 Median age for Black or African American residents50.3 27.9 -513,238,288.7 Median age for American Indian / Alaska Native residents-769,874,476.2 -501,002,003.5 30.9 Median age for Asian residents-647,368,420.4 43.3 -835,555,554.7 Median age for Native Hawaiian / Pacific Islander residents-858,307,848.3 -444,051,825.2 58.0 Median age for Other race residents48.2 69.2 35.9 Median age for Two or more races residents35.9 33.4 54.5 Median age for White alone residents50.0 59.7 53.3 Median age for Hispanic or Latino residents57.1 38.8
Owner/renter occupied households by race in New Port Richey East
House owners and renters - White residents 2,811 57.6% Owner occupied2,066 42.4% Renter occupiedHouse owners and renters - Black or African American residents 55 25.5% Owner occupied160 74.5% Renter occupiedHouse owners and renters - American Indian / Alaska Native residents 45 100.0% Renter occupiedHouse owners and renters - Asian residents 13 100.0% Owner occupiedHouse owners and renters - Other race residents 64 42.7% Owner occupied86 57.3% Renter occupiedHouse owners and renters - Two or more races residents 188 55.9% Owner occupied148 44.1% Renter occupiedHouse owners and renters - White alone residents 2,614 55.6% Owner occupied2,087 44.4% Renter occupiedHouse owners and renters - Hispanic or Latino residents 464 73.3% Owner occupied169 26.7% Renter occupied
Language usage in New Port Richey East
English speakers - Total 87.8% of residents of New Port Richey East speak English at home.
6.0% of residents speak Spanish at home 524 77.4% Speak English very well153 22.6% Speak English less than very well5.2% of residents speak other language at home 392 66.9% Speak English very well194 33.1% Speak English less than very well
English speakers - Born in the United States 92.8% of residents of New Port Richey East speak English at home.
4.6% of residents speak Spanish at home 341 100.0% Speak English very well2.3% of residents speak other language at home 149 86.1% Speak English very well24 13.9% Speak English less than very well
English speakers - Native, born elsewhere 48.0% of residents of New Port Richey East speak English at home.
39.0% of residents speak Spanish at home 123 83.7% Speak English very well24 16.3% Speak English less than very well4.8% of residents speak other language at home 18 100.0% Speak English very well
English speakers - Foreign-born 34.5% of residents of New Port Richey East speak English at home.
16.8% of residents speak Spanish at home 37 25.9% Speak English very well106 74.1% Speak English less than very well44.7% of residents speak other language at home 207 54.5% Speak English very well173 45.5% Speak English less than very well
White (Caucasian) - Speak only English Native:
96.2% (8,665)Foreign-born:
42.7% (163)
White (Caucasian) - Speak another language Native:
4.0% (361)Foreign-born:
57.4% (219)
Black or African American - Speak only English Native:
96.5% (336)Foreign-born:
80.9% (18)
Black or African American - Speak another language Native:
2.9% (10)Foreign-born:
20.7% (5)
Asian - Speak only English Native:
100.0% (6)Foreign-born:
33.0% (13)
Other race - Speak only English Native:
75.9% (74)Foreign-born:
34.1% (35)
Other race - Speak another language Native:
18.1% (18)Foreign-born:
66.1% (68)
Two or more races - Speak only English Native:
64.0% (354)Foreign-born:
10.5% (17)
Two or more races - Speak another language Native:
35.6% (197)Foreign-born:
89.4% (148)
White alone - Speak only English Native:
97.7% (8,501)Foreign-born:
38.6% (189)
White alone - Speak another language Native:
2.3% (199)Foreign-born:
61.4% (300)
Hispanic or Latino - Speak only English Native:
45.0% (432)Foreign-born:
5.4% (8)
Hispanic or Latino - Speak another language Native:
55.1% (529)Foreign-born:
95.9% (140)
Foreign-born residents in New Port Richey East 748 residents are foreign born (3.4% Europe , 1.6% Latin America , 0.7% North America ).
This city:
6.3%Florida:
21.1%
Marital status for residents in New Port Richey East Marital status - White (Caucasian) population 15 years and over
Males 31.3% Never married39.5% Now married1.4% Separated11.7% Widowed16.1% DivorcedFemales 19.6% Never married39.9% Now married1.7% Separated17.4% Widowed21.4% DivorcedWomen who gave birth in the past 12 months Now married:
68.6% (112)Unmarried:
31.4% (51)
Women who did not give birth in the past 12 months Now married:
29.3% (351)Unmarried:
70.7% (846)
Marital status - Black or African American population 15 years and over
Males 29.3% Never married40.0% Now married0.0% Separated0.0% Widowed30.7% DivorcedFemales 89.4% Never married0.0% Now married0.0% Separated10.6% Widowed0.0% DivorcedWomen who did not give birth in the past 12 months Now married:
0.0% (0)Unmarried:
100.0% (49)
Marital status - Asian population 15 years and over
Males 0.0% Never married100.0% Now married0.0% Separated0.0% Widowed0.0% DivorcedFemales 0.0% Never married100.0% Now married0.0% Separated0.0% Widowed0.0% DivorcedWomen who did not give birth in the past 12 months Now married:
100.0% (22)Unmarried:
0.0% (0)
Marital status - Native Hawaiian / Pacific Islander population 15 years and over
Males 100.0% Never married0.0% Now married0.0% Separated0.0% Widowed0.0% DivorcedFemales 0.0% Never married100.0% Now married0.0% Separated0.0% Widowed0.0% DivorcedMarital status - Other race population 15 years and over
Males 39.2% Never married59.5% Now married0.0% Separated0.0% Widowed1.3% DivorcedFemales 21.4% Never married9.5% Now married54.8% Separated0.0% Widowed14.3% DivorcedWomen who did not give birth in the past 12 months Now married:
0.0% (0)Unmarried:
100.0% (11)
Marital status - Two or more races population 15 years and over
Males 43.7% Never married33.9% Now married3.3% Separated0.0% Widowed19.1% DivorcedFemales 55.2% Never married26.0% Now married7.6% Separated0.0% Widowed11.2% DivorcedWomen who gave birth in the past 12 months Now married:
100.0% (22)Unmarried:
0.0% (0)
Women who did not give birth in the past 12 months Now married:
11.7% (25)Unmarried:
88.3% (186)
Marital status - White alone, not Hispanic / Latino population 15 years and over
Males 32.9% Never married40.6% Now married1.5% Separated7.7% Widowed17.3% DivorcedFemales 19.2% Never married39.5% Now married1.8% Separated18.1% Widowed21.4% DivorcedWomen who gave birth in the past 12 months Now married:
63.5% (94)Unmarried:
36.5% (54)
Women who did not give birth in the past 12 months Now married:
29.7% (356)Unmarried:
70.3% (842)
Marital status - Hispanic or Latino population 15 years and over
Males 20.5% Never married36.4% Now married0.0% Separated36.4% Widowed6.8% DivorcedFemales 42.9% Never married34.6% Now married3.8% Separated0.0% Widowed18.8% DivorcedWomen who gave birth in the past 12 months Now married:
100.0% (28)Unmarried:
0.0% (0)
Women who did not give birth in the past 12 months Now married:
15.0% (31)Unmarried:
85.0% (178)
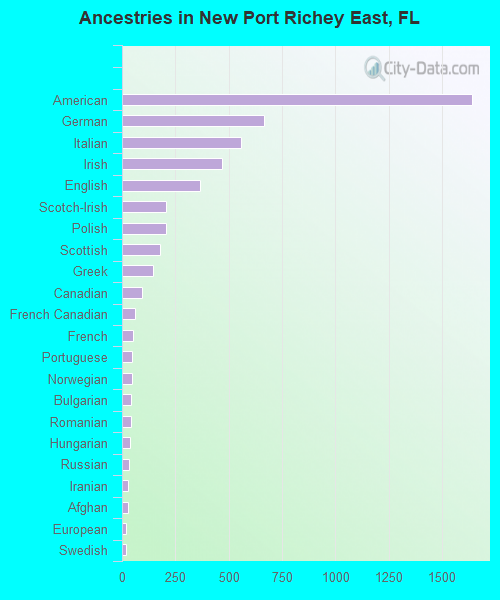
Ancestries in New Port Richey East
1,639 26.8% American667 10.9% German557 9.1% Italian467 7.6% Irish367 6.0% English206 3.4% Scotch-Irish205 3.4% Polish178 2.9% Scottish146 2.4% Greek96 1.6% Canadian60 1.0% French Canadian50 0.8% French47 0.8% Portuguese45 0.7% Norwegian42 0.7% Bulgarian42 0.7% Romanian39 0.6% Hungarian31 0.5% Russian29 0.5% Iranian26 0.4% Afghan19 0.3% European19 0.3% Swedish14 0.2% Dutch12 0.2% Slovak11 0.2% Israeli11 0.2% West Indian8 0.1% Albanian8 0.1% Cypriot7 0.1% British7 0.1% Lithuanian7 0.1% Northern European3 0.05% Haitian
Children Nativity (place of birth) in New Port Richey East
Children under 6 years - Living with two parents Both parents native 188 100.0% NativeBoth parents foreign-born 2 100.0% NativeOne native, one foreign-born parent 84 100.0% NativeChildren under 6 years - Living with one parent Native parent 496 100.0% NativeForeign-born parent 21 100.0% NativeChildren 6 to 17 years - Living with two parents Both parents native 271 100.0% NativeBoth parents foreign-born 5 100.0% Foreign-bornOne native, one foreign-born parent 13 46.6% Native15 53.4% Foreign-bornChildren 6 to 17 years - Living with one parent Native parent 485 99.7% Native1 0.3% Foreign-bornForeign-born parent 1 100.0% Native
Grandparents responsible for own grandchildren in New Port Richey East
Grandparents (30 to 59 years) White / Caucasian 38 36.7% Responsible for grandchildren65 63.3% Not responsible for grandchildrenTwo or more races 15 100.0% Responsible for grandchildrenWhite alone, not Hispanic / Latino 40 41.5% Responsible for grandchildren56 58.5% Not responsible for grandchildrenGrandparents (60 years and over) White / Caucasian 18 14.6% Responsible for grandchildren105 85.4% Not responsible for grandchildrenTwo or more races 23 100.0% Not responsible for grandchildrenWhite alone, not Hispanic / Latino 19 14.2% Responsible for grandchildren114 85.8% Not responsible for grandchildren