Races in Nampa, Idaho (ID) Detailed Stats
Data:
Races - White alone (%)
Races - White alone (% change since 2000)
Races - Black alone (%)
Races - Black alone (% change since 2000)
Races - American Indian alone (%)
Races - American Indian alone (% change since 2000)
Races - Asian alone (%)
Races - Asian alone (% change since 2000)
Races - Hispanic (%)
Races - Hispanic (% change since 2000)
Races - Native Hawaiian and Other Pacific Islander alone (%)
Races - Native Hawaiian and Other Pacific Islander alone (% change since 2000)
Races - Two or more races(%)
Races - Two or more races(% change since 2000)
Races - Other race alone (%)
Races - Other race alone (% change since 2000)
Racial diversity
Place of birth - Born in state of residence (%)
Place of birth - Born in state of residence (%) - White
Place of birth - Born in state of residence (%) - Black or African American
Place of birth - Born in state of residence (%) - Asian
Place of birth - Born in state of residence (%) - Hispanic or Latino
Place of birth - Born in state of residence (%) - American Indian and Alaska Native
Place of birth - Born in state of residence (%) - Multirace
Place of birth - Born in state of residence (%) - Other Race
Place of birth - Born in other state (%)
Place of birth - Born in other state (%) - White
Place of birth - Born in other state (%) - Black or African American
Place of birth - Born in other state (%) - Asian
Place of birth - Born in other state (%) - Hispanic or Latino
Place of birth - Born in other state (%) - American Indian and Alaska Native
Place of birth - Born in other state (%) - Multirace
Place of birth - Born in other state (%) - Other Race
Place of birth - Native, outside of US (%)
Place of birth - Native, outside of US (%) - White
Place of birth - Native, outside of US (%) - Black or African American
Place of birth - Native, outside of US (%) - Asian
Place of birth - Native, outside of US (%) - Hispanic or Latino
Place of birth - Native, outside of US (%) - American Indian and Alaska Native
Place of birth - Native, outside of US (%) - Multirace
Place of birth - Native, outside of US (%) - Other Race
Place of birth - Foreign born (%)
Place of birth - Foreign born (%) - White
Place of birth - Foreign born (%) - Black or African American
Place of birth - Foreign born (%) - Asian
Place of birth - Foreign born (%) - Hispanic or Latino
Place of birth - Foreign born (%) - American Indian and Alaska Native
Place of birth - Foreign born (%) - Multirace
Place of birth - Foreign born (%) - Other Race
Residents speaking English at home (%)
Residents speaking English at home - Born in the United States (%)
Residents speaking English at home - Native, born elsewhere (%)
Residents speaking English at home - Foreign born (%)
Residents speaking Spanish at home (%)
Residents speaking Spanish at home - Born in the United States (%)
Residents speaking Spanish at home - Native, born elsewhere (%)
Residents speaking Spanish at home - Foreign born (%)
Residents speaking other language at home (%)
Residents speaking other language at home - Born in the United States (%)
Residents speaking other language at home - Native, born elsewhere (%)
Residents speaking other language at home - Foreign born (%)
Marital status - Never married (%)
Marital status - Now married (%)
Marital status - Separated (%)
Marital status - Widowed (%)
Marital status - Divorced (%)
Ancestries Reported - Arab (%)
Ancestries Reported - Czech (%)
Ancestries Reported - Danish (%)
Ancestries Reported - Dutch (%)
Ancestries Reported - English (%)
Ancestries Reported - French (%)
Ancestries Reported - French Canadian (%)
Ancestries Reported - German (%)
Ancestries Reported - Greek (%)
Ancestries Reported - Hungarian (%)
Ancestries Reported - Irish (%)
Ancestries Reported - Italian (%)
Ancestries Reported - Lithuanian (%)
Ancestries Reported - Norwegian (%)
Ancestries Reported - Polish (%)
Ancestries Reported - Portuguese (%)
Ancestries Reported - Russian (%)
Ancestries Reported - Scotch-Irish (%)
Ancestries Reported - Scottish (%)
Ancestries Reported - Slovak (%)
Ancestries Reported - Subsaharan African (%)
Ancestries Reported - Swedish (%)
Ancestries Reported - Swiss (%)
Ancestries Reported - Ukrainian (%)
Ancestries Reported - United States (%)
Ancestries Reported - Welsh (%)
Ancestries Reported - West Indian (%)
Ancestries Reported - Other (%)
Geographical mobility - Same house 1 year ago (%)
Geographical mobility - Same house 1 year ago (%) - White
Geographical mobility - Same house 1 year ago (%) - Black or African American
Geographical mobility - Same house 1 year ago (%) - Asian
Geographical mobility - Same house 1 year ago (%) - Hispanic or Latino
Geographical mobility - Same house 1 year ago (%) - American Indian and Alaska Native
Geographical mobility - Same house 1 year ago (%) - Multirace
Geographical mobility - Same house 1 year ago (%) - Other Race
Geographical mobility - Moved within same county (%)
Geographical mobility - Moved within same county (%) - White
Geographical mobility - Moved within same county (%) - Black or African American
Geographical mobility - Moved within same county (%) - Asian
Geographical mobility - Moved within same county (%) - Hispanic or Latino
Geographical mobility - Moved within same county (%) - American Indian and Alaska Native
Geographical mobility - Moved within same county (%) - Multirace
Geographical mobility - Moved within same county (%) - Other Race
Geographical mobility - Moved from different county within same state (%)
Geographical mobility - Moved from different county within same state (%) - White
Geographical mobility - Moved from different county within same state (%) - Black or African American
Geographical mobility - Moved from different county within same state (%) - Asian
Geographical mobility - Moved from different county within same state (%) - Hispanic or Latino
Geographical mobility - Moved from different county within same state (%) - American Indian and Alaska Native
Geographical mobility - Moved from different county within same state (%) - Multirace
Geographical mobility - Moved from different county within same state (%) - Other Race
Geographical mobility - Moved from different state (%)
Geographical mobility - Moved from different state (%) - White
Geographical mobility - Moved from different state (%) - Black or African American
Geographical mobility - Moved from different state (%) - Asian
Geographical mobility - Moved from different state (%) - Hispanic or Latino
Geographical mobility - Moved from different state (%) - American Indian and Alaska Native
Geographical mobility - Moved from different state (%) - Multirace
Geographical mobility - Moved from different state (%) - Other Race
Geographical mobility - Moved from abroad (%)
Geographical mobility - Moved from abroad (%) - White
Geographical mobility - Moved from abroad (%) - Black or African American
Geographical mobility - Moved from abroad (%) - Asian
Geographical mobility - Moved from abroad (%) - Hispanic or Latino
Geographical mobility - Moved from abroad (%) - American Indian and Alaska Native
Geographical mobility - Moved from abroad (%) - Multirace
Geographical mobility - Moved from abroad (%) - Other Race
Place of birth for the foreign-born population - Ireland (%)
Place of birth for the foreign-born population - Denmark (%)
Place of birth for the foreign-born population - Norway (%)
Place of birth for the foreign-born population - Sweden (%)
Place of birth for the foreign-born population - United Kingdom (%)
Place of birth for the foreign-born population - England (%)
Place of birth for the foreign-born population - Scotland (%)
Place of birth for the foreign-born population - Other Northern Europe (%)
Place of birth for the foreign-born population - Austria (%)
Place of birth for the foreign-born population - Belgium (%)
Place of birth for the foreign-born population - France (%)
Place of birth for the foreign-born population - Germany (%)
Place of birth for the foreign-born population - Netherlands (%)
Place of birth for the foreign-born population - Switzerland (%)
Place of birth for the foreign-born population - Other Western Europe (%)
Place of birth for the foreign-born population - Greece (%)
Place of birth for the foreign-born population - Italy (%)
Place of birth for the foreign-born population - Portugal (%)
Place of birth for the foreign-born population - Spain (%)
Place of birth for the foreign-born population - Other Southern Europe (%)
Place of birth for the foreign-born population - Albania (%)
Place of birth for the foreign-born population - Belarus (%)
Place of birth for the foreign-born population - Bosnia and Herzegovina (%)
Place of birth for the foreign-born population - Bulgaria (%)
Place of birth for the foreign-born population - Croatia (%)
Place of birth for the foreign-born population - Czechoslovakia (%)
Place of birth for the foreign-born population - Hungary (%)
Place of birth for the foreign-born population - Latvia (%)
Place of birth for the foreign-born population - Lithuania (%)
Place of birth for the foreign-born population - North Macedonia (Macedonia) (%)
Place of birth for the foreign-born population - Moldova (%)
Place of birth for the foreign-born population - Poland (%)
Place of birth for the foreign-born population - Romania (%)
Place of birth for the foreign-born population - Russia (%)
Place of birth for the foreign-born population - Serbia (%)
Place of birth for the foreign-born population - Ukraine (%)
Place of birth for the foreign-born population - Other Eastern Europe (%)
Place of birth for the foreign-born population - China (%)
Place of birth for the foreign-born population - Hong Kong (%)
Place of birth for the foreign-born population - Taiwan (%)
Place of birth for the foreign-born population - Japan (%)
Place of birth for the foreign-born population - Korea (%)
Place of birth for the foreign-born population - Other Eastern Asia (%)
Place of birth for the foreign-born population - Afghanistan (%)
Place of birth for the foreign-born population - Bangladesh (%)
Place of birth for the foreign-born population - India (%)
Place of birth for the foreign-born population - Iran (%)
Place of birth for the foreign-born population - Kazakhstan (%)
Place of birth for the foreign-born population - Nepal (%)
Place of birth for the foreign-born population - Pakistan (%)
Place of birth for the foreign-born population - Sri Lanka (%)
Place of birth for the foreign-born population - Uzbekistan (%)
Place of birth for the foreign-born population - Other South Central Asia (%)
Place of birth for the foreign-born population - Burma (%)
Place of birth for the foreign-born population - Cambodia (%)
Place of birth for the foreign-born population - Indonesia (%)
Place of birth for the foreign-born population - Laos (%)
Place of birth for the foreign-born population - Malaysia (%)
Place of birth for the foreign-born population - Philippines (%)
Place of birth for the foreign-born population - Singapore (%)
Place of birth for the foreign-born population - Thailand (%)
Place of birth for the foreign-born population - Vietnam (%)
Place of birth for the foreign-born population - Other South Eastern Asia (%)
Place of birth for the foreign-born population - Armenia (%)
Place of birth for the foreign-born population - Iraq (%)
Place of birth for the foreign-born population - Israel (%)
Place of birth for the foreign-born population - Jordan (%)
Place of birth for the foreign-born population - Kuwait (%)
Place of birth for the foreign-born population - Lebanon (%)
Place of birth for the foreign-born population - Saudi Arabia (%)
Place of birth for the foreign-born population - Syria (%)
Place of birth for the foreign-born population - Turkey (%)
Place of birth for the foreign-born population - Yemen (%)
Place of birth for the foreign-born population - Other Western Asia (%)
Place of birth for the foreign-born population - Eritrea (%)
Place of birth for the foreign-born population - Ethiopia (%)
Place of birth for the foreign-born population - Kenya (%)
Place of birth for the foreign-born population - Somalia (%)
Place of birth for the foreign-born population - Uganda (%)
Place of birth for the foreign-born population - Zimbabwe (%)
Place of birth for the foreign-born population - Other Eastern Africa (%)
Place of birth for the foreign-born population - Cameroon (%)
Place of birth for the foreign-born population - Congo (%)
Place of birth for the foreign-born population - Democratic Republic of Congo (Zaire) (%)
Place of birth for the foreign-born population - Other Middle Africa (%)
Place of birth for the foreign-born population - Egypt (%)
Place of birth for the foreign-born population - Morocco (%)
Place of birth for the foreign-born population - Sudan (%)
Place of birth for the foreign-born population - Other Northern Africa (%)
Place of birth for the foreign-born population - South Africa (%)
Place of birth for the foreign-born population - Other Southern Africa (%)
Place of birth for the foreign-born population - Cabo Verde (%)
Place of birth for the foreign-born population - Ghana (%)
Place of birth for the foreign-born population - Liberia (%)
Place of birth for the foreign-born population - Nigeria (%)
Place of birth for the foreign-born population - Senegal (%)
Place of birth for the foreign-born population - Sierra Leone (%)
Place of birth for the foreign-born population - Other Western Africa (%)
Place of birth for the foreign-born population - Australia (%)
Place of birth for the foreign-born population - New Zealand (%)
Place of birth for the foreign-born population - Fiji (%)
Place of birth for the foreign-born population - Micronesia (%)
Place of birth for the foreign-born population - Bahamas (%)
Place of birth for the foreign-born population - Barbados (%)
Place of birth for the foreign-born population - Cuba (%)
Place of birth for the foreign-born population - Dominica (%)
Place of birth for the foreign-born population - Dominican Republic (%)
Place of birth for the foreign-born population - Grenada (%)
Place of birth for the foreign-born population - Haiti (%)
Place of birth for the foreign-born population - Jamaica (%)
Place of birth for the foreign-born population - St. Vincent and the Grenadines (%)
Place of birth for the foreign-born population - Trinidad and Tobago (%)
Place of birth for the foreign-born population - West Indies (%)
Place of birth for the foreign-born population - Other Caribbean (%)
Place of birth for the foreign-born population - Belize (%)
Place of birth for the foreign-born population - Costa Rica (%)
Place of birth for the foreign-born population - El Salvador (%)
Place of birth for the foreign-born population - Guatemala (%)
Place of birth for the foreign-born population - Honduras (%)
Place of birth for the foreign-born population - Mexico (%)
Place of birth for the foreign-born population - Nicaragua (%)
Place of birth for the foreign-born population - Panama (%)
Place of birth for the foreign-born population - Other Central America (%)
Place of birth for the foreign-born population - Argentina (%)
Place of birth for the foreign-born population - Bolivia (%)
Place of birth for the foreign-born population - Brazil (%)
Place of birth for the foreign-born population - Chile (%)
Place of birth for the foreign-born population - Colombia (%)
Place of birth for the foreign-born population - Ecuador (%)
Place of birth for the foreign-born population - Guyana (%)
Place of birth for the foreign-born population - Peru (%)
Place of birth for the foreign-born population - Uruguay (%)
Place of birth for the foreign-born population - Venezuela (%)
Place of birth for the foreign-born population - Other South America (%)
Place of birth for the foreign-born population - Canada (%)
Place of birth for the foreign-born population - Other Northern America (%)
Place of birth for the foreign-born population - Other (%)
Latest news about races in Nampa, ID collected exclusively by city-data.com from local newspapers, TV, and radio stations
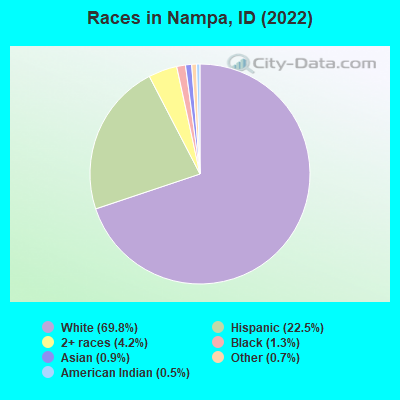
According to 2022 data, the most numerous races in Nampa, ID are White alone (77,458 residents), Hispanic (24,962 residents), and Two or more races (4,676 residents). 83.9% of Nampa residents speak English at home. 7.4% of Nampa, ID residents are foreign-born (5.7% born in Latin America, 1.0% born in Europe), which is 32.8% greater than the foreign-born rate of 5.0% across the entire state of Idaho.
Race distribution in Nampa
2000 2022
1,139,291 88.0% White alone 101,690 7.9% Hispanic 18,261 1.4% Two or more races 15,789 1.2% American Indian alone 11,641 0.9% Asian alone 4,889 0.4% Black alone 1,192 0.09% Other race alone 1,200 0.09% Native Hawaiian and Other
1,531,219 79.0% White alone 261,921 13.5% Hispanic 81,112 4.2% Two or more races 25,174 1.3% Asian alone 15,825 0.8% American Indian alone 11,868 0.6% Black alone 8,752 0.5% Other race alone 3,162 0.2% Native Hawaiian and Other
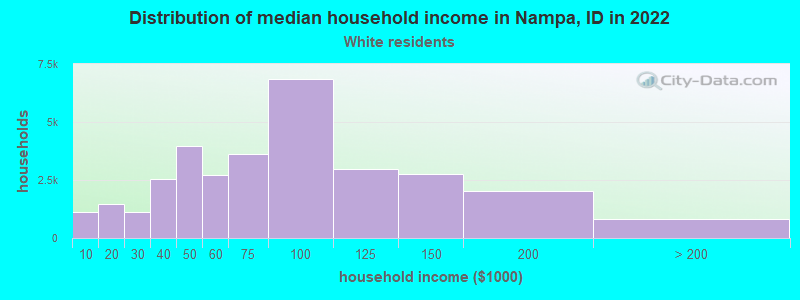
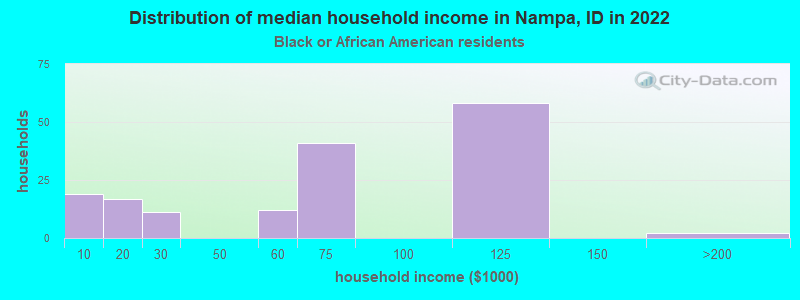
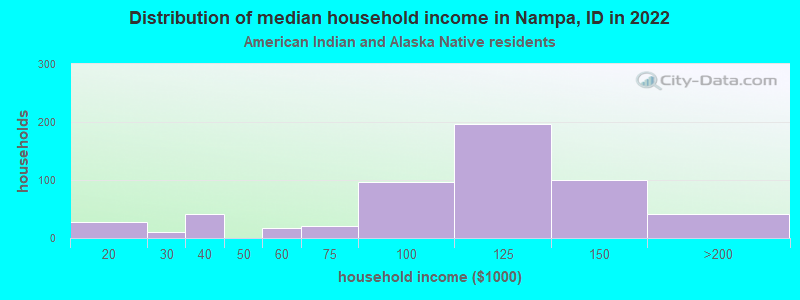
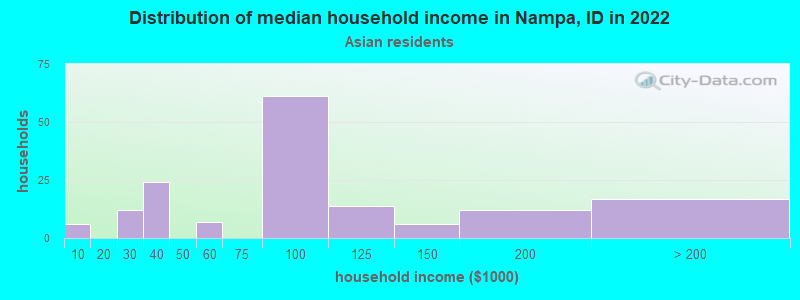
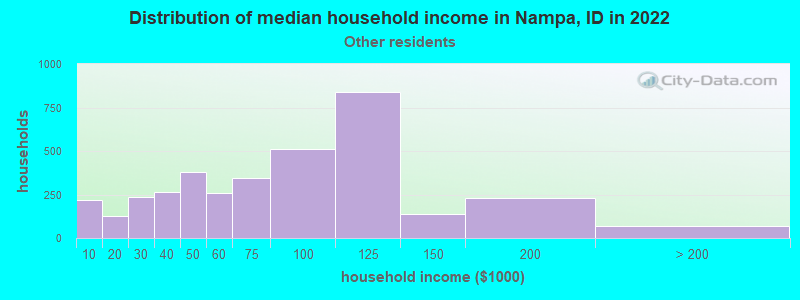
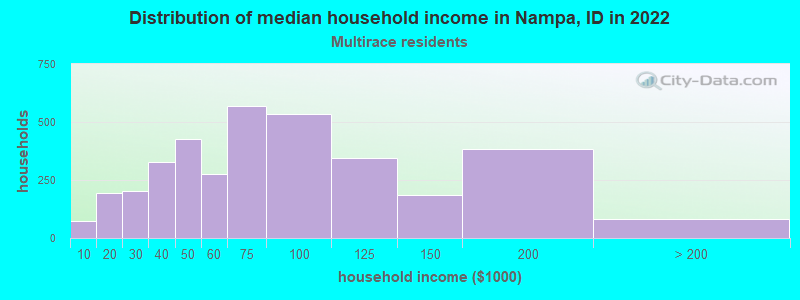
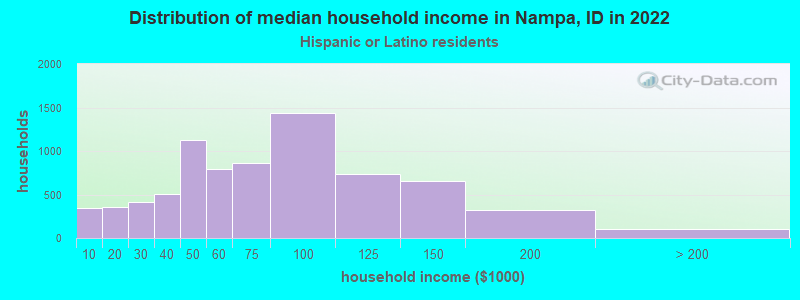
Income and house value in Nampa Median household income in 2022 $72,636 White non-Hispanic householders$73,832 Black householders$88,927 American Indian and Alaska Native householders$90,835 Asian householders$63,494 Some other race householders$53,500 Two or more races householders$62,625 Hispanic or Latino race householdersMedian 2022 house value $385,341 White Non-Hispanic householders$323,056 Black or African American householders$303,124 American Indian or Alaska Native householders $431,018 Asian householders$352,953 Native Hawaiian and other Pacific Islander householders$351,707 Some other race householders$370,808 Two or more races householders$353,368 Hispanic or Latino householders
Median age by race in Nampa
35.4 Median age for White residents34.4 36.5 30.7 Median age for Black or African American residents40.3 30.5 23.5 Median age for American Indian / Alaska Native residents23.7 15.8 31.9 Median age for Asian residents35.7 29.2 -666,666,666.0 Median age for Native Hawaiian / Pacific Islander residents-666,666,666.0 -666,666,666.0 26.8 Median age for Other race residents33.1 24.1 25.6 Median age for Two or more races residents26.3 25.2 35.8 Median age for White alone residents35.1 37.4 25.7 Median age for Hispanic or Latino residents26.4 25.2
Owner/renter occupied households by race in Nampa
House owners and renters - White residents 24,688 77.3% Owner occupied7,241 22.7% Renter occupiedHouse owners and renters - Black or African American residents 94 60.3% Owner occupied62 39.7% Renter occupiedHouse owners and renters - American Indian / Alaska Native residents 195 40.0% Owner occupied293 60.0% Renter occupiedHouse owners and renters - Asian residents 171 90.8% Owner occupied17 9.2% Renter occupiedHouse owners and renters - Native Hawaiian / Pacific Islander residents 53 62.4% Owner occupied32 37.6% Renter occupiedHouse owners and renters - Other race residents 1,217 48.2% Owner occupied1,307 51.8% Renter occupiedHouse owners and renters - Two or more races residents 2,166 69.1% Owner occupied970 30.9% Renter occupiedHouse owners and renters - White alone residents 23,422 78.2% Owner occupied6,512 21.8% Renter occupiedHouse owners and renters - Hispanic or Latino residents 4,092 61.0% Owner occupied2,617 39.0% Renter occupied
Language usage in Nampa
English speakers - Total 83.9% of residents of Nampa speak English at home.
13.2% of residents speak Spanish at home 8,612 63.6% Speak English very well4,939 36.4% Speak English less than very well3.0% of residents speak other language at home 1,927 63.5% Speak English very well1,107 36.5% Speak English less than very well
English speakers - Born in the United States 88.8% of residents of Nampa speak English at home.
9.1% of residents speak Spanish at home 3,655 79.3% Speak English very well956 20.7% Speak English less than very well2.1% of residents speak other language at home 1,075 98.7% Speak English very well14 1.3% Speak English less than very well
English speakers - Native, born elsewhere 89.6% of residents of Nampa speak English at home.
7.2% of residents speak Spanish at home 88 100.0% Speak English very well3.2% of residents speak other language at home 39 100.0% Speak English less than very well
English speakers - Foreign-born 17.4% of residents of Nampa speak English at home.
58.9% of residents speak Spanish at home 1,591 37.0% Speak English very well2,704 63.0% Speak English less than very well23.7% of residents speak other language at home 725 42.0% Speak English very well1,003 58.0% Speak English less than very well
White (Caucasian) - Speak only English Native:
96.0% (71,519)Foreign-born:
24.3% (573)
White (Caucasian) - Speak another language Native:
4.0% (3,015)Foreign-born:
75.7% (1,788)
Black or African American - Speak only English Native:
100.0% (671)Foreign-born:
33.2% (99)
American Indian / Alaska Native - Speak only English Native:
69.0% (693)Foreign-born:
16.6% (76)
American Indian / Alaska Native - Speak another language Native:
34.5% (347)Foreign-born:
84.9% (386)
Asian - Speak only English Native:
27.1% (104)Foreign-born:
23.4% (56)
Asian - Speak another language Native:
97.5% (375)Foreign-born:
74.4% (177)
Native Hawaiian / Pacific Islander - Speak another language Native:
7.4% (22)Foreign-born:
100.0% (49)
Other race - Speak only English Native:
48.7% (3,493)Foreign-born:
9.9% (175)
Other race - Speak another language Native:
51.3% (3,679)Foreign-born:
90.1% (1,598)
Two or more races - Speak only English Native:
74.7% (7,552)Foreign-born:
8.5% (137)
Two or more races - Speak another language Native:
25.3% (2,561)Foreign-born:
91.5% (1,472)
White alone - Speak only English Native:
97.4% (68,669)Foreign-born:
34.8% (527)
White alone - Speak another language Native:
2.6% (1,812)Foreign-born:
65.2% (987)
Hispanic or Latino - Speak only English Native:
55.0% (10,039)Foreign-born:
9.7% (460)
Hispanic or Latino - Speak another language Native:
45.0% (8,215)Foreign-born:
90.3% (4,295)
Foreign-born residents in Nampa 8,153 residents are foreign born (5.7% Latin America , 1.0% Europe ).
Marital status for residents in Nampa Marital status - White (Caucasian) population 15 years and over
Males 31.7% Never married53.8% Now married0.8% Separated0.8% Widowed12.9% DivorcedFemales 22.9% Never married56.1% Now married1.1% Separated3.1% Widowed16.8% DivorcedWomen who gave birth in the past 12 months Now married:
67.4% (1,027)Unmarried:
32.6% (497)
Women who did not give birth in the past 12 months Now married:
53.3% (9,618)Unmarried:
46.7% (8,418)
Marital status - Black or African American population 15 years and over
Males 33.0% Never married49.5% Now married0.0% Separated0.0% Widowed17.5% DivorcedFemales 67.2% Never married32.8% Now married0.0% Separated0.0% Widowed0.0% DivorcedWomen who did not give birth in the past 12 months Now married:
29.2% (73)Unmarried:
70.8% (178)
Marital status - American Indian / Alaska Native population 15 years and over
Males 63.2% Never married35.3% Now married1.5% Separated0.0% Widowed0.0% DivorcedFemales 43.1% Never married43.3% Now married0.0% Separated4.9% Widowed8.7% DivorcedWomen who gave birth in the past 12 months Now married:
0.0% (0)Unmarried:
100.0% (5)
Women who did not give birth in the past 12 months Now married:
50.0% (240)Unmarried:
50.0% (240)
Marital status - Asian population 15 years and over
Males 38.9% Never married38.4% Now married0.5% Separated0.0% Widowed22.2% DivorcedFemales 41.0% Never married48.9% Now married2.3% Separated4.2% Widowed3.6% DivorcedWomen who did not give birth in the past 12 months Now married:
30.8% (59)Unmarried:
69.2% (133)
Marital status - Native Hawaiian / Pacific Islander population 15 years and over
Males 46.3% Never married53.7% Now married0.0% Separated0.0% Widowed0.0% DivorcedFemales 67.2% Never married32.8% Now married0.0% Separated0.0% Widowed0.0% DivorcedWomen who did not give birth in the past 12 months Now married:
32.8% (60)Unmarried:
67.2% (123)
Marital status - Other race population 15 years and over
Males 40.9% Never married49.8% Now married2.5% Separated0.8% Widowed6.1% DivorcedFemales 45.8% Never married38.0% Now married2.0% Separated1.0% Widowed13.2% DivorcedWomen who gave birth in the past 12 months Now married:
100.0% (75)Unmarried:
0.0% (0)
Women who did not give birth in the past 12 months Now married:
36.8% (1,010)Unmarried:
63.2% (1,733)
Marital status - Two or more races population 15 years and over
Males 42.7% Never married44.6% Now married0.0% Separated5.4% Widowed7.2% DivorcedFemales 30.6% Never married55.4% Now married2.0% Separated5.4% Widowed6.6% DivorcedWomen who gave birth in the past 12 months Now married:
64.7% (97)Unmarried:
35.3% (53)
Women who did not give birth in the past 12 months Now married:
52.6% (1,413)Unmarried:
47.4% (1,275)
Marital status - White alone, not Hispanic / Latino population 15 years and over
Males 31.3% Never married54.1% Now married0.9% Separated0.9% Widowed12.9% DivorcedFemales 22.2% Never married56.0% Now married1.1% Separated3.3% Widowed17.5% DivorcedWomen who gave birth in the past 12 months Now married:
70.2% (986)Unmarried:
29.8% (419)
Women who did not give birth in the past 12 months Now married:
54.0% (8,971)Unmarried:
46.0% (7,630)
Marital status - Hispanic or Latino population 15 years and over
Males 45.2% Never married44.4% Now married1.0% Separated2.6% Widowed6.8% DivorcedFemales 44.7% Never married44.6% Now married2.0% Separated2.9% Widowed5.8% DivorcedWomen who gave birth in the past 12 months Now married:
43.0% (99)Unmarried:
57.0% (131)
Women who did not give birth in the past 12 months Now married:
39.2% (2,392)Unmarried:
60.8% (3,714)
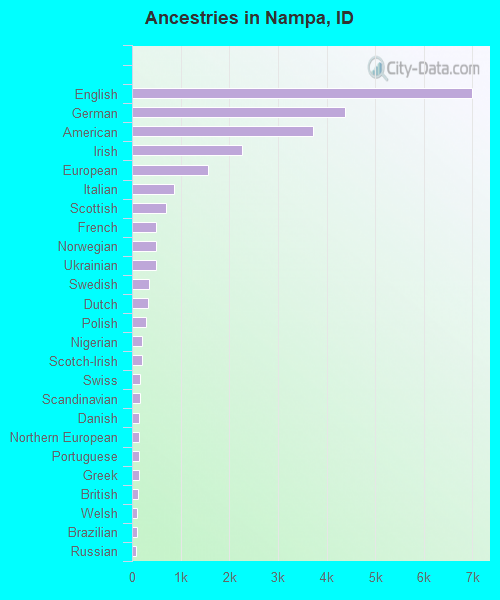
Ancestries in Nampa
6,991 14.7% English4,383 9.2% German3,723 7.8% American2,263 4.8% Irish1,556 3.3% European855 1.8% Italian709 1.5% Scottish490 1.0% French489 1.0% Norwegian488 1.0% Ukrainian345 0.7% Swedish322 0.7% Dutch295 0.6% Polish213 0.4% Nigerian211 0.4% Scotch-Irish169 0.4% Swiss160 0.3% Scandinavian152 0.3% Danish149 0.3% Northern European148 0.3% Portuguese138 0.3% Greek131 0.3% British98 0.2% Welsh94 0.2% Brazilian91 0.2% Russian88 0.2% Arab84 0.2% Canadian72 0.2% French Canadian67 0.1% Hungarian40 0.08% Finnish33 0.07% Basque30 0.06% Yugoslavian29 0.06% Czechoslovakian27 0.06% Austrian22 0.05% Slovak20 0.04% African19 0.04% Iranian19 0.04% Czech17 0.04% Eastern European16 0.03% West Indian14 0.03% Croatian10 0.02% Armenian7 0.01% Belgian7 0.01% Moroccan5 0.01% Pennsylvania German4 0.01% Serbian
Geographical mobility in Nampa Same house 1 year ago 68,525 83.3% White (Caucasian)853 79.8% Black or African American3,036 99.0% American Indian / Alaska Native694 96.8% Asian345 100.0% Native Hawaiian / Pacific Islander8,983 85.8% Other race11,106 87.7% Two or more races63,787 83.2% White alone, not Hispanic / Latino23,750 86.1% Hispanic or LatinoMoved within same county 5,579 6.8% White / Caucasian165 15.5% Black or African American20 0.7% American Indian / Alaska Native11 1.5% Asian887 8.5% Other race804 6.3% Two or more races4,760 6.2% White alone, not Hispanic / Latino2,068 7.5% Hispanic or LatinoMoved within same state 4,164 5.1% White / Caucasian21 2.0% Black or African American10 0.3% American Indian / Alaska Native1 0.2% Asian368 3.5% Other race596 4.7% Two or more races4,164 5.4% White alone, not Hispanic / Latino741 2.7% Hispanic or LatinoMoved from different state 3,753 4.6% White / Caucasian47 4.4% Black or African American208 2.0% Other race157 1.2% Two or more races3,753 4.9% White alone, not Hispanic / Latino380 1.4% Hispanic or LatinoMoved from abroad 199 0.2% White10 1.4% Asian128 1.2% Other race199 0.3% White alone, not Hispanic / Latino90 0.3% Hispanic or Latino
Children Nativity (place of birth) in Nampa
Children under 6 years - Living with two parents Both parents native 5,831 100.0% NativeBoth parents foreign-born 523 75.1% Native173 24.9% Foreign-bornOne native, one foreign-born parent 398 100.0% NativeChildren under 6 years - Living with one parent Native parent 2,369 100.0% NativeForeign-born parent 360 100.0% NativeChildren 6 to 17 years - Living with two parents Both parents native 10,433 100.0% NativeBoth parents foreign-born 1,576 96.2% Native62 3.8% Foreign-bornOne native, one foreign-born parent 544 100.0% NativeChildren 6 to 17 years - Living with one parent Native parent 4,248 100.0% NativeForeign-born parent 371 50.0% Native371 50.0% Foreign-born
Grandparents responsible for own grandchildren in Nampa
Grandparents (30 to 59 years) White / Caucasian 171 31.5% Responsible for grandchildren372 68.5% Not responsible for grandchildrenAsian 33 100.0% Responsible for grandchildrenNative Hawaiian / Pacific Islander 26 100.0% Responsible for grandchildrenOther race 54 20.5% Responsible for grandchildren209 79.5% Not responsible for grandchildrenTwo or more races 31 100.0% Not responsible for grandchildrenWhite alone, not Hispanic / Latino 82 19.3% Responsible for grandchildren343 80.7% Not responsible for grandchildrenHispanic or Latino 203 39.5% Responsible for grandchildren312 60.5% Not responsible for grandchildrenGrandparents (60 years and over) White / Caucasian 222 24.3% Responsible for grandchildren693 75.7% Not responsible for grandchildrenOther race 148 100.0% Not responsible for grandchildrenTwo or more races 18 21.0% Responsible for grandchildren68 79.0% Not responsible for grandchildrenWhite alone, not Hispanic / Latino 211 23.2% Responsible for grandchildren699 76.8% Not responsible for grandchildrenHispanic or Latino 27 22.9% Responsible for grandchildren90 77.1% Not responsible for grandchildren